Characteristics of dissolved organic matter in lakes with diff erent eutrophic levels in southeastern Hubei Province,China*
2021-07-29WeixiangRENXiaodongWUXuguangGEGuiyingLINMengdieZHOUZijieLONGXinhuiYUWeiTIAN
Weixiang REN , Xiaodong WU , , Xuguang GE , Guiying LIN , Mengdie ZHOU ,Zijie LONG , Xinhui YU , Wei TIAN
1 College of Urban and Environmental Sciences, Hubei Normal University, Huangshi 435002, China
2 Huangshi Key Laboratory of Soil Pollution and Control, Huangshi 435002, China
Abstract Dissolved organic matter (DOM) plays a crucial role in both the carbon cycle and geochemical cycles of other nutrient elements, which is ofimportance to the management and protection of the aquatic environments. To achieve a more comprehensive understanding the characteristics of DOM in the Changjiang(Yangtze) River basin, water samples from four natural lakes (Xiandao, Baoan, Daye, and Qingshan) in southeastern Hubei Province in China with diff erent eutrophication levels were collected and analyzed.The optical characteristics were analyzed using ultraviolet-visible spectrophotometry and excitationemission matrix spectroscopy coupled with parallel factor analysis. The results show that: (1) two humiclike components (C1 and C2) and two protein-like substances (C3 and C4) of DOM were identified in all waterbodies; (2) C3 originated primarily from the degradation of microalgae and contributed substantially to humic-like components during transformation. C4 was widely present in the Changjiang River basin and its formation was related to microbial activity, rather than algal blooms or seasons. Influenced by the water mixing, the protein-like components were more likely to be transformed by microorganism, whereas humiclike components were more easily to be photobleached; (3) the concentration of DOM and the fluorescence intensity of humic-like components gradually increased with rising lake eutrophication levels. With respect to protein-like components, only C3 showed changes along the eutrophication gradients; (4) DOM showed a high affi nity with permanganate index (COD Mn) and chlorophyll a (chl a) while the relationship was variable with phosphorus. This study helps us systematically understand the DOM characteristics, microbial activities, and pollutant transformation in the Changjiang River basin and provides reference to the ecological restoration of aquatic environments.
Keyword: Hubei; eutrophic lake; dissolved organic matter (DOM); excitation-emission spectra; parallel factor analysis
1 INTRODUCTION
Dissolved organic matter (DOM) is present in waters as a class of mixtures with highly complex structure and composition (Coble et al., 1998; Liu et al., 2019b). DOM is mainly composed of humic compounds, proteins, carbohydrates, and aromatic compounds (Zhou et al., 2016b; Liu et al., 2020). The chromophoric component (CDOM) is an optical component of DOM, and is one of the important factors influencing the distribution of the underwater light field (Coble, 2007; Zhou et al., 2015; Gerea et al., 2017). DOM can be produced by either microbial secretion or photosynthesis and decomposition of plant material in water, or degradation of terrestrial organic matter that is then transported by runoff(Wang et al., 2007a; Murphy et al., 2008; Zhang et al.,2009). DOM plays a crucial role in the global carbon cycle (Zhang et al., 2010; Zhou et al., 2020).Moreover, its generation, migration, and transformation have a profound influence on the geochemical cycles of elements important as nutrient sources, such as nitrogen and phosphorus, as well as the migration of some heavy metals and organic pollutants (Spencer et al., 2008; Patidar et al., 2015;Wang et al., 2019). Therefore, the study of DOM is of great significance to the management and protection of aquatic environments.
The Changjiang (Yangtze) River basin runs west to east in China and serves as an important economic area. However, most of the lakes in the basin have experienced varying degrees of eutrophication, with intense enrichment of organic matter in the lakes from human activities in recent decades. These have a profound influence on the cycling of materials and energy flow via the lake ecosystem (Zhang et al.,2011). The majority of Hubei Province is located in the middle reaches of the Changjiang River, which covers a dense lake network and plays a pivotal role for the entire basin. Southeastern Hubei possesses the highest lake network density in the province(Compilation Committee for the Records of Lakes in Hubei Province, 2015). The characteristics of DOM in this region have rarely been reported. Therefore,research into the composition and transformation of DOM in the typical lakes in southeastern Hubei significantly helps our understanding of the biogeochemical characteristics of the Changjiang River basin and for the governance oflakes in general.
At present, it is not easy to use only one certain method to the identification of all chemical components of DOM owing to its complex composition (Sharpless and Blough, 2014). Currently,ultraviolet-visible (UV-Vis) absorption spectroscopy and three-dimensional excitation-emission matrix(EEM) spectroscopy are commonly used to acquire information, including the composition and source of DOM. These two methods are considered timesaving, highly effi cient, and sensitive (Yu et al., 2015;Song et al., 2019). However, fluorophore signals can overlap in EEM spectra, because of the complex DOM composition. To address this issue, Stedmon et al. (2003) for the first time applied parallel factor analysis (PARAFAC), a mathematical modeling method, to decompose the EEM spectral data and obtain individual fluorescent components. So far, this method has had wide applications in DOM analysis in aquatic environments, such as lakes, reservoirs, and oceans (Stedmon et al., 2003; Zhou et al., 2016a). For example, Zhou et al. (2018) used PARAFAC to perform a comprehensive analysis on the publicly available DOM data worldwide, including 97 lakes and major rivers in China, and the test report of mesoscale climate in a shallow lake. They found that while eutrophication promoted DOM production,climate warming might inhibit the accumulation of endogenous DOM in inland waters. Moreover, Zhu et al. (2020) revealed the general variation patterns in DOM composition and characteristics of six freshwater lakes at diff erent latitudes in northeastern China. In this study, we selected four typical lakes with diff ering levels of eutrophication in southeastern Hubei to analyze annual characteristics of UV-Vis absorption and EEM fluorescence spectra. We used PARAFAC to separate the fluorescent DOM components and then examined the diff erences in DOM distribution and sources among the lakes.Understanding the associated characteristics of DOM in lakes with diff erent eutrophic levels can facilitate the development of relevant management and restoration strategies that are more closely targeted to the needs of various types oflakes, which in turn improves effi ciency and limits the cost of restoring aquatic ecology. Exploring the associated characteristics of DOM in the water bodies in the study area and comparing them with other studies in the Changjiang River basin also provides a fundamental reference for more comprehensive understanding of this area.
2 MATERIAL AND METHOD
2.1 Study area
This study selected Xiandao (X), Baoan (B), Daye(D), and Qingshan (Q) lakes in southeastern Hubei Province, China for investigation (Fig.1). The water volume, surface area, and reservoir capacity of each lake are provided in Table 1 (Compilation Committee for the Records of Lakes in Hubei Province, 2015).The eutrophication levels in these lakes were: X(oligotrophic), B (mesotrophic), D (lightly eutrophic),and Q (moderately eutrophic). X is an alternate source of drinking water for the city of Huangshi, and its water quality has long been maintained at or above the national class II water standard. Water flows out of X from its northeastern part and connects to Fushui River, then runs into the Changjiang River throughFushui River. B generally has good water quality,with a small amount of cyanobacteria occurring in parts of the lake in summer. This lake is primarily fed by surface runoff and lake surface precipitation; the major rivers flowing into it are Baoan Eastport,Westport, Huandiqiao Port, and Hejing Port. The water of B passes through Changgang and enters into the Changjiang River through Fankou. To the west of D is the urban area of Daye, so cyanobacteria often bloom in the western part of this lake. The water
source of D is mainly precipitation and the eastern part of the lake connects directly to the Changjiang River. Q represents urban eutrophic water, with frequent occurrences of cyanobacterial blooms in summer and autumn. The water in Q originates from the northern foot of Luoshi Mountain and runs into the Changjiang River through Daisiwan Gate. In recent years, with the development of society and cities, the volume of water in Q has been shrinking and is currently divided into five scattered parts.

Table 1 Water area, surface area, and reservoir capacity oflakes
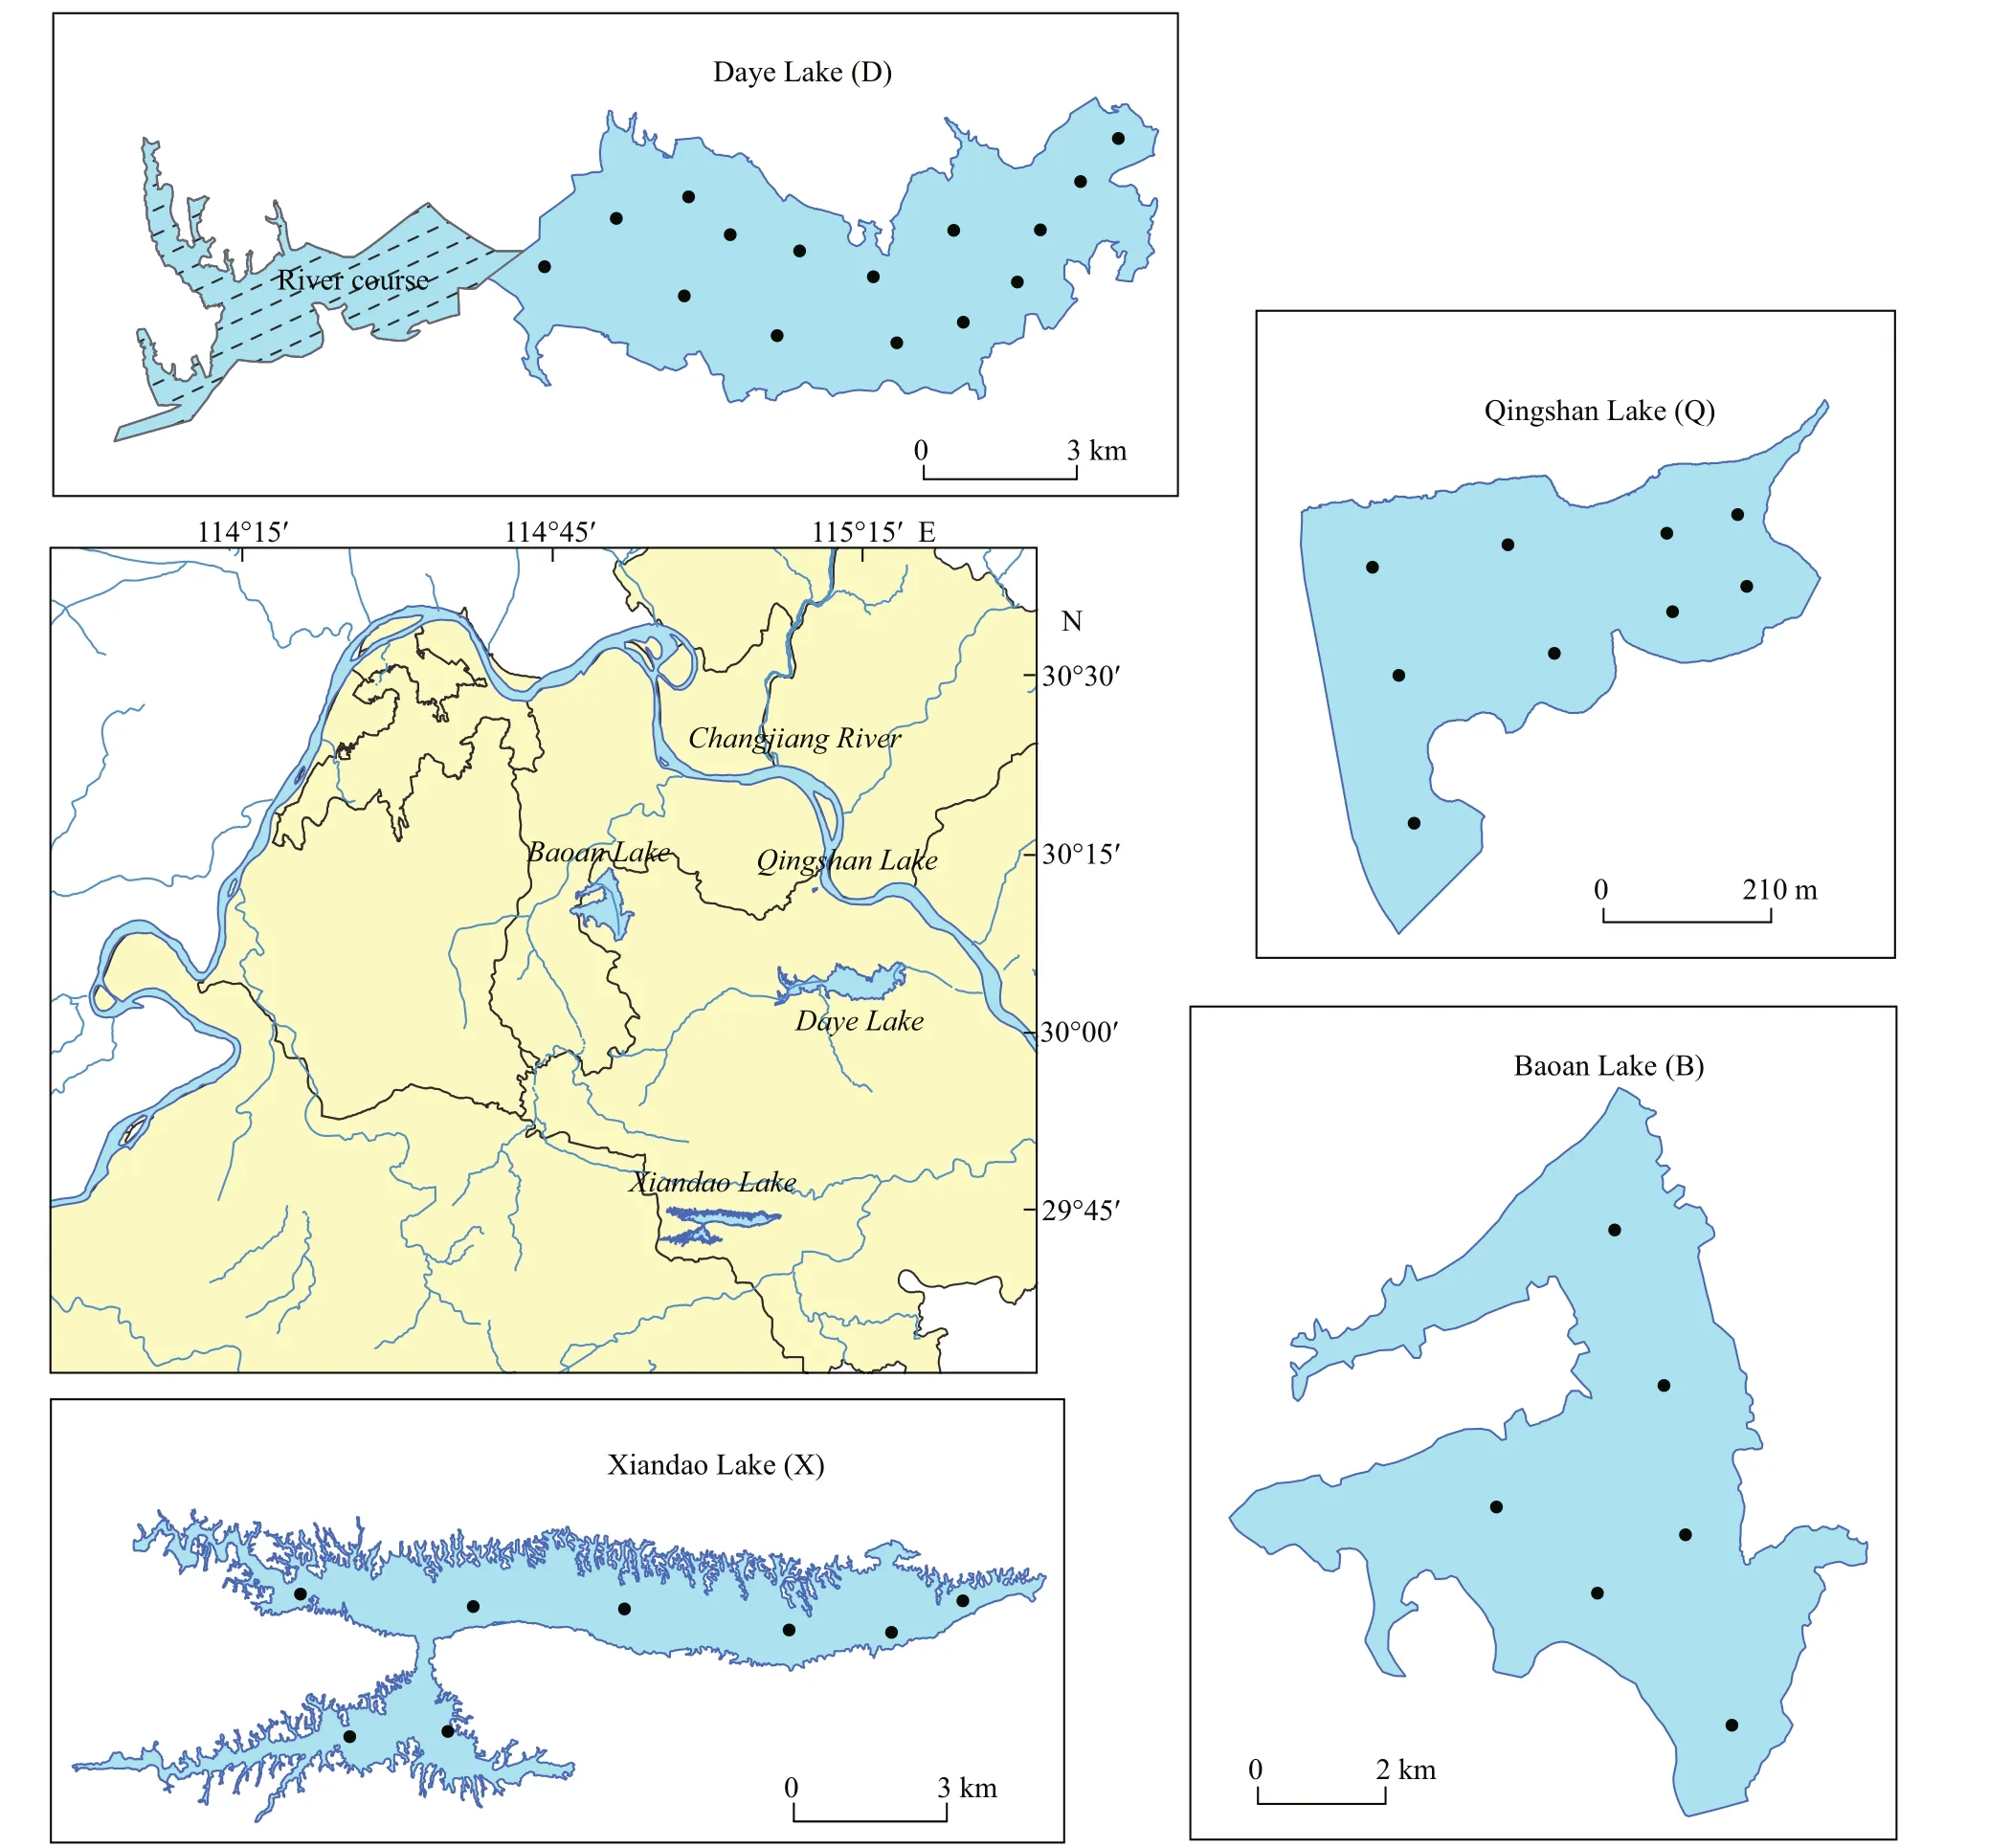
Fig.1 Location and sampling sites of typical lakes in southeastern Hubei Province, China
2.2 Sampling sites and sample collection
Water samples were collected from each lake in autumn (October 2017), winter (January 2018), spring(April 2018), and summer (July-August 2018). Water depth and Secchi depth (SD) were measured in-situ at the time of water sampling. SD was measured using a 30-cm black-white Secchi disk. Mixed water samples were obtained at 0.5 m below the water surface with a 1.5-L gravitational sampler. All samples were contained in acid-rinsed 2.5-L polyethylene flasks and immediately transported to the laboratory for the analysis of water quality indicators. Aliquots of the samples was filtered and stored. The filtrates were kept at a low temperature (-22 °C), and DOM optical measurements were completed within a week.
2.3 DOM absorption and fluorescence measurements
Water samples were passed through a 0.45-μm GF/C filter membrane that had been pre-combusted at 550 °C for 6 h. The first 20 mL of the filtrate was discarded to prevent organic carbon on the filter membrane from interfering with subsequent measurements. The filtrates were stored in 60-mL polyethylene flasks that had been soaked in diluted nitric acid overnight. A 30-mL aliquot of the filtrates was used for the analysis of dissolved organic carbon(DOC), and the remainder was used to measure DOM absorption and fluorescence.
Absorption spectra of DOM were obtained using a UV-Vis spectrophotometer (UV2700; Shimadzu,Kyoto, Japan). The cuvette had an optical path of 0.01 m. Sample absorbance was scanned over a range of 200-800 nm at an interval of 1 nm, with ultrapure water as a reference. The spectral absorption coeffi cient is usually calculated using the equation(Wang et al., 2007b):

wherea(λ′) is the uncorrected absorption coeffi cient at a wavelength ofλ(/m);A(λ) is the absorbance at a wavelength ofλ(abs); andris the optical path of the cuvette (m). The filtrate may retain some fine particles,which could aff ect the absorption measurement. Thus,the absorption coeffi cient needs to be corrected.Generally, the absorption at 700 nm is used for scattering correction:

wherea(λ) is the corrected absorption coeffi cient at a wavelength ofλ(/m); andλis the wavelength (nm).The relative content of DOM is usually approximated by the absorption coeffi cient at 350 nm,a(350)(Bricaud et al., 1981; Green and Blough, 1994; Keith et al., 2002; Cárdenas et al., 2017).
Study of the spectral slope of the DOM absorption curve is important for the analysis of DOM compositional characteristics and sources (Helms et al., 2008). Here, the spectral slope was calculated through nonlinear regression using the exponential equation proposed by Markager and Vincent (2000).The general formula of fitting model is:

whereRis the result,y0is the correction parameter,λshould use 280 nm (S275-295) or 350 nm (S350-400),Ais the absorbance at a wavelength of 280 nm (S275-295) or 350 nm (S350-400), abs. The ratio of spectral slopes over 275-295 nm and 350-400 nm, known as spectral slope ratios (SR), can be used to indicate phytoplankton activity and is related to the relative molecular mass of DOM (Markager and Vincent, 2000; Chen et al.,2010). Similarly,S275-295(i.e., spectral slope of the DOM absorption curve at 275-295 nm) andM(the ratio of DOM absorption coeffi cients at 250 and 365 nm) are also correlated with the relative molecular mass of DOM. BothS275-295andMdecrease with increasing relative molecular mass of DOM (Helms et al., 2008).
The EEM spectra of DOM were scanned using a fluorescence spectrophotometer (Fluorolog-3;HORIBA, France). The light source was a 450-W xenon lamp, in excitation wavelength range of 250-450 nm and emission wavelength of 250-580 nm.The slit width was set at 5 nm for diff raction gratings of both excitation and emission monochromators, and a 0.2-s integration time was chosen. Ultrapure water was used as a blank control to eliminate the Raman scattering of water. Raman scanning was performed at an excitation wavelength of 350 nm and emission wavelength of 365-450 nm, at 1-nm intervals(Murphy et al., 2010). Rayleigh scattering correction was performed using an EEM decomposition toolbox,and data errors caused by instrumental diff erences were corrected manually.
EEM spectra can also be used to calculate other parameters, such as the humification index (HIX),index of recent autochthonous biological activity(BIX), and fluorescence index (FI). HIX is the ratio ofintegrals of fluorescence over the emission wavelengths of 435-480 nm compared to 300-345 nm, at an excitation of 254 nm, and indicates the degree of DOM humification. It has been shown that HIX values<4 suggest DOM with weak humification and a dominant endogenous source; when HIX reaches 10,DOM is derived mainly from terrestrial sources. BIX is the ratio of fluorescence intensity at the emission wavelength of 380-430 nm, at an excitation of 310 nm. BIX indicates the proportion of endogenous substances in DOM. Generally, BIX values>1 suggest a higher contribution of new endogenous substances produced by microbial activity; BIX values of 0.6-0.7 suggest weak autochthonous production of DOM in water. FI is the ratio of fluorescence intensities at emission wavelengths of 470 and 520 nm, at an excitation of 370 nm. FI indicates the origin of humic substances in DOM. Generally, FI values <1.4 suggest a predominant terrestrial source of DOM; when FI values>1.9, DOM is derived mainly from the activities of microorganisms and algae (Huguet et al., 2009; Hur et al., 2009; Chen et al., 2010; Wang et al., 2018).
2.4 PARAFAC model construction
PARAFAC is an alternating least-squares method that can eff ectively analyze the EEM spectra of DOM and separate the DOM components. It has been widely used in the analysis of DOM fluorescence spectra (Stedmon and Markager, 2005; Zhu et al.,2020). The PARAFAC model was constructed using the drEEM and N-way toolboxes for MATLAB(http://www.models.life.ku.dk/). In total, there were 40 excitation wavelengths, 330 emission wavelengths,and 143 sample values in the EEM data matrix. The constructed model was tested by a split-half analysis.In this study, the EEM spectra were decomposed into four components, which yielded six combinations and were subjected to three groups of tests (S4C6T3)(Murphy et al., 2013). After testing, the model explained>99% of the variables in the original EEM spectra. Additionally, the maximum fluorescence intensity (Fmax) of each component was used to indicate the actual concentration of fluorescent DOM(FDOM) in this component (Zhou et al., 2016a).
2.5 Measurement of other water quality indicators
The DOC concentration was measured using a total organic carbon analyzer (TOC-V CPN;Shimadzu); the standard deviation of the instrument was<2%. The permanganate index (CODMn) was determined using the acid method CODMnindicates the quantity of organics and a portion of oxygenconsuming inorganics in the water body. One of the methods previously used to measure chemical oxygen demand, CODMnis now often used as an independent indicator. The calculation method is:

whereKis correction factor;Vis the consumption of KMnO4solution in secondary titration;V1is the consumption of KMnO4solution in the first titration;V2is the volume of the original water sample;Pis concentration of Na2C2O4solution;Cis the proportion of water in the diluted water sample.
Total nitrogen (TN) was determined by the potassium persulfate digestion method. Total phosphorus (TP) and soluble orthophosphate (PO43ˉ)were determined by molybdenum antimony spectrophotometry. Nitrate nitrogen (NO3ˉ-N) was determined by UV spectrophotometry and ammonia nitrogen (NH3-N) was determined by Nessler’s reagent spectrophotometry. Chlorophylla(chla) was determined using the 90% acetone method. All methods have been described in the literature(Editorial Board of Water and Wastewater Monitoring and Analysis Methods and State Environmental Protection Administration of China, 2002).
2.6 Statistical data analysis
Sampling site maps and spatial distribution interpolation maps were drawn using ArcGIS 10.1(ESRI Inc., Redlands, CA, USA). PARAFAC analysis of EEM data was performed using MATLAB 2012a(MathWorks Inc., Natick, MA, USA) with the drEEM_010 data package. Means, variances, standard deviations, normality text,t-tests and linear and nonlinear fitting of other data were analyzed using SPSS 21.0 (IBM Corp., Armonk, NY, USA) and Origin 8.5 (OriginLab Corp., Northampton, MA,USA) software programs. In the reporting of significance levels,P<0.010 indicates highly significant, 0.010<P<0.050 indicates significant, andP>0.050 indicates not significant.
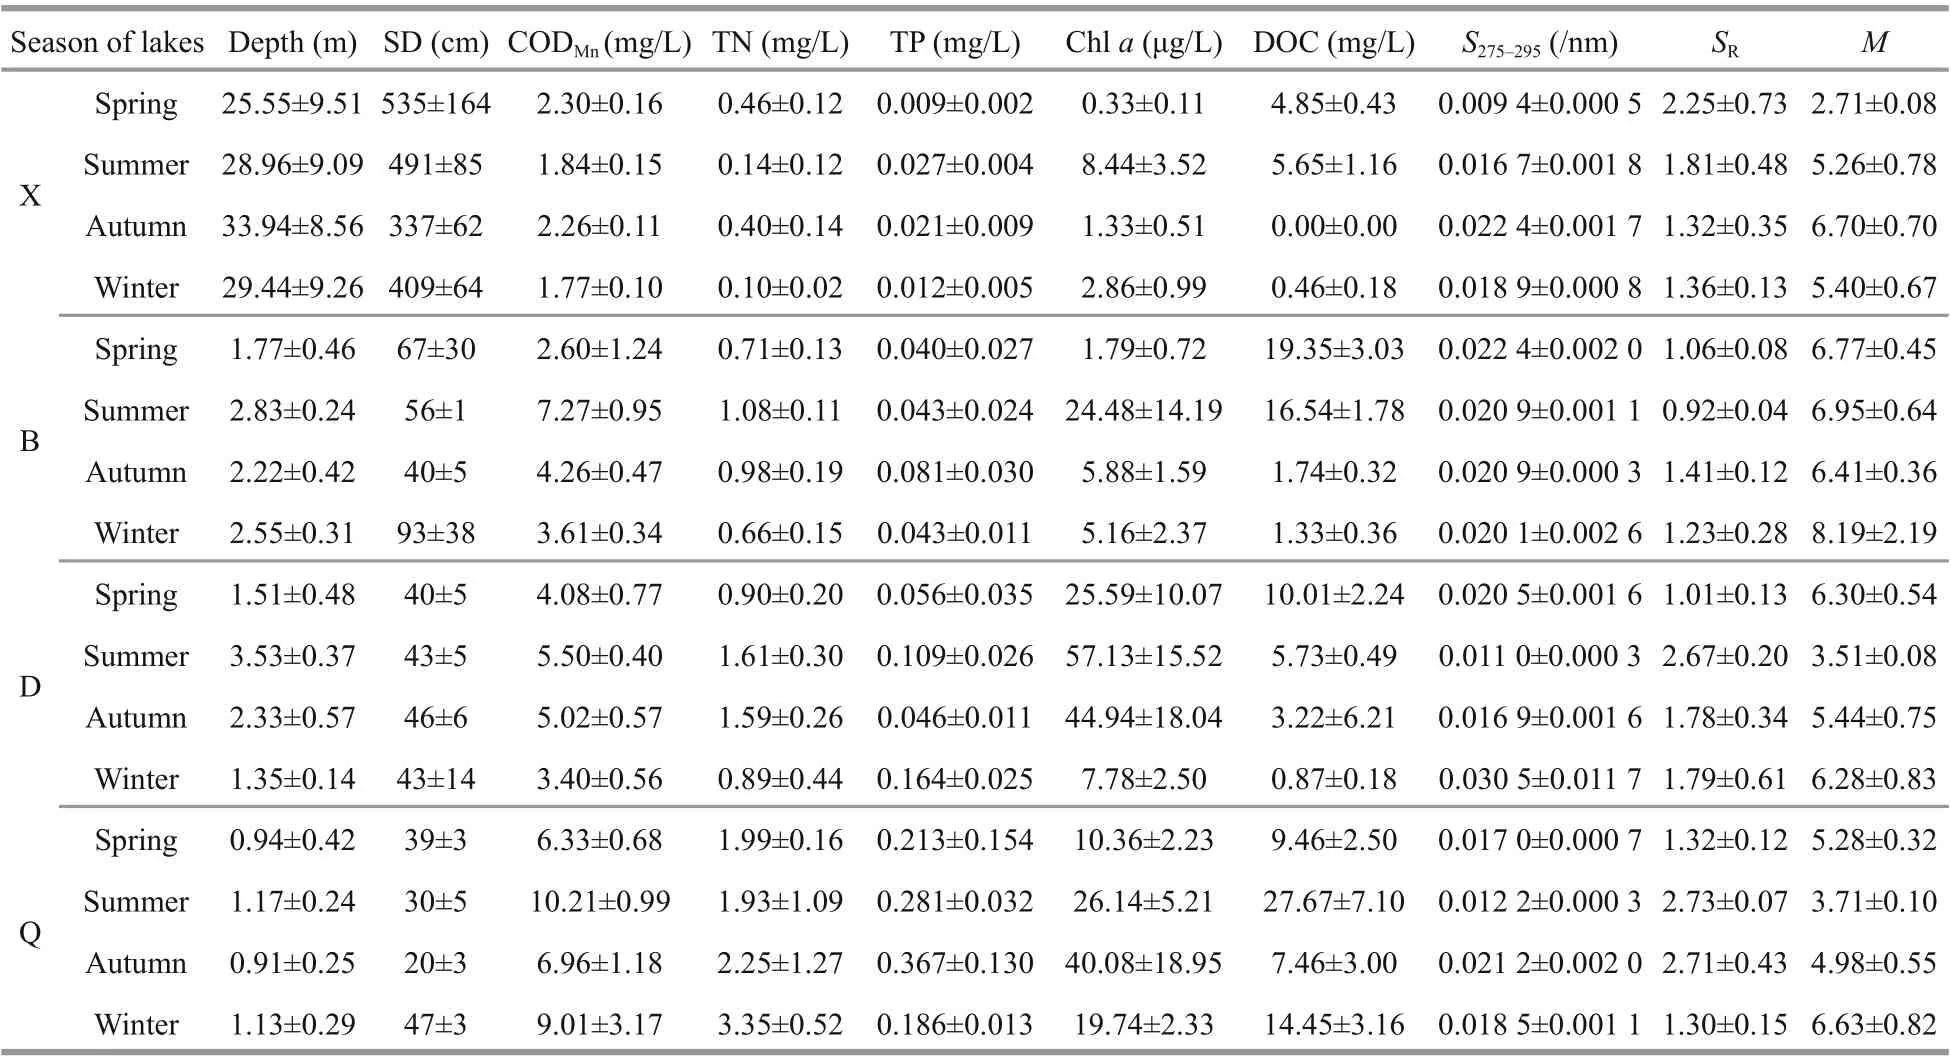
Table 2 Nutritional, biological, and optical parameters for each season in the lakes
3 RESULT
3.1 Characteristics of water quality indicators
Table 2 lists the results of SD, CODMn, TN, TP,chla, and DOC corresponding to seasonal sampling of the lakes. CODMnvalues in the lakes were ranked as X<B<D<Q. The CODMnin X was significantly lower compared with the other three lakes, while the CODMnin Q was significantly higher (P<0.010).There were significant diff erences in TN concentrations only between B and Q (P=0.000). TP concentrations diff ered significantly between Q and the other lakes (P=0.001), but not among X, B, and D.Chl-aconcentrations occurred at significantly lower levels in X and B compared with D and Q (P<0.010).DOC concentrations in Q were significantly higher than in other lakes (P<0.010), reaching a maximum of 32.83 mg/L.
With regard to seasonal variation in the lakes,CODMnvalues did not change significantly in X.However, CODMnvalues in B and Q were significantly higher in summer than other seasons (P<0.010). In D,CODMnvalues were significantly higher in summer and autumn compared with winter and spring (autumn and spring:P=0.017; other comparisons:P<0.010).
TN concentrations in winter of X were significantly lower than in spring of X (P=0.036), while TN concentrations in winter of B were significantly lower than in summer (P=0.015). Additionally, TN concentrations in both summer and autumn of D were significantly higher than in spring (summer:P=0.048;autumn:P=0.003). In Q, with the exception of spring and autumn, there were significant diff erences in TN concentrations (P<0.010). TP concentrations did not diff er significantly between various seasons in X and B. However, TP concentrations were significantly higher in winter compared with spring and autumn in D (spring:P=0.001; autumn:P=0.000). In Q, with the exception of summer and winter, there were significant diff erences in TP concentrations (P=0.048 for spring and autumn;P<0.010 for the other seasons).
Chl-aconcentrations did not diff er significantly seasonally in X. However, they were significantly higher in summer of B, reaching a maximum of 55.14 μg/L, compared with other seasons (spring:P=0.000; autumn:P=0.003; winter:P=0.002). In D,there were significant diff erences in seasonal chl-aconcentrations (P<0.010), ranging from 3.67 to 94.57 μg/L. Additionally, chl-aconcentrations in autumn of Q (up to 82.28 μg/L) were significantly higher than in other seasons (spring and winter:P=0.000; summer:P=0.007).
In X, DOC concentrations in spring and summer appeared to be significantly higher than in autumn and winter (P<0.010). Similar seasonal variations in DOC were found in B (P<0.010). Moreover, DOC concentrations in spring of D were significantly higher than in the other seasons of this lake (summer:P=0.001; autumn and winter:P=0.000), with a maximum of 19.41 mg/L. DOC concentrations in spring and autumn of Q were significantly lower than in summer and winter (P<0.010), ranging between 4.56 and 32.83 mg/L.
3.2 UV-Vis spectral parameters and their spatiotemporal distributions
We found that theSRvalues in B were significantly lower than in the other lakes (X:P=0.000; D:P=0.008;Q:P=0.003), while theMvalues in B were significantly higher (P=0.000). No significant diff erences were found in theSRorMvalues among the other lakes. TheS275-295values in B were significantly higher than X (P=0.006) and Q (P=0.017), but no significant diff erences were found compared with D(P=0.118). Thea(350) values varied broadly, with a minimum of 0.81/m in autumn of X and a maximum of 13.12/m in summer of Q. Thea(350) values in X and B were significantly lower than in D (X:P=0.000;B:P=0.002), while thea(350) values in D appeared to be lower than Q (P=0.026) (Table 2).
In terms of spatial distribution,a(350) gradually increased from north to south in B (Fig.2i-l).Particularly in winter of B, thea(350) values measured from the northern sampling sites were significantly lower than in the south (P=0.003). In D, thea(350)values were higher in the west than the east (Fig.2e-h),with the diff erence especially significant in spring(P=0.005), whereas in Q, thea(350) values were higher in the east than the west in spring (P=0.035;Fig.2m). In contrast there was seasonal variation in the spatial distribution ofa(350) in X with values that gradually increased from east to west across most of the study period (Fig.2a), while gradual decreases occurred from east to west in winter (Fig.2d).
In D and Q, there was a significant linear correlation betweena(350) and chla(D:R2=0.38,P=0.000; Q:R2=0.14,P=0.027); however, no significant correlation was found in X or B (X:R2=0.00,P=0.815; B:R2=0.02,P=0.473; Fig.3a). A similar correlation was found betweena(350) andSR(X:R2=0.10,P=0.093;B:R2=0.10,P=0.143; D:R2=0.57,P=0.000; Q:R2=0.75,P=0.000; Fig.3b). Moreover,a(350) was significantly linear negatively correlated withM(X:R2=0.36,P=0.000; B:R2=0.70,P=0.000; D:R2=0.83,P=0.000; Q:R2=0.73,P=0.000) andS275-295(X:R2=0.35,P=0.001; B:R2=0.39,P=0.001; D:R2=0.41,P=0.000; Q:R2=0.30,P=0.001) in all four lakes.
3.3 Comparison of DOM fluorescence characteristics
3.3.1 Characteristics of fluorescence indices
The HIX values in X ranged between 0.46 and 3.37(mean of 1.52±0.99), which were significantly lower than in D (P=0.049), Q (P=0.001), and B (P=0.000).The HIX values in B varied from 0.69 to 3.62 (mean of 2.42±0.90, Fig.4a). Regarding the temporal distribution, HIX values in X, D, and Q were significantly lower in spring (P<0.010), while they were significantly higher in autumn (P<0.010). The trend in D was summer<spring<winter<autumn(P<0.010). The BIX values in X were the highest,ranging from 0.92 to 1.32 (mean of 1.03±0.13), and significantly higher than in D (P=0.004) and B(P=0.038). The BIX values in D were the lowest,ranging between 0.80 and 1.18 (mean of 0.89±0.07,Fig.4b). The BIX values did not diff er significantly between various seasons in each lake (P>0.050).
3.3.2 PARAFAC components
The four FDOM components obtained from PARAFAC were compared with models published in the OpenFluor online database. Only those with a similarity of >94% between the excitation and emission spectra could be matched (Murphy et al.,2014) (Fig.5; Table 3). The excitation peak of component 1 (C1) was at ~330 nm and its emission peak was at ~420 nm. The peak of C1 appeared near the humic-like fluorescence peak C in the OpenFluor database (data shown in Table 3 and also from Coble,1996). This component may be produced autochthonously in the water or as an allochthonous source from the coastal zone, and it is often related to water salinity (Søndergaard et al., 2003; Bittar et al.,2016). Component 2 (C2) had excitation peaks at 270 and 390 nm with an emission peak at 460 nm. The first peak of C2 (270 nm) is near peak A, while the latter peak (390 nm) is not matched to conventional peak values (Table 3). There is a lack of similar studies for this component, but it has been tentatively determined to be fulvic acid and humic-like substances. Component 3 (C3) had an excitation maximum at 290 nm and an emission maximum at 345 nm. The C3 peak is located near peak T with conventional peak values (Table 3). This component is composed mainly of tyrosine and protein-like substances, and is often associated with allochthonous sediment input and autotrophic production; its relative abundance is also influenced by alkaline-phosphatase activity (Yamashita et al., 2010; Chen et al., 2017,2018b). Component 4 (C4) yielded a characteristic peak at an excitation of 275 nm and an emission of 325 nm, which is similar to conventional peak B(Table 3). This component is composed mainly of protein-like substances and is relatively sensitive to microorganisms.
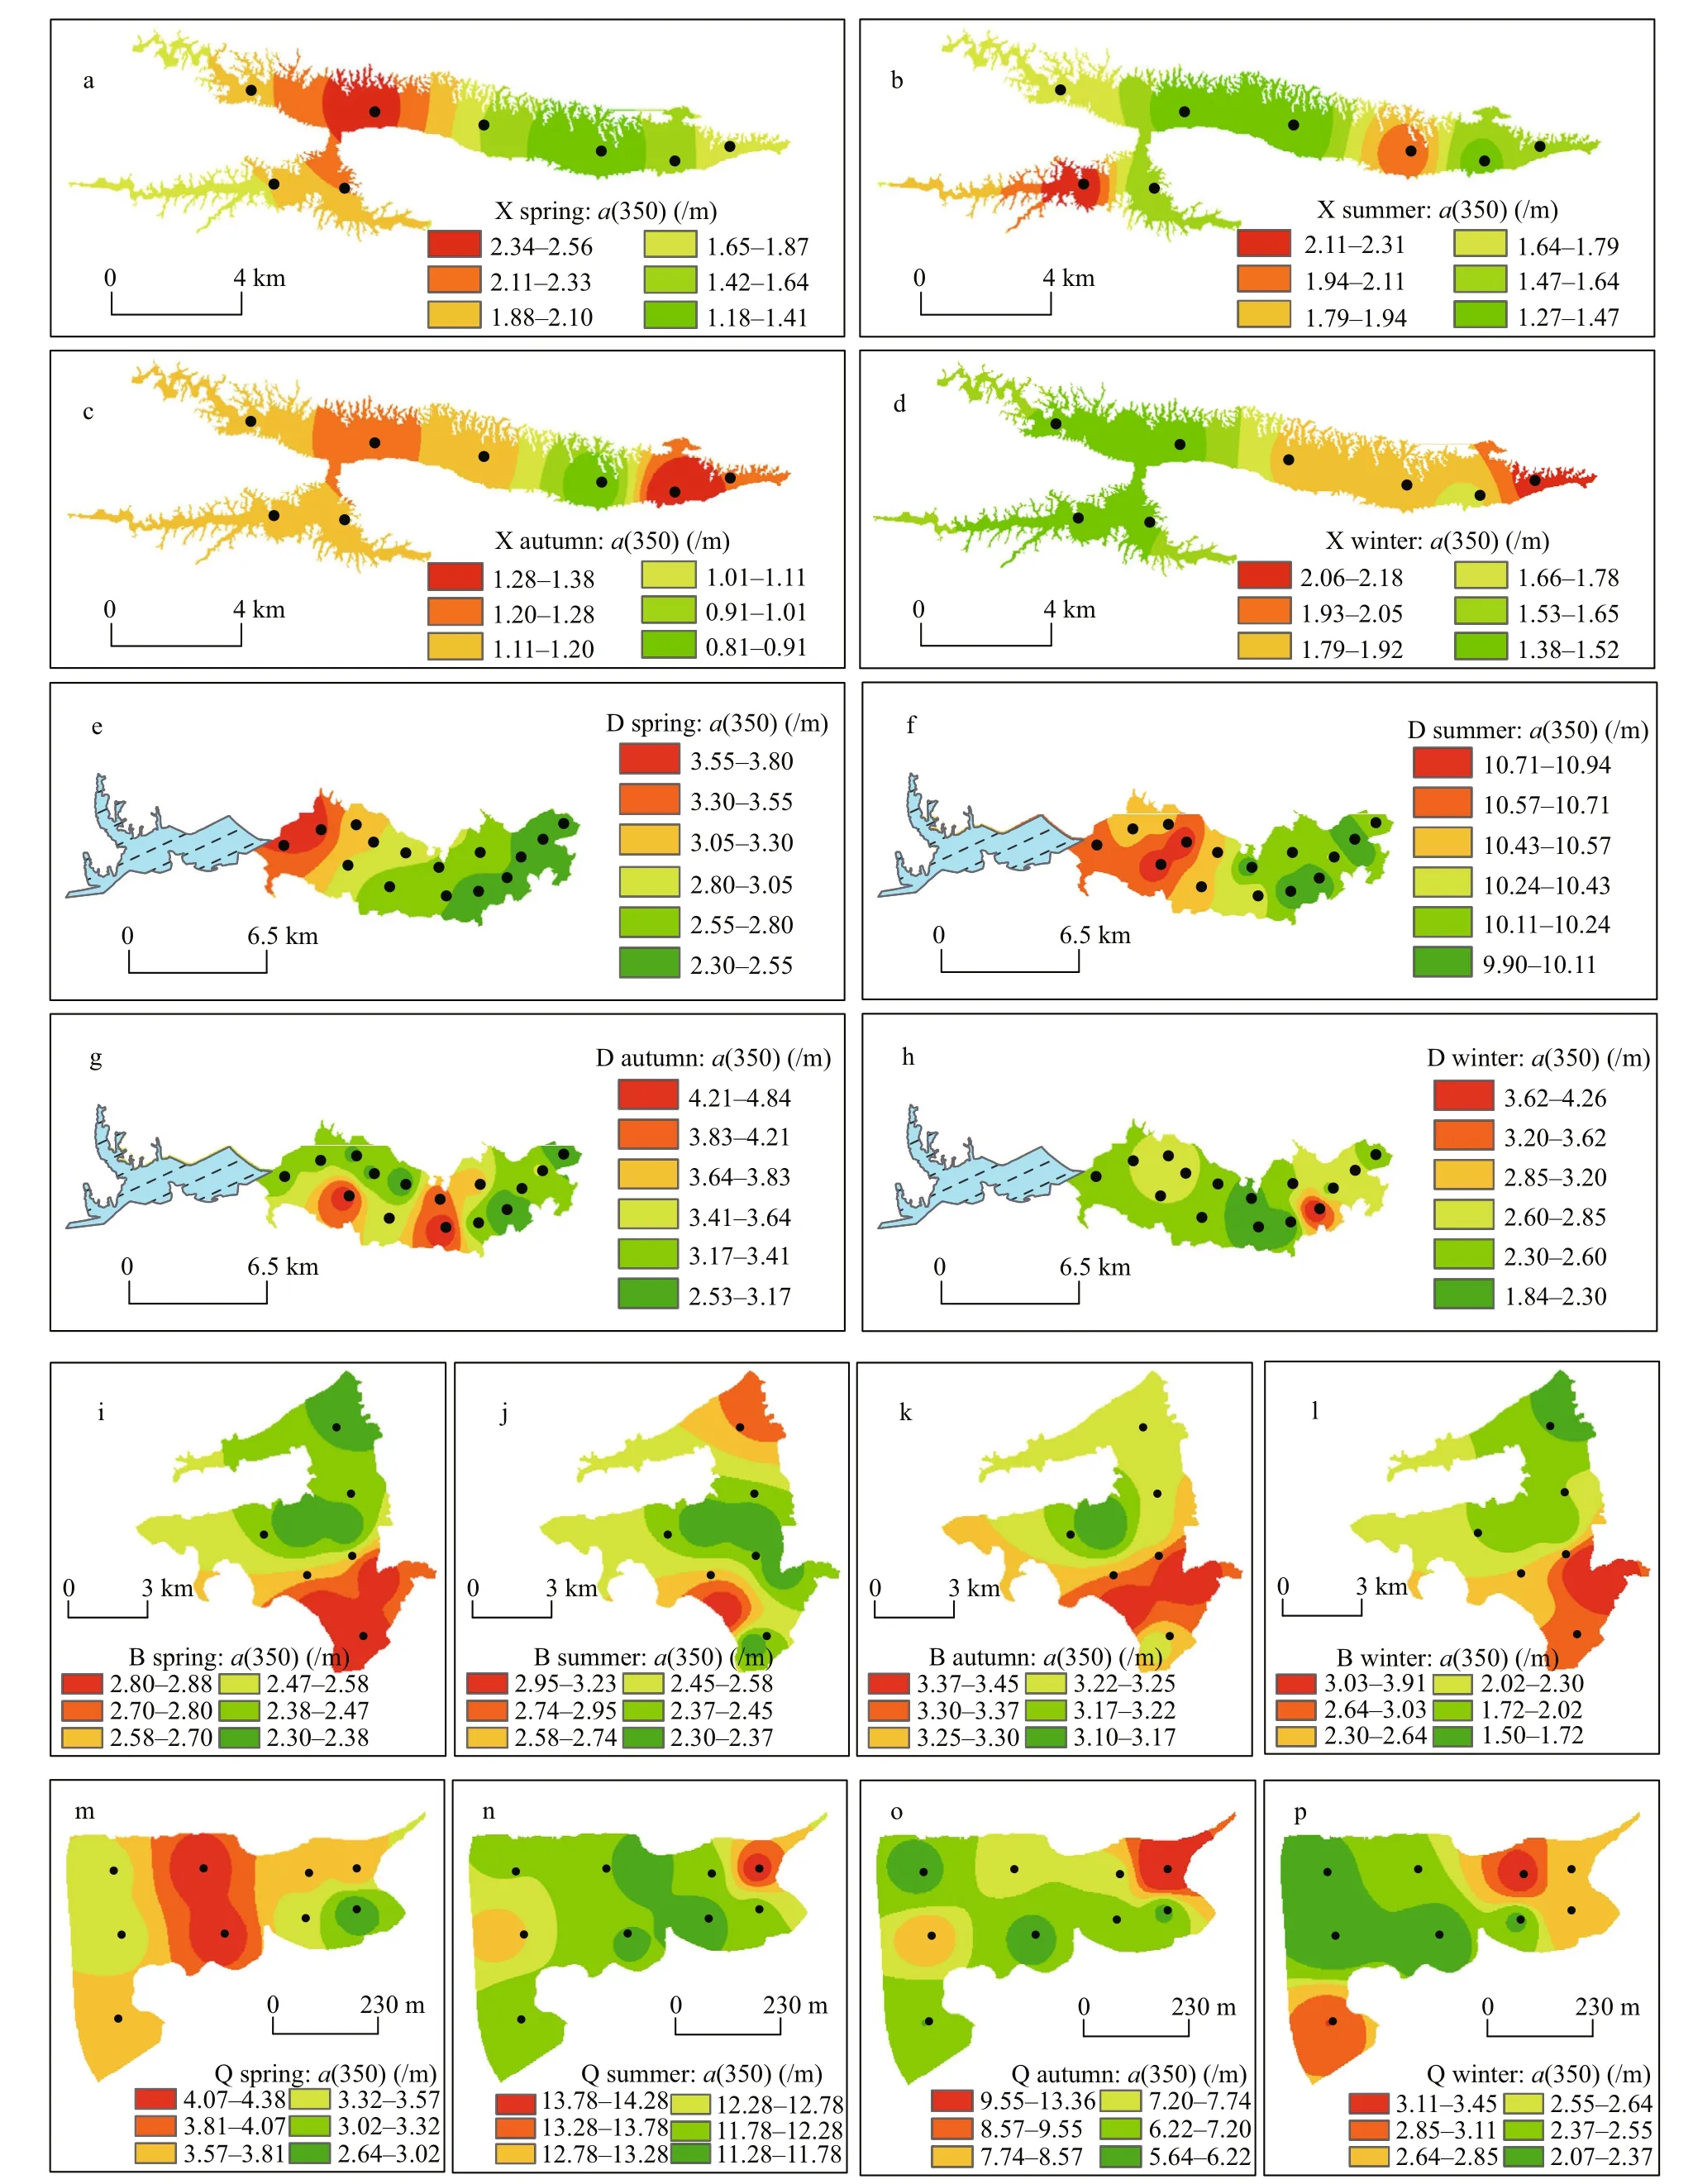
Fig.2 Spatial distribution of dissolved organic matter absorption coeffi cient at 350 nm ( a(350)) in typical lakes in southeastern Hubei Province, China
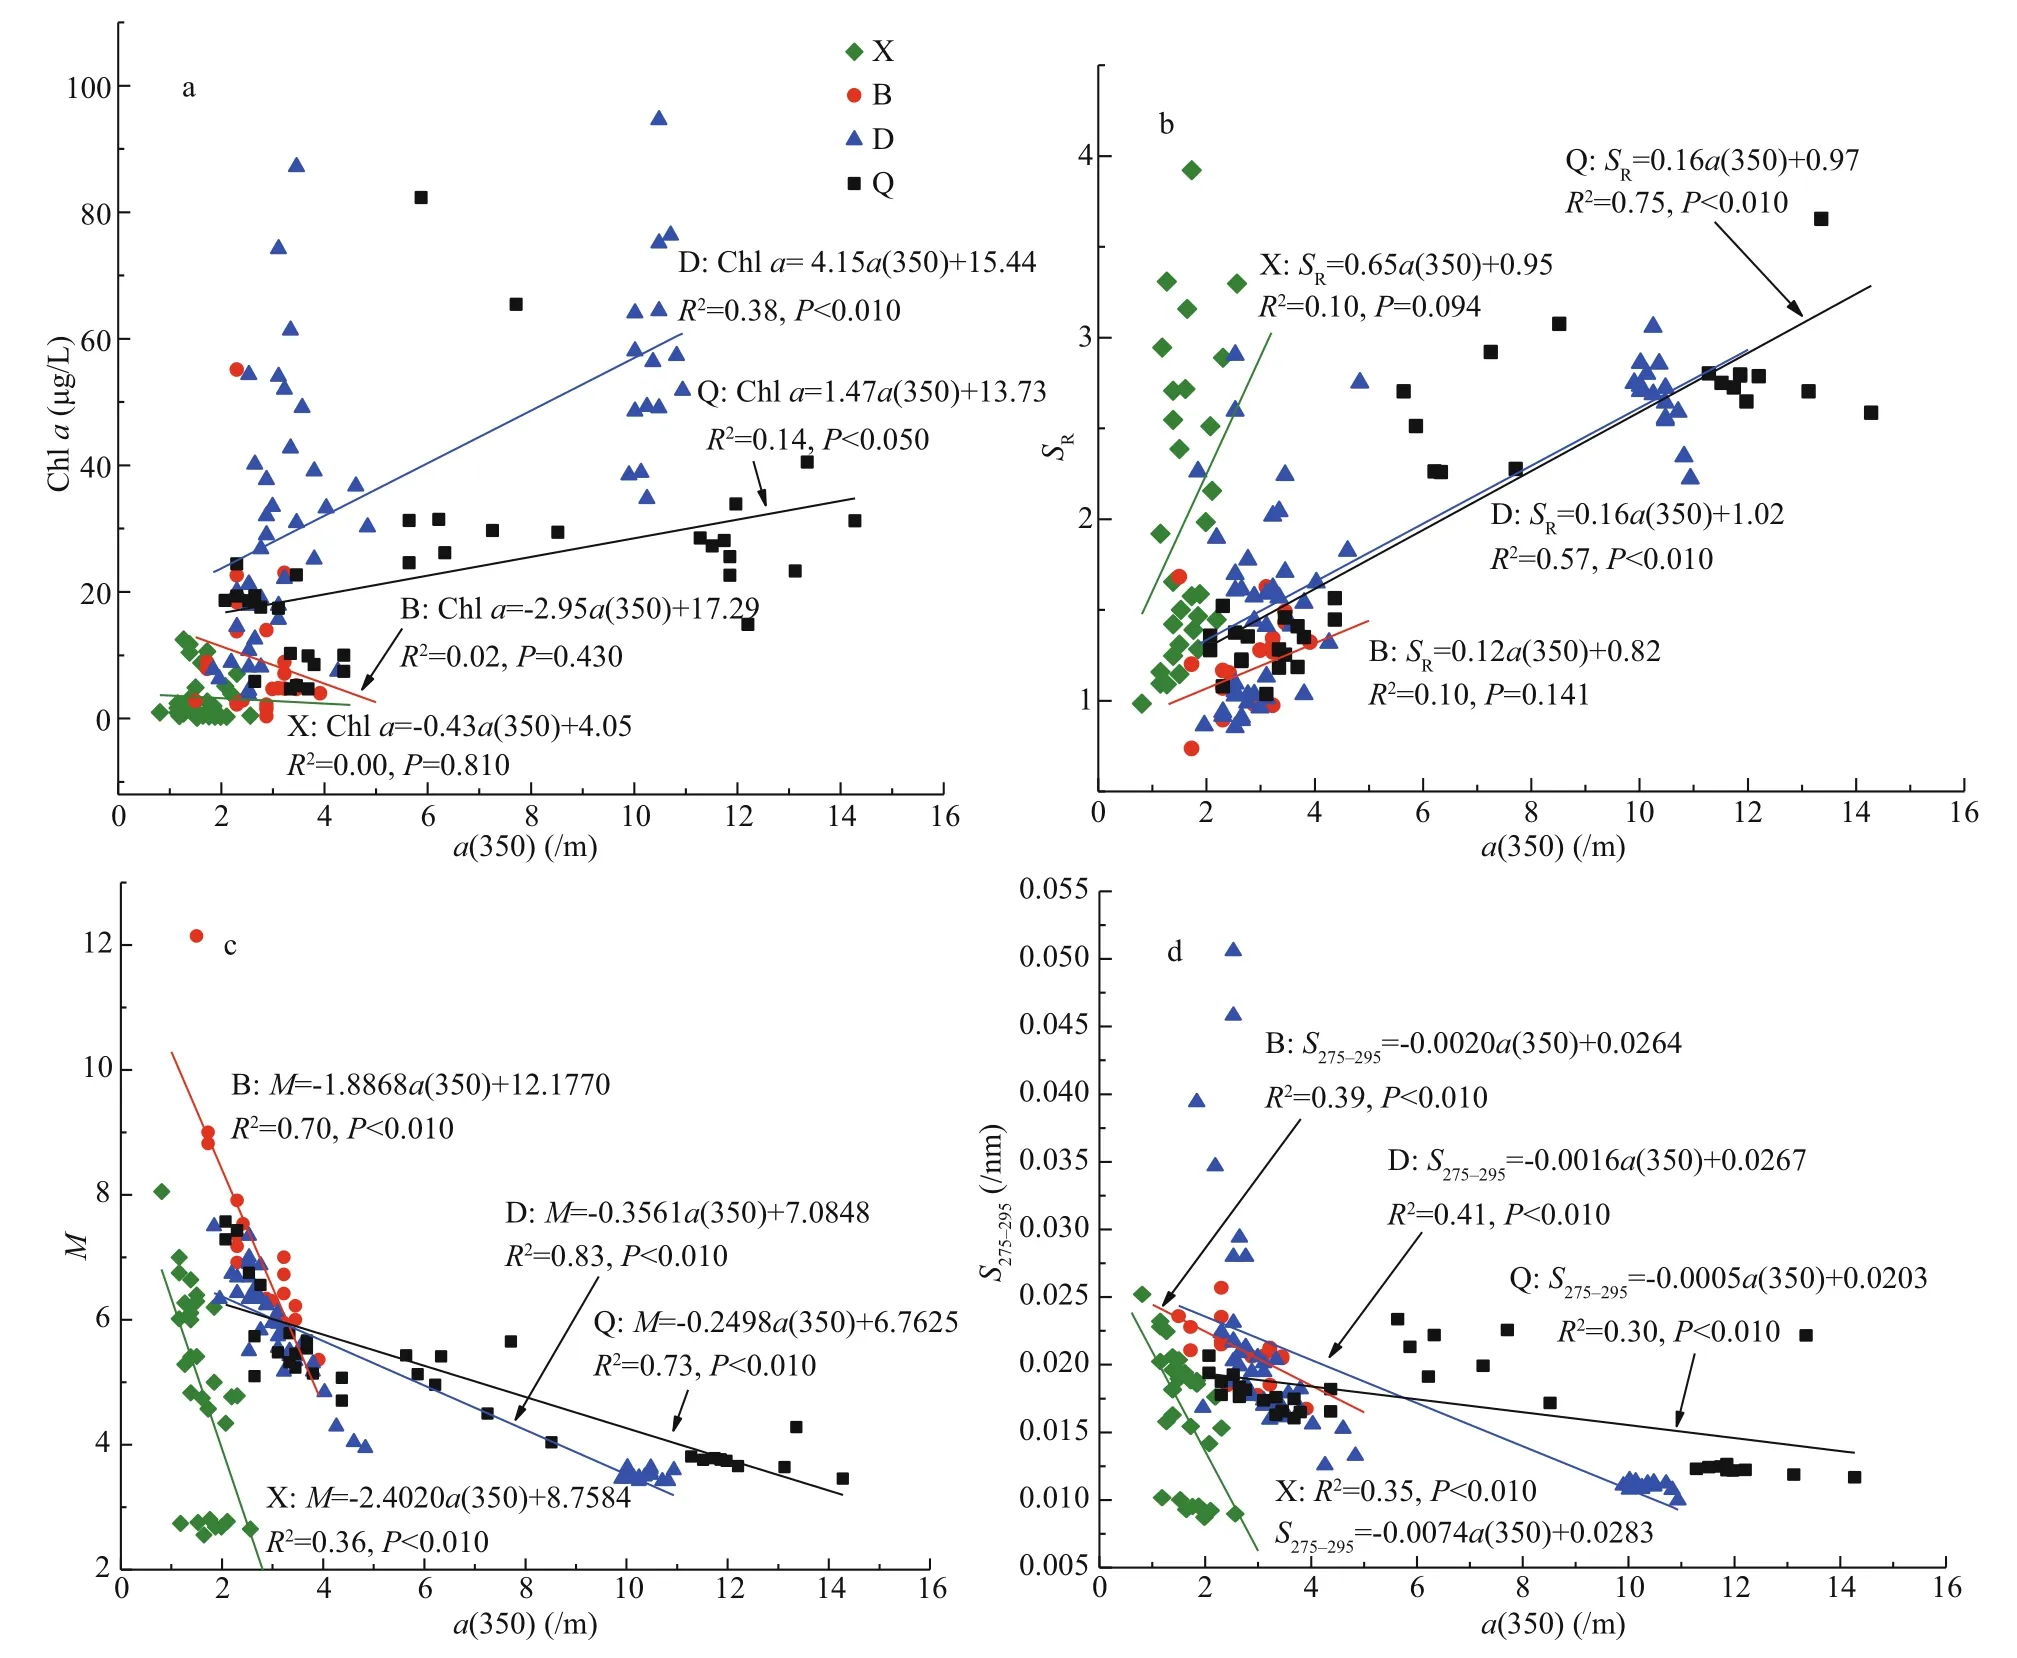
Fig.3 Mutual correlations between dissolved organic matter absorption coeffi cient at 350 nm ( a(350)) and chl- a concentration(a), spectral slope ratio ( S R) (b), the ratio of DOM absorption coeffi cients at 250 and 365 nm ( M) (c), and spectral slope of the DOM absorption curve at 275-295 nm ( S 275-295) (d)
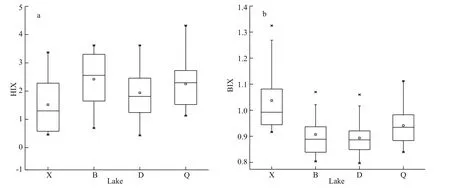
Fig.4 The distribution of humification index (HIX) (a) and index of recent autochthonous biological activity (BIX) values(b) in each lake
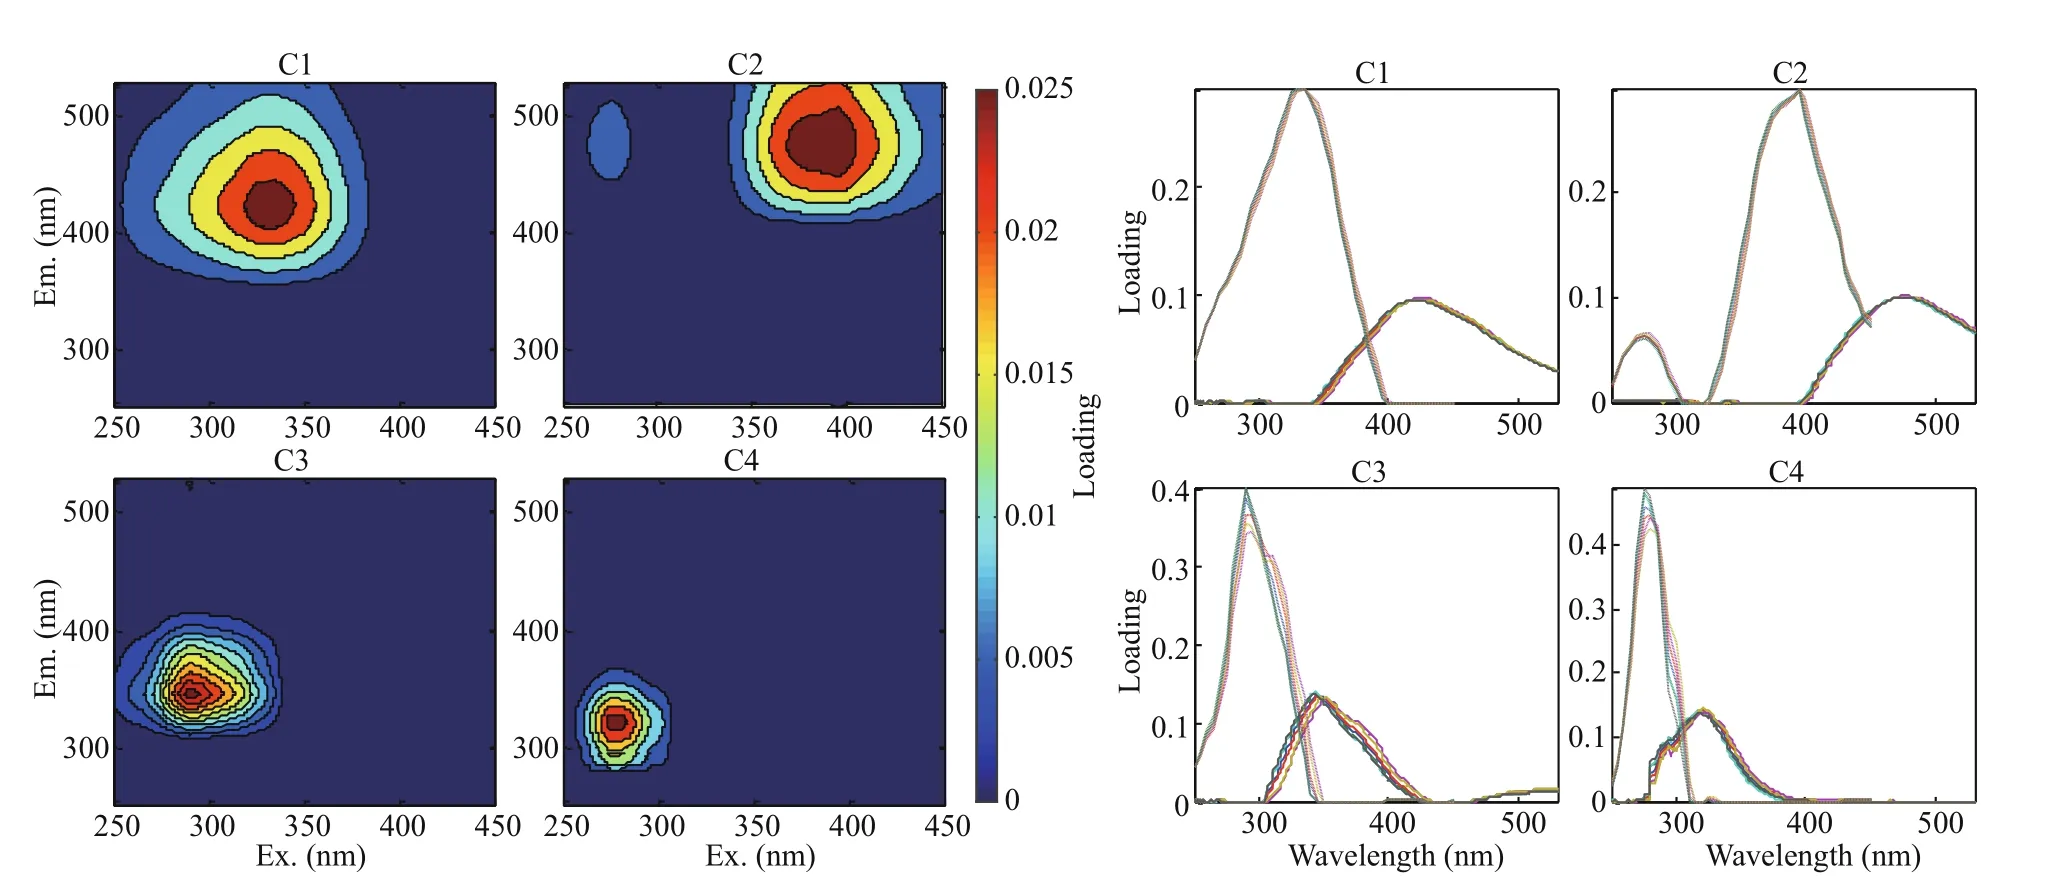
Fig.5 Fluorescent components separated by the PARAFAC model and split-half analysis

Table 3 Excitation and emission spectra of four peaks of dissolved organic matter fluorescent components separated by the PARAFAC model and compared with the OpenFluor online database
TheFmaxdata of FDOM components in the lakes are presented in Fig.6. TheFmaxvalues of both C1 and C2 were ordered as X<B<D<Q. In particular, theFmax(C1) in X was significantly lower than in the other lakes (P=0.000), ranging from 0.035 to 0.048 RU(mean of 0.039±0.003 RU). TheFmax(C1) in Q was the highest, ranging from 0.083-0.447 RU (mean of 0.166±0.081 RU), as was theFmax(C2) (0.049-0.511 RU, mean of 0.124±0.095 RU), which was significantly higher than in the other lakes (P=0.000).TheFmax(C2) in X was the lowest, varying in the range of 0.019-0.047 (mean of 0.029±0.009 RU).TheFmax(C3) in lake X showed no significant diff erence compared with B (P=0.136), but was significantly lower than Q and D (Q:P=0.019; D:P=0.033). The range ofFmax(C3) in X was 0.012-0.028 RU with a mean of 0.014±0.008 RU. TheFmax(C4) in Q showed no significant diff erence compared with X (P=0.110), but was significantly higher than D and B (D:P=0.036; B:P=0.028). The range ofFmax(C4) in Q was 0.016-0.465 RU with a mean of 0.070±0.033 RU.
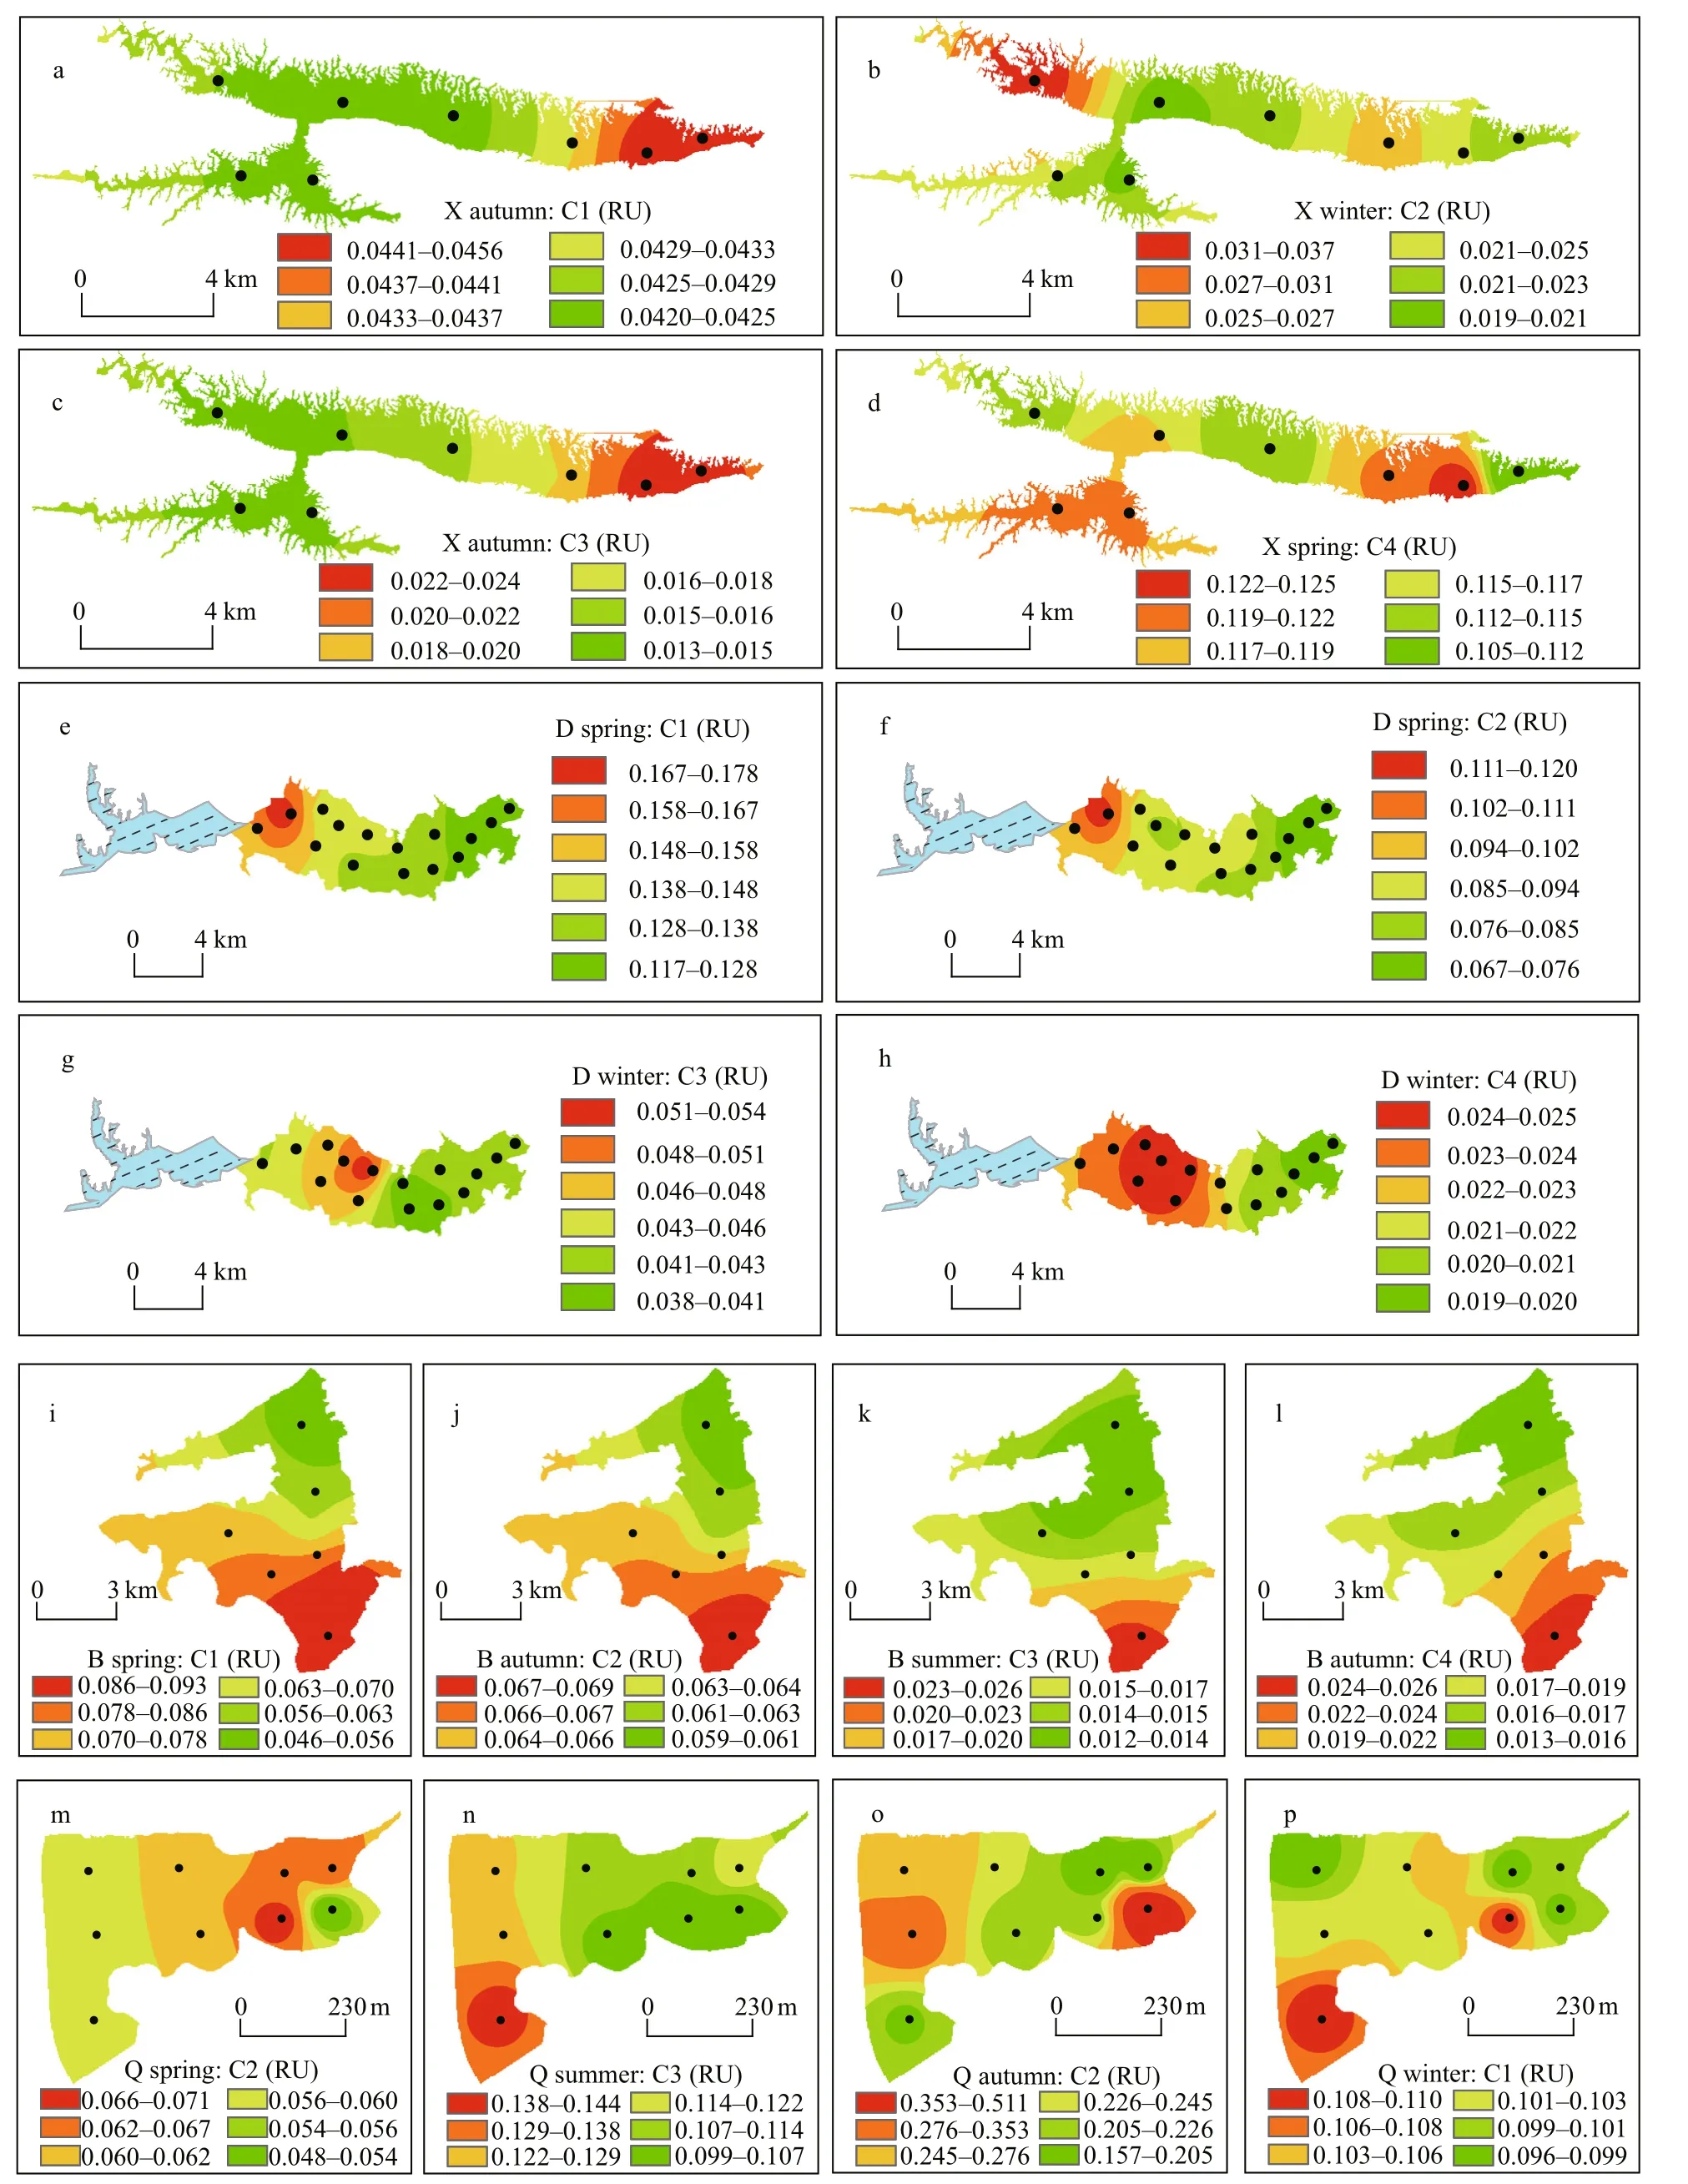
Fig.6 Spatial distribution of fluorescent dissolved organic matter components (C1-C4) in Xiandao Lake (a-d), Daye Lake(e-h), and Baoan Lake (i-l), and their seasonal spatial distribution (spring, summer, autumn, winter) in Qingshan Lake (m-p)
With regard to spatial and temporal (seasonal)variations, there were no distinct diff erences in the spatial distribution of FDOM components in X.Generally, C2 was high in the west and low in the east(Fig.6b), while C1, C3, and C4 exhibited an inverse trend (Fig.6a, c, d). None of the components had obvious seasonal variations (P>0.050). The spatial variation of these components was relatively uniform in B and D. In B, there was a gradual increase from north to south (Fig.6i-l); in D, the components gradually increased from east to west (Fig.6e-h). In both lakes, the components followed a relatively stable trend over time, with no obvious seasonal variation. The distribution of various components in Q was similar in each season, and there were diff erences among the seasons (Fig.6m-p).Specifically, highFmaxvalues in spring were concentrated in the central and northeastern lake areas, which were significantly higher than in other areas (P=0.000). In summer,Fmaxexhibited a gradually decreasing trend from west to east, even though the values rebounded in the northeast. The highFmaxvalues of autumn were concentrated in the southeast where they were significantly higher (P=0.001). In winter, higherFmaxvalues were mainly found in the central lake area and the southwest (P=0.003), while the northeast, which exhibited high values in other seasons, was a low-value area.
4 DISCUSSION
4.1 Diff erences in the source of FDOM in southeastern Hubei Province lakes
The diff erent characteristics of four types of FDOM fluorescent chromophores were obtained by the interpretation of DOM in PARAFAC, and some basic characteristics of various components in this study based on the comparison of previous reports have been determined. Accordingly, it is of greater significance to analyze the sources and characteristics of diff erent components. However, the research on DOM fluorescence characteristics oflakes in Southeast Hubei is still under investigation. The analysis of the source characteristics of FDOM in this region will provide eff ective and detailed data for ecological restoration and FDOM remote sensing inversion. These fluorescent components will be often detected in other areas, providing more comprehensive and accurate characteristics of fluorescent chromophore components, which will contribute to making the later research more accurate, more indepth, and more effi cient. The analysis of the characteristics of the components can also provide a more targeted restoration scheme for lakes damaged by diff erent types.
The relationship between DOC and the components of CDOM is shown in Table 4. C1 is more likely to be near-source humic-like substances in areas such as estuaries, while C2 is soil fulvic acid and has often been present for a certain period of time. In the current study, a strong relationship was found between C1 and C2 (R=0.889,P=0.000), both of which made considerable contributions to the absorption coeffi cienta(350) (C1:R=0.638,P=0.000; C2:R=0.416,P=0.000). This result proves that the sources from which these two components were formed should be relatively close to each other, and that humic-like components are also the main components of FDOM (Yamashita et al., 2010; Bittar et al., 2016;Wünsch et al., 2017). Humic-like C1 and C2 were the major contributors to DOM in lake B, and it has similar origin and impact on B, which is produced autochthonously by microbial metabolism in the water and derived allochthonously from humic substances in the coastal zone (Bittar et al., 2016).Cyanobacteria also reproduced well in B over summer and autumn, which contributed the protein-like C3 in this lake (P=0.035). C3 is considered to comprise protein-like substances, mainly tyrosine, and it exhibits a certain level of hydrophilicity (Xiao et al.,2019). According to the summary by Xiao et al.(2018) and Liu et al. (2011), the fluorescence peak area of C1 is between excitation wavelengths 200 nm and 350 nm with emission wavelengths of 400-500 nm, and it may be related to moderate pollution intensity. C3 is linked to allochthonous inputs of pollutants and often occurs as a pollution layer on the biofilm surface. On the one hand, this explains the significant correlation between components C1 and C3 (R=0.411,P=0.000), especially in lakes D(R=0.630,P=0.000) and Q (R=0.889,P=0.000) with frequent cyanobacterial blooms and intense exogenous pollution. To the northwest of D and in the surroundings of Q, there were sewage outlets discharging large amounts of domestic and industrial wastewaters. Additionally, C3 made a substantial contribution to C1 and C2 during its transformation process, which is why these humic-like components had relatively high near-source biological characteristics. On the other hand, our investigation showed that C3 had, overall, a high correlation witha(350) (R=0.401,P=0.000), and its fluorescence intensities were significantly higher in lakes D and Q(with frequent cyanobacterial blooms) than in lake X(with no cyanobacterial blooms) (D>X:P=0.011;Q>X:P=0.019). Moreover, other studies have indicated that DOM mainly derived from terrestrialsources has lowSRvalues, while DOM mainly from algal sources has highSRvalues (Hao et al., 2011;Chen, 2015). Here we found a significant positive correlation betweena(350) andSRin lakes D and Q,which had frequent algal blooms (P<0.01; Fig.3b).Thus, the pollutant degradation activity by algae microorganisms (including cyanobacteria) was considered to be the primary cause of C3 production(Henderson et al., 2008; Zhang et al., 2013; Chen et al., 2016).
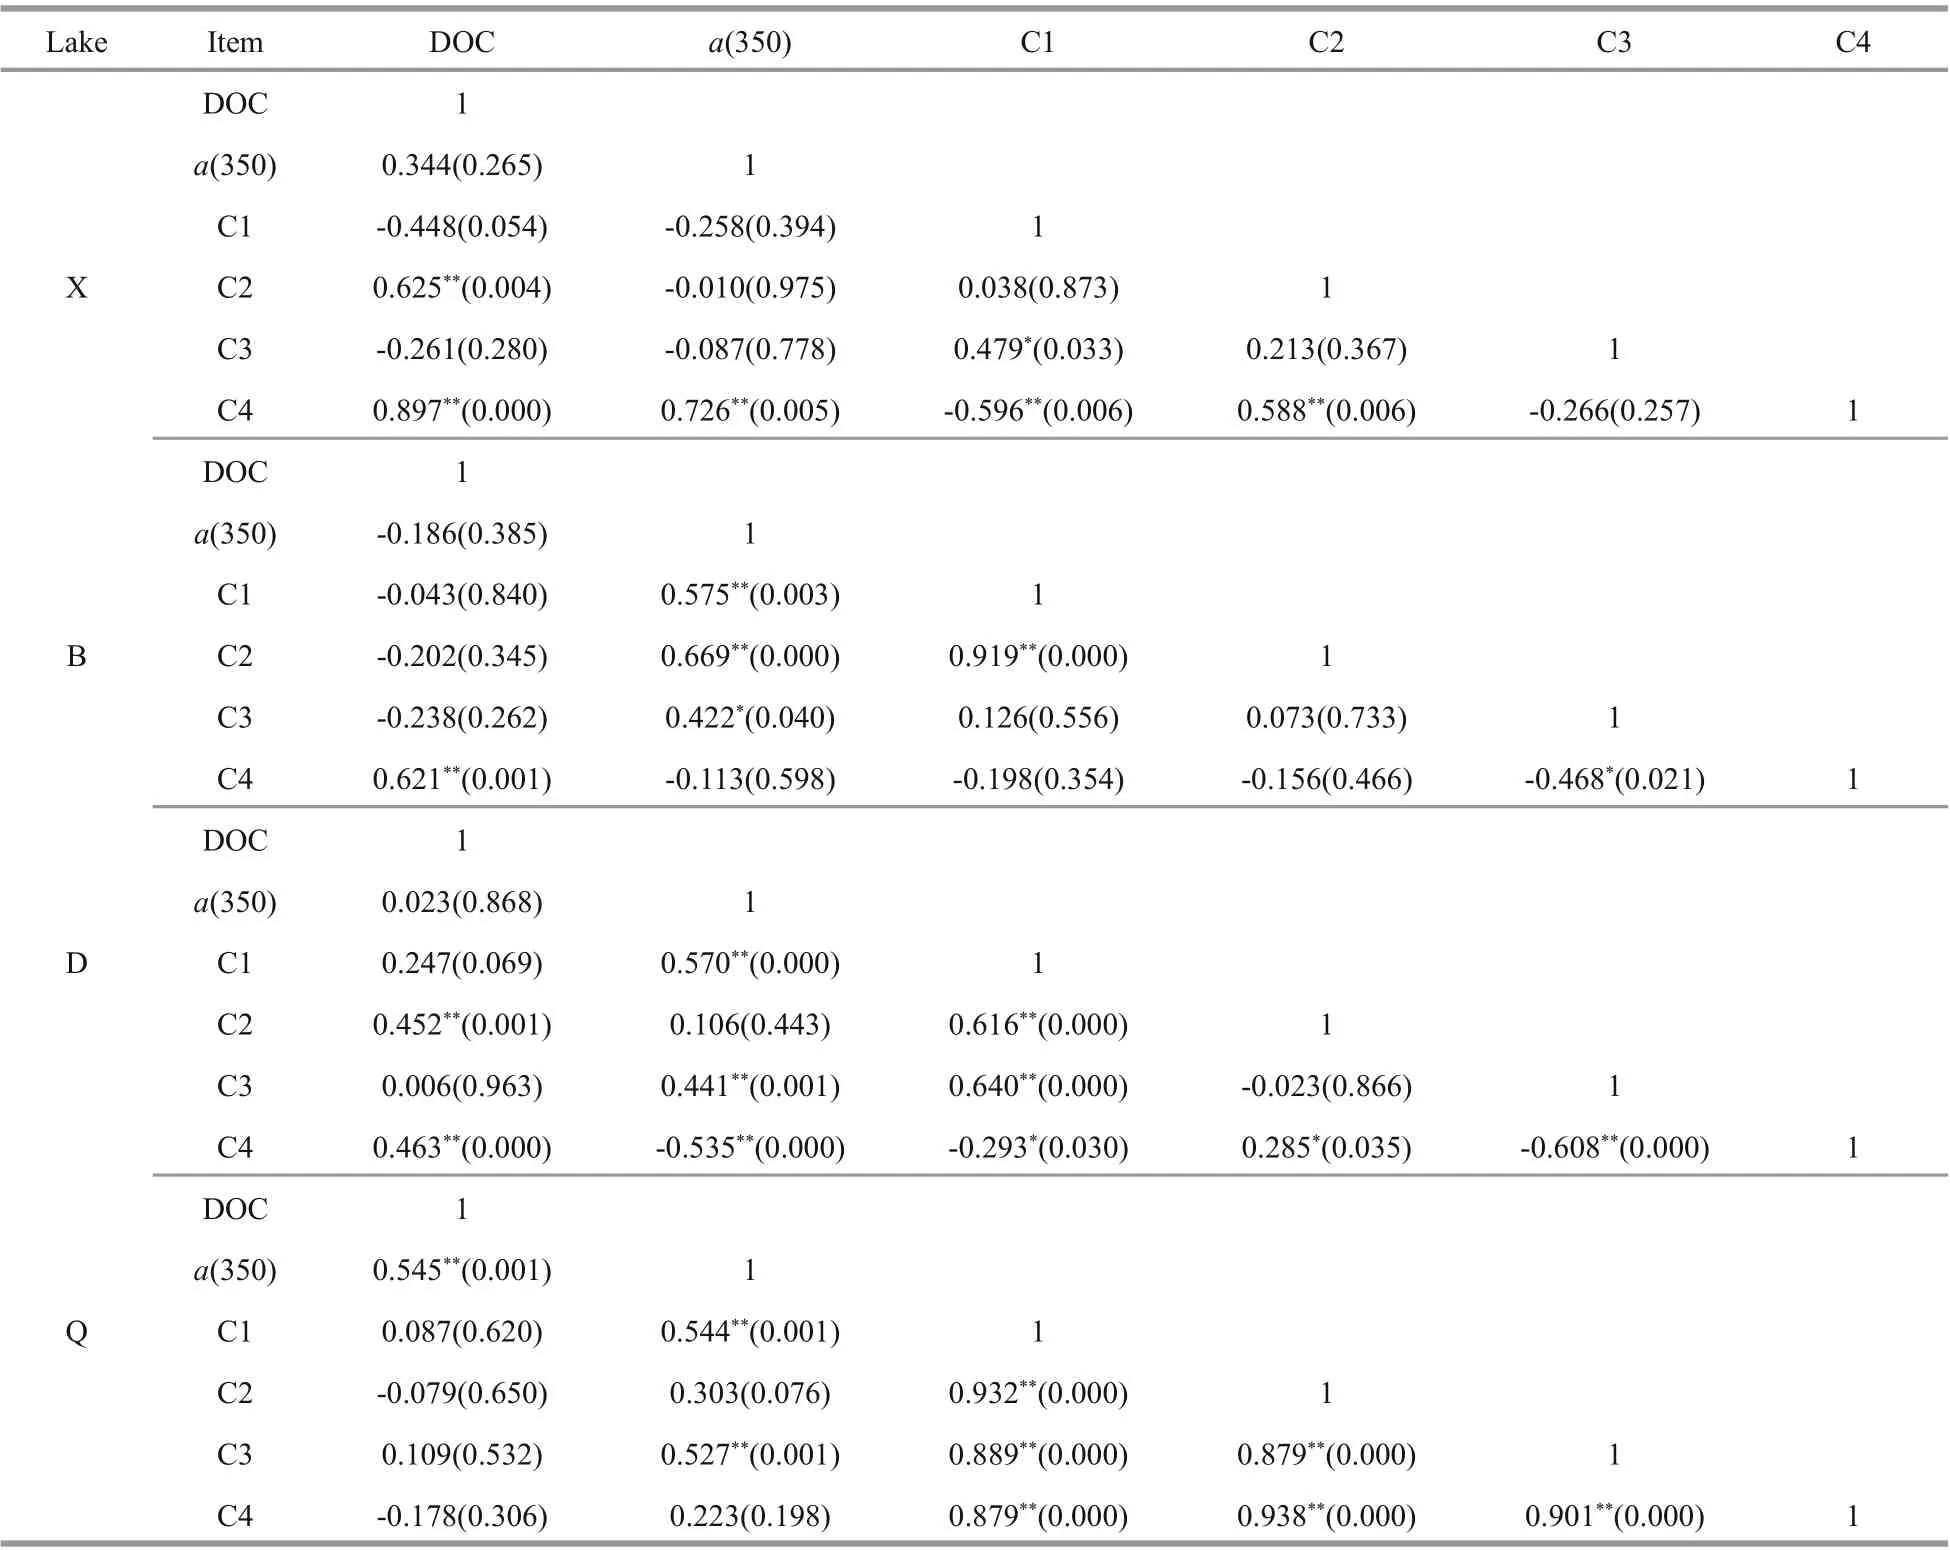
Table 4 Relationship between dissolved organic matter absorption coeffi cients and the fluorescence intensities of components from the PARAFAC model
C4 also represents protein-like substances, yet its correlation witha(350) was not significant (R=0.007,P=0.938). Additionally, although C4 diff ered substantially among the lakes in terms ofits contribution rate, the diff erences in fluorescence intensity among the lakes were not evident from a quantitative perspective (onlyFmax(C2)<Fmax(C4):P=0.028;Fmax(C3)<Fmax(C4):P=0.036; others,P>0.110). It seems that the formation of this component had relatively higher independence. In X,C4 was the major contributor to FDOM (P=0.005),and no positive correlations were observed with any other components. This result indicates that DOM in X was dominated by protein-like compounds.Previous studies have shown that protein-like compounds can be produced through biodegradation,especially by microorganisms (Zhang et al., 2013).However, there were almost no algal blooms in X and chl-aconcentrations were extremely low in the diff erent seasons (Table 1). Thus, the produce of C4 may be related to the massive submerged plants present at the bottom of the lake. Of the published studies of DOM characteristics in the Changjiang River basin, many have identified components that match C4 in the current study. Those studies were conducted widely throughout the middle and lower reaches of the Changjiang River basin, and included some lakes experiencing profound environmental impacts, such as Chaohu Lake and Taihu Lake (Li et al., 2016; Wang et al., 2016, 2018; Chen et al., 2018a;Liu et al., 2019a). This component is considered to have relatively high biosensitivity and it often occurs as a direct soluble product of microorganisms present in water (Xiao et al., 2018). Chen et al. (2018a) found that the consumption rate of this component was higher in lakes with longer water residence time. In a study conducted in the Changjiang River estuary, Li et al. (2016) also concluded that this component was characterized by relatively rapid biodegradation.Because of this characteristic, the hypothesis that C4 may exist in waterbodies in the Changjiang River basin for a long time cannot be established. This component is more likely to be produced via the metabolic activity of specific microorganisms ubiquitous in the Changjiang River basin. The distribution of these microorganisms is uniform and their contribution to C4 is stable, with no or limited eff ect resulting from cyanobacterial blooms.
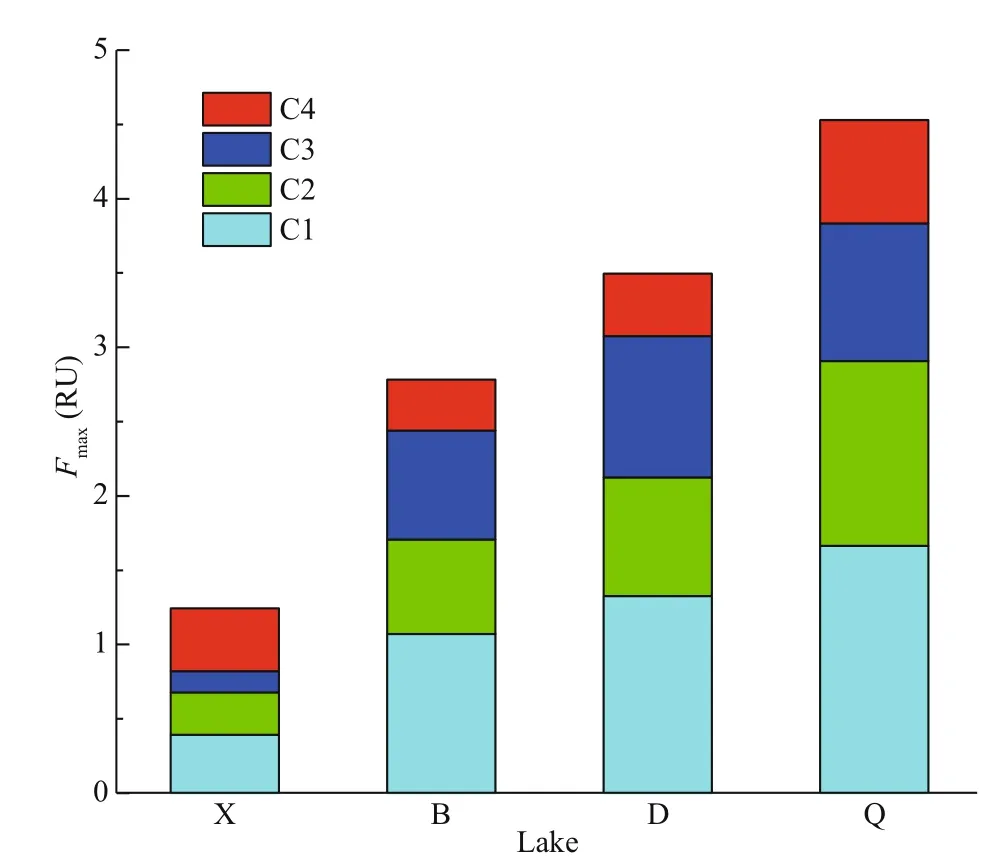
Fig.7 Average contributions to total dissolved organic matter fluorescence intensities of the PARAFACderived components in typical lakes in southeastern Hubei Province, China
Furthermore, In Q, significant correlations were found between components in each season (P<0.010),and the distribution of each component was more uniform than in other lakes (Fig.7). These results might be attributed to the fact that Q is relatively small and has a low reservoir capacity with poor fluidity of the water, but a large amount of sewage is discharged into this lake. This is reflected in the abnormally high-value areas in autumn of Q in the western and southeastern areas (Fig.6o); all of these areas are associated with dense sewage pipes.Frequent sewage inflow, precipitation process and long-hydraulic retention time accelerate sediment agitation, pore water release and floc degradation(Coble, 1996; Wang et al., 2013; Dong et al., 2014),leading to a complicated mixing process of FDOM in the water column . The protein-like components transformed significantly in this process (C3:P=0.002; C4:P=0.000), while humic-like ones maintained stable. This was in agreement with the findings of Jørgensen et al. (2011) and Li et al. (2015).
4.2 Diff erences in the biogeochemical characteristics of DOM in lakes in the southeastern Hubei
The biogeochemical characteristics of DOM in lakes have an important impact on their aquatic ecosystems. Through the analysis of a series ofindicators, the study of a series of characteristics including humification characteristics, self-production characteristics and photobleaching characteristics can help people understand the basin more systematically and provide theoretical reference for the ecological restoration of the region.
The fluorescence indices HIX and BIX indicate the degree of humification and autotrophic productivity of FDOM in water (Huguet et al., 2009; Yang et al.,2017). Zhang et al. (2010) divided HIX into four levels based on a study of a series oflakes in the Yungui Plateau region, China. These levels were:HIX<1.5 indicates a biogenic source; 1.5<HIX<3 indicates DOM with weak humification characteristics and an important recent autochthonous source;3<HIX<6 indicates DOM with relatively strong humification and weak recent autochthonous characteristics; HIX>6 indicates strong humification with a high terrestrial contribution. Comparing the seasonal HIX values in various lakes (Fig.4a), we found that in X an endogenous contribution from biodegradation was dominant in spring, summer, and winter, with some FDOM derived from humic substances in autumn. In general, the FDOM in B and Q was strongly influenced by humic substances. In B,the influence of humic substances was especially prominent in summer and autumn, whereas in Q,endogenous sources were more influential in spring.The FDOM in D was influenced by the input of terrestrial humic substances in most seasons.However, this process was not obvious in summer of D, and there were certain biological characteristicsrelated to the reproduction ofEichhorniacrassipes(Mart.) Solms,PotamogetoncrispusL., andCyanobacteriain the central area in summer. In contrast, FDOM in B was characterized by a higher humification degree and aromaticity, with a lower percentage of oxygen-containing functional groups and mineralization rates (Kalbitz et al., 2003).

Table 5 Relationship between water quality index of eutrophic and DOM and its fluorescence components
For BIX, values >1 indicate a major contribution of FDOM from newly produced endogenous sources whereas BIX<1 indicates FDOM in water with low biogenic organic matter and limited productivity(Para et al., 2010; Chen et al., 2016). In this study, we found that BIX values exhibited relatively uniform seasonal variations in the diff erent lakes. Among them, X had higher autotrophic productivity.
With increasingMandS275-295values, the relative molecular mass of DOM and the degree of humification may decrease (Peuravuori and Pihlaja,1997; Uyguner and Bekbolet, 2005; Li et al., 2016).Here, we found that the DOM absorption coeffi cienta(350) was negatively correlated with bothMandS275-295in the four lakes (P<0.002). The relative molecular mass and humification degree of DOM in the lakes were highest in autumn of B, summer of D and Q.
Since DOM and FDOM have diff erent responses to the light environment below water surface, the ratio of FDOM/DOM (Fmax/a(350)) is often used to represent the photobleaching degree of DOM which has been demonstrated to be influenced by numerous factors, such as hydraulic retention time, suspended solids, salinity and turbidity (Li et al., 2015; Stedmon and Nelson, 2015). In this study, there was a significant correlation between photobleaching of humic-like components and the changes of TN and chla. The photobleaching degree of humic-like components increased gradually with the increase of TN concentration (C1:P=0.016; C2:P=0.001) and the decrease of chl-aconcentration (C1:P=0.000; C2:P=0.009), and the photobleaching process between the two components was also very affi nity, which was consistent with the intimate source of this two components mentioned above. In contrast, the decrease of CODMn, TP, and chlafacilitated the photobleaching of C4 while had no negligible eff ects on C3. Although photobleaching is common among lakes, it only accounts for a small part as the fate of FDOM in these four lakes, likewise in the middle and lower reaches of the Changjiang River and the Changjiang River estuary reported by Guo et al.(2007) and Li et al. (2015).
4.3 Responses of DOM and its fluorescent components to eutrophication and seasonal variations in southeastern Hubei lakes
Generally, as the eutrophication level increased,there was an increasing trend in both the absorption coeffi cienta(350) and the FDOM fluorescence intensity (B<D:P=0.048; D<Q:P=0.041; others,P<0.008; Fig.7). This trend is in agreement with the results of current mainstream research (Zhang et al.,2010, 2019; Wang et al., 2018). Specifically, this trend was continued in humic-like components (C1 and C2;P=0.000 in both cases), but it was not significant in protein-like components (C3 and C4; only X<D:P=0.010; X<Q:P=0.003; others,P>0.100).Correspondingly, humic-like components had good correlations with various eutrophication indicators.Among them, the correlations and significance with CODMnand chla, which are good representatives of organic matter components in water, were relatively high; the correlations and significance with TN and TP, which indicate nitrogen and phosphorus pollution levels in water, were relatively weak. In contrast,protein-like components had no obvious correlations with these indicators, and only C3 had a weak significant correlation with the organic indicators,including CODMnand chla(Table 5). On the one hand, this result indicates that the humic-like components from terrestrial inputs and endogenous transformations are a major contributor to the eutrophication oflake water; of course, this process is also related to the input of pollutants. On the other hand, as mentioned above, among the protein-like components identified, C3 is aff ected mainly by the activity of microorganisms such as algae, while the distribution of C4 is rarely aff ected by cyanobacterial blooms. Their contribution to the eutrophication process is mainly manifested in the organic matter and productivity indicators such as CODMnand chla,with C3 being the dominant contributor (Table 5).
Previous studies have shown that C3 is closely linked to the change in phosphorus in water (Wang et al., 2016, 2018). However, in the current study, either C3 or all protein-like components had a weak relationship with nitrogen and phosphorus.Nonetheless, C3 had very high correlations with TN in spring (R=0.800,P=0.000) and TP (R=0.698,P=0.000), and these were much higher than the correlations with humic-like components; this phenomenon was not observed in any other seasons.It was clear that, in contrast to the temporal uniformity of the input of terrestrial pollutants, the metabolic activities of microalgae and large aquatic plants are more susceptible to the influence of objective factors including season and weather. In spring, the eff ect of biological activities on the waterbody is either absent or limited, while the input of nitrogen- or phosphoruscontaining pollutants controls the production of C3.In the other seasons, C3 is more closely related to chlaowing to factors such as cyanobacterial blooms in summer and autumn, and the decay and rotting of aquatic organisms in autumn and winter. Moreover,we found that the relationships between humic-like components and the indicators of organic matter and productivity were weak in spring and then gradually strengthened, reaching their highest levels in autumn(C1 vs. CODMn:R=0.879,P=0.000; C1 vs. chla:R=0.835,P=0.000; C2 vs. CODMn:R=0.807,P=0.000;C2 vs. chla:R=0.879,P=0.000); thereafter, the relationships were slightly weakened in winter. This trend was also true for changes in the fluorescence intensities of humic-like components, suggesting that spring is the start of the formation of C3 and its transformation into humic-like components. This transformation can reach its highest level in summer and autumn, and then gradually weaken in winter.
From the overall perspective of DOM, DOM had a significant linear correlations with CODMn(R=0.417,P=0.000), TP (R=0.280,P=0.000), and chla(R=0.497,P=0.000). There were evident responses to CODMnin each season, indicating a relatively uniform contribution of aerobically degraded organic matter to DOM. Other environmental parameters had a more obscure influence on this contribution, and the linear characteristics were significant. With an exception of winter, the seasonal correlation between DOM and chlawas high, especially in D (R=0.747,P=0.000)and Q (R=0.649,P=0.000) where cyanobacteria often bloomed. This exception could be related to the lack of algal blooms in the lakes in winter, because algal reproduction makes a direct contribution to DOM. a significant positive correlation between DOM absorption coeffi cient and TP concentration has been implicated by a previous study (Zhang et al., 2018),consistent with the results of the present study.However, the relationship betweena(350) and PO43ˉ was not significant (P=0.259), indicating an unstable contribution of phosphorus to DOM. Furthermore, It is worth noting that even though DOM lacked a significant linear relationship with TN overall, it showed a good response to TN in each season. These results indicate that the contribution of TN to DOM was influenced substantially by other environmental conditions.
5 CONCLUSION
This study investigated diff erences in spatiotemporal DOM characteristics in four typical lakes with diff erent eutrophication levels, X (oligotrophic),B (mesotrophic), D (lightly eutrophic), and Q(moderately eutrophic), in southeastern Hubei Province. Four diff erent fluorescent chromophores were identified, two of which were humic-like components (C1 and C2) and two that were proteinlike components (C3 and C4). C3 was mainly produced by the pollutant-degrading activity of microalgae, including cyanobacteria, and this component contributed substantially to C1 and C2 during its transformation. This series of occurrence and transformation processes commenced in spring,boosted in summer and autumn, and then gradually declined. C4 has been widely recognized in the Changjiang River basin and its occurrence was associated with the metabolic activity of specific microorganisms ubiquitous in this river basin. The distribution of these microorganisms and their contribution to C4 were uniform and stable, with no(or limited) eff ect presented by cyanobacterial blooms and seasonal variation. The mixing eff ect oflake water made the biological transformation of proteinlike components easier. Humic-like components were more susceptible to photodegradation, though the total amount was low. The study on them will be helpful to understand the DOM characteristics,microbial activities, and pollutant transformation laws in the Changjiang River basin.
The overall concentration of DOM and the fluorescence intensity of humic-like components gradually increased as the eutrophication levels of the lakes rose. However, among protein-like components,only C3 had changes along the eutrophication gradient, while the distribution of C4 was not related to the eutrophication level of the lakes. DOM had a strong relationship with phosphorus, but the contribution of phosphorus was unstable. In contrast,DOM was more closely related to CODMnand chla.FDOM in B showed a higher degree of humification and aromaticity, with a lower percentage of oxygencontaining functional groups and mineralization rates.
6 DATA AVAILABILITY STATEMENT
The datasets generated and/or analyzed during the current study are available from the corresponding author on request.
7 ACKNOWLEDGMENT
We thank Muhua FENG, Fan XUN, and Chuyu LUO for their assistance in sampling.
杂志排行
Journal of Oceanology and Limnology的其它文章
- Numerical study of the seasonal salinity budget of the upper ocean in the Bay of Bengal in 2014*
- Study on evaluation standard of uncertainty of design wave height calculation model*
- A fast, edge-preserving, distance-regularized model with bilateral filtering for oil spill segmentation of SAR images*
- A Gaussian process regression-based sea surface temperature interpolation algorithm*
- Climatology and seasonal variability of satellite-derived chlorophyll a around the Shandong Peninsula*
- Sources of sediment in tidal flats off Zhejiang coast, southeast China*
