Determination of Phenolic Acids and Their Distribution in Freeze-Ground Aerial Parts of Different Sweetpotato Varieties by Ultra-High Performance Liquid Chromatography
2021-07-08ZHAOShanZHONGLingliLIXiLEIXinyuZHENGXingguoGUOLinganLEIShaorongZHOUHongHUANGShiqunFENGJunyan
ZHAO Shan, ZHONG Lingli, LI Xi, LEI Xinyu, ZHENG Xingguo, GUO Ling’an, LEI Shaorong,ZHOU Hong, HUANG Shiqun, FENG Junyan*
(1.Analysis and Determination Center, Sichuan Academy of Agricultural Sciences, Chengdu 610066, China;2.Biotechnology and Nuclear Technology Research Institute, Sichuan Academy of Agricultural Sciences, Chengdu 610061, China)
Abstract: In this study, an ultra-high performance liquid chromatography (UPLC) method was established to analyze the distribution of phenolic acids in aerial parts of 13 sweetpotato varieties.The results showed that addition of 0.2% sodium hydrogen sulfite to the extraction solvent could improve the recovery and stability of caffeic acid (CA) and caffeoylquinic acids (CQAs).Among the tested pretreatment methods, freeze grinding resulted in the highest content of phenolic acids,followed by freeze drying, oven drying, sun drying and homogenization.The UPLC method was fast, stable and highly sensitive with spiked recoveries of 99.5%−103.1%, and precision (expressed as relative standard deviation, RSD) of 0.3%−1.2%.The limit of detection (LOD) and the limit of quantification (LOQ) were 3.6−21.4 and 12.1−71.3 ng/mL,respectively.The contents of total CA and CQAs including CA, 3-CQA, 4-CQA, 5-CQA, 3,4-diCQA, 3,5-diCQA, 4,5-diCQA and 3,4,5-triCQA in the leaves, petioles and stems of sweatpotato ranged from 18.0−44.8, 0.7−11.9, and 0.3−9.7 g/kg dry sample, respectively.The contents of phenolic acids in different sweetpotato varieties were obviously different from each other, with dicaffeoylquinic acids (diCQAs) being the most abundant phenolic acid in all varieties.Moreover, diCQAs were the most abundant in the leaves among the three parts.
Keywords: sweetpotato; caffeoylquinic acids; phenolic acids; freeze grinding; drying; ultra-high performance liquid chromatography
Sweetpotato (Ipomoea batatasLam.) is one of the most important food crops worldwide.Sweetpotato plant parts(leaves, petioles and stems) are rich in nutrients and thus have received increased attention in recent years.It is widely accepted that fresh leaves, petioles and stems of sweetpotato were delicious and nutrition vegetables.Because the leaves of sweetpotato contain functional components, such as dietary fiber, flavonoids, phenolic acids, carotenoids, and anthocyanins, which are important for human health[1-2], these years, it was processed into a variety of foods, beverages and functional foods.In addition, sweetpotato plant parts exhibit high yield, fast growth, reduced attacks by pests and diseases, and low pesticide use.Thus, it is considered an ideal “green food”[3].Asia, especially China, has the world’s largest sweetpotato cultivation area, production and consumer groups.
Phenolic acids are one of the most important functional components of sweetpotato plants, and mainly consist of caffeic acid (CA) as well as mono-, di-, and tri-O-caffeoylquinic acids (CQAs), which are ester compounds of CA with quinic acid[4-5].The health benefits of CQAs have recently drawn particular interest because of their antioxidative, anti-inflammatory, antimicrobial,hepatoprotective, cardioprotective, and neuroprotective effects, as well as their low-density lipoprotein oxidation activities[6-8].Common CQAs and their chemical structures are listed in Table 1[9-10].Different views on the nomenclature of chlorogenic acid have been proposed, with some referring to the acid as 5-CQA[11-14]and others naming it 3-CQA[5,15-16].In the present study, the name 3-CQA was found more suitable in accordance with Table 1.
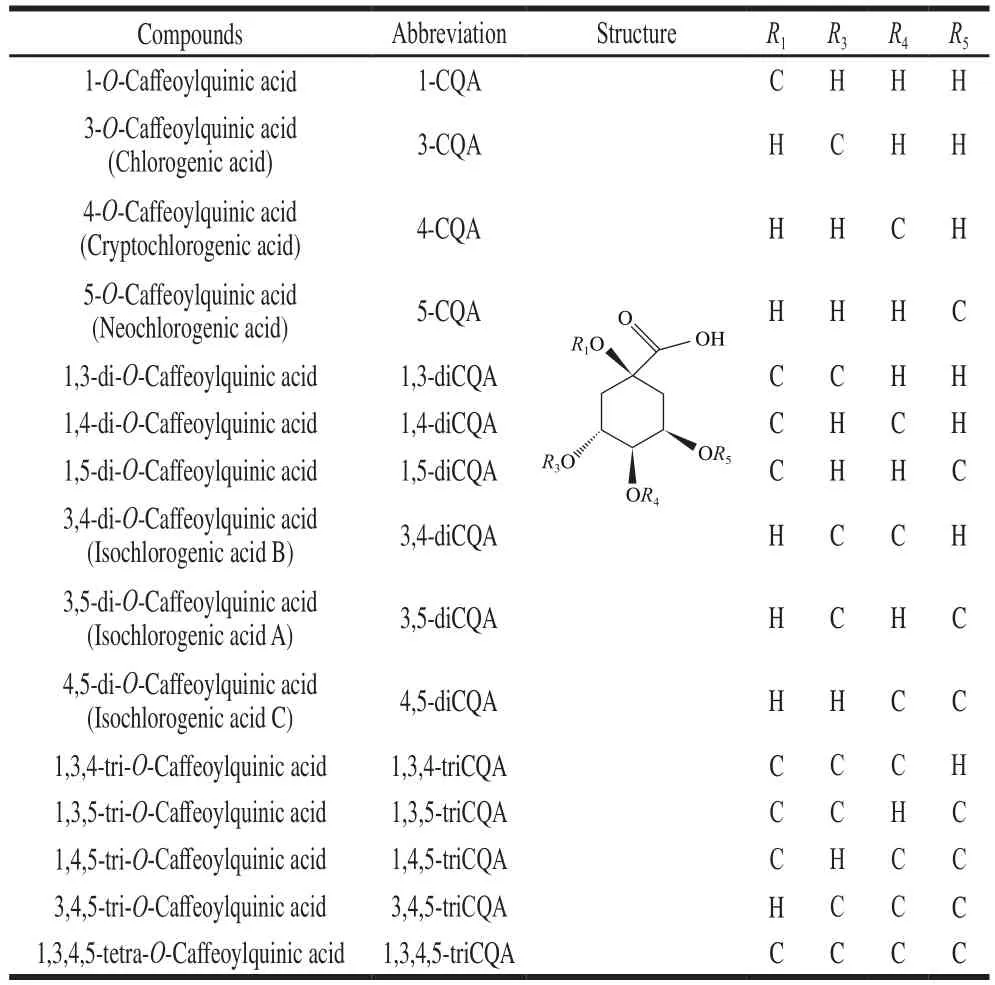
Table 1Chemical structures of CQAs
The phenolic components of sweetpotatoes are affected by variety, environment, and climate, etc.Studies have shown that the caffeoylquinic acid derivatives in sweetpotato leaf did vary according genotypes, the main phenolic compounds are CA, 3-O-caffeoylquinic acid (3-CQA), 4-O-caffeoylquinic acid (4-CQA), 5-O-caffeoylquinic acid (5-CQA), 3,4-di-O-caffeoylquinic acid (3,4-diCQA), 3,5-di-O-caffeoylquinic acid (3,5-diCQA), 4,5-di-O-caffeoylquinic acid (4,5-diCQA)and 3,4,5-tri-O-caffeoylquinic acid (3,4,5-triCQA)[4-5,11-12,15-20].Islam et al.[21]found that intensity of solar radiation and temperature affect the content of CA and CQAs in sweetpotato leaves, for example, partial shading decreased its content; Compared with 25 ℃, its content increased at 30 ℃.The contents of 4-CQA and 5-CQA in sweetpotato leaves affected by harvest batches and times[11].Drought and flooding caused a decrease in leaf phenolic acids[22].Most of the studies show that the leaves of sweetpotato plants contain the most content of phenolic acids[4-5,15], but the petiole and stem data are less and inconsistent.Islam et al.[5]believe that petioles were higher than stems, but June et al.[4]research results indicated that stems were higher than petioles.These might be caused by insufficient samples or different analytical methods, but in any case, the reasons for these differences needs to be explored.
Phenolic acids can be extracted from fresh, frozen of dried plant samples.Generally before extraction plantsamples are treated into fine particles by milling, grinding and homogenization, which may be preceded by airdrying or freezing-drying.During these processes, CQAs are degraded and converted differently.It was found that phenolic acids in apple pomace[23]andCitrus reticulataBlanco[24]would degrade obviously during the process of hot air drying.Therefore, improper sample pre-treatment can cause degradation of phenolic acids and lead to erroneous quantitative estimations of these compounds.
Generally, freeze drying maintains the highest content of phenolic acids compared to hot air drying.Lin Shengdun et al.[25]reported that the best drying method for preserving higher contents of CA derivatives and total phenols inEchinacea purpureais freeze drying, followed by cold air drying, and the lowest is hot air drying.Jeng et al.[15]found that high-temperature drying method significantly reduced CQAs in sweetpotato leaves.However, the drying process,including freeze-drying, can cause uncertain effects on the phenolic acids of plant samples.
Methods currently used to detect CA and CQAs mainly include ultraviolet spectrophotometry[5], high performance liquid chromatography (HPLC)[5,11], gas chromatography[26], capillary electrophoresis[27], and HPLC-tandem mass spectrometry[9,28-29].Ultra-high performance liquid chromatography (UPLC) has several advantages over the aforementioned methods, including high sensitivity, simple sample preparation, short analysis time, and less solvent consumption.Moreover, CQAs are susceptible to degradation by temperature,light, and so on during sample preparation or extraction.However,studies comparing methods of preparing sweetpotato leaves are rarely reported, and few effective ways has been identified to prevent CQA degradation during extraction.
For all these reasons, the main objectives of this study were: 1) To establish an UPLC method for the accurate and rapid determination of phenolic acids in sweetpotato; 2) to find out which pre-treatment method can more accurately reflect the content of CQAs in sweetpotato; 3) to determine and analyze the distribution of phenolic acids in different parts of 13 sweetpotato varieties.
1 Materials and Methods
1.1 Materials and reagents
1.1.1 Materials
Thirteen sweetpotato varieties were provided by the Institute of Biotechnology and Nuclear Technology, Sichuan Academy of Agricultural Sciences.The varieties were grown in experimental field in Chengdu (104.1°E, 30.6°N, Sichuan,China), planted in March 2018, transplanted to field in June,and picked in September.Details of material information are shown in Table 2.
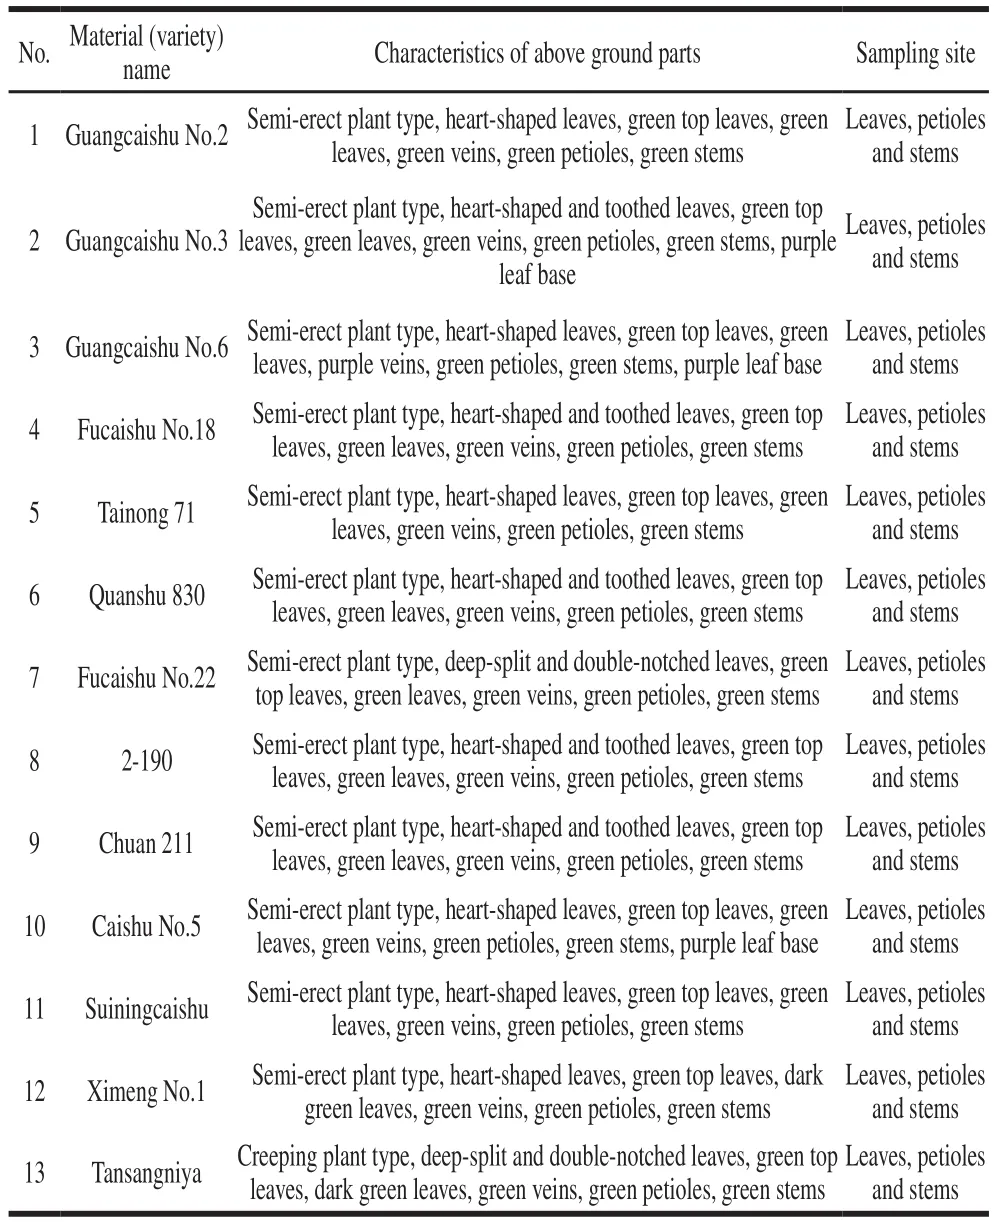
Table 2Information about sweetpotato materials tested in this study
1.1.2 Standards and reagents
The purchase of standard products is as follows: 3-CQA from Dr.Ehrenstorfer GmbH (Augsburg, Germany), CA from Sigma-Aldrich Fine Chemicals (St.Louis, MO, USA),4-CQA, 5-CQA, 3,4-diCQA, 3,5-diCQA and 4,5-diCQA from Wuhan ChemFaces Biochemical Co.Ltd.(Wuhan, China),1-CQA, 1,3-diCQA and 1,5-diCQA from Chengdu Biopurify Phytochemicals Ltd.(Chengdu, China), 3,4,5-triCQA from Biosynth (Staad, Switzerland).Formic acid, acetonitrile, and methanol of HPLC-purity were purchased from MERCK(Darmstadt, Germany) and used to prepare mobile phases.All other chemicals and reagents were of analytical grade or HPLC purity.Deionized water with a resistivity of 18.5 MΩ·cm at 25 ℃ was also used.
1.2 Methods
1.2.1 Standard solution preparation
An accurate amount of each standard was weighed and then dissolved in methanol to prepare a 1.0 mg/mL stock solution for each.The solution was stored in brownglass bottles at −20 ℃.Working standard solutions were freshly prepared by diluting appropriate amounts of the aforementioned solutions with 70% (V/V) methanol aqueous solution before injection.
1.2.2 Sample pre-treatment
Samples pre-treatment was divided into dry and fresh sample processing, of which drying treatment were divided into freeze drying, oven drying, and sun drying, fresh samples were divided into direct homogenization and liquid nitrogen freeze grinding.The definite means are as follows:1) Freeze drying.Samples were frozen at −80 ℃ overnight and then lyophilized for 48 h in a freeze-dryer (Martin Christ Gamma 2-16 LSC plus).2) Oven drying.Samples were put in a hot air oven at 50 ℃ for 8 h.3) Sun drying.Samples were conducted for 2 days in a greenhouse with a mid-day temperature reaching 35 ℃.4) Homogenate.Fresh samples were ground with a commercial food blender.5) Freeze grinding.Fresh samples were frozen and milled into powder with liquid nitrogen, and then weighed immediately in the frozen state.
All dried samples were powdered using a commercial grinder and then stored at −20 ℃.The homogenized sample and freeze-ground samples were subjected to extraction immediately.The moisture percentage of each sample was measured by oven drying at 105 ℃ for 4 h.
1.2.3 Extraction of CA and CQAs
100 mg of dry powder sample, or 1 g of homogenized sample and liquid nitrogen milled sample was weighed into a 20 mL centrifuge tube, and 10 mL of 70% (V/V) methanol aqueous solution (containing 2 mg/mL sodium hydrogen sulfite) was added.All tubes were vortexed, capped tightly,immersed in a water bath at 65 ℃, and performed sonication for 30 min at an oscillating frequency of 40 kHz.The mixture was cooled to room temperature, Centrifuged and transferred the supernatant to a 25 mL brown volumetric flask, repeated once, and made the final volume.The extract was filtered through a 0.22 μm nylon membrane, placed in a brown sample vial, and stored at 4 ℃ before UPLC.
1.2.4 Determination of CA and CQAs by UPLC
Chromatography was conducted on an Agilent 1290 system equipped with a binary pump (G7120A), an autosampler and column heating compartment (G7129B),and a diode array detector (DAD) (G7117A) (Agilent Technologies Inc., USA).UPLC separation was conducted on an ACQUITY UPLC HSS T3 column (2.1 mm ×100 mm, 1.8 µm; Waters, USA).The column compartment was set at 30 ℃ for chromatographic separation.An autosampler injection volume of 2 µL was used.The binary mobile phase was composed of water containing 0.1%(V/V) formic acid (A) and acetonitrile containing 0.1%(V/V) formic acid (B).The gradient elution was as follows:10%−15% B from 0 to 2 min, 15%−20% B from 2 min to 4 min, 20%−22% B from 4 min to 4.5 min, 22%−35% B from 6 min to 7.2 min, 35%−60% B from 7.2 min to 8.5 min,60% B from 8.5 min to 8.8 min, 60%−10% B from 8.8 min to 9.0 min, post-run for 2.5 min at a flow rate of 0.3 mL/min.The wavelength was set at 326 nm for monitoring CA and CQAs.
1.2.5 UPLC-DAD validation
The analytes were quantified by external calibration.CA and CQAs were calculated from peak areas with reference to those of reagent standards.A calibration curve was generated for each standard, with the peak areay(mAU min) plotted against the concentrationx(μg/mL).The limit of detection(LOD) was de ned as the lowest concentration that could be statistically different from that of an analytical blank,which was expressed in a signal-to-noise ratio of 3 (RSN= 3).The limit of quantification (LOQ) was de ned as the level above which the quantitative result could be obtained with a speci ed degree of con dence, expressed inRSN= 10.
The precision of the UPLC-DAD retention time and peak area measurements were calculated as the relative standard deviations (RSDs) of six repeated runs.Sample stability was monitored by analyzing the same sample solutions for 48 h at intervals of 8 h.Accuracy was evaluated by spiking recoveries for the sample preparation method.Spiked recovery was determined by adding specific amounts of standards to the sample, followed by extraction, as earlier described.
1.3 Data analysis
A completely randomized design with three replications for each cultivar was used.Statistical data were analyzed using the commercial DPS 15.1 software[30].Statistical differences between groups were evaluated by ANOVA,followed by the LSD’s test.
2 Results and Analysis
2.1 Optimization of sample extraction
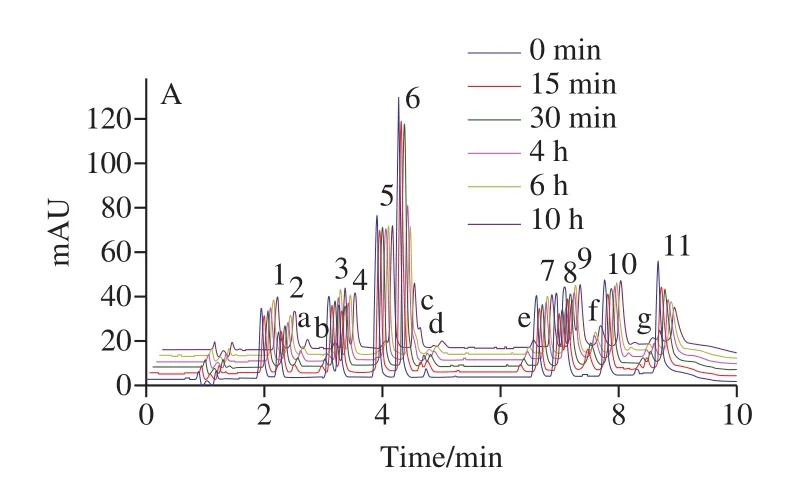
According to combined literature and previous experiments[16], 70% aqueous methanol solution positively affected the extraction of phenolic acid.Because CQAs and CA were unstable and easy to degrade, we did light test to investigate its stability and degradation.11 phenolic acids mixed standard solutions with a concentration of 10 μg/mL were filled into transparent bottles and brown bottles,respectively, and placed in the sun for 0−10 hours.UPLC results demonstrated that the peak areas of the 11 phenolic acids in transparent bottles were significantly reduced,especially for 1,3-diCQA and 3,4,5-triCQA, and a variety of new substances appeared, correspondingly, the degradation of phenolic acid in brown bottles was not significant, as showed in Fig.1.Previous research results[31]showed that the stability of CQAs was mainly affected by temperature and light irradiation.30 degradation products were found from the thermal and light degradation products of 3-CQA, 4-CQA,5-CQA, 1,3-diCQA, 3,4-diCQA, 3,5-diCQA and 4,5-diCQA,their main degradation pathways were isomerization,methylation and hydrolysis.Meanwhile, mono-CQAs were much more stable than di-CQAs.Therefore, the extraction process of CA and CQAs should be protected from light as much as possible.But it is difficult to avoid lighting completely during the whole process, so adding antioxidants should be one of the best choice to improve the stability of CA and CQAs.Ascorbic acid (VC), butylated hydroxyanisole(BHA), and sodium hydrogen sulfite (NaHSO3) was added into the extracting solution and the spiked recovery rates were measured to compare their effects on phenolic acid extraction.The results were presented in Fig.2.In 70% methanol extract without antioxidants, the recovery rates of 11 phenolic acids were 89.9%−100.5%, RSD were 1.6%−8.0%.Under the same conditions, those of 1% VC methanol solution were 87.0%−109.4%, RSD were 2.1%−5.7%; those of 0.2%NaHSO3methanol solution were 99.5%−103.1%, RSD were 0.3%−1.2%; those of 0.2% BHA methanol solution were 83.0%−99.1%, RSD were 1.5%−2.7%.Previous studies found that 5-CQA possessed higher antioxidant properties than commonly applied antioxidants (BHA, BHT,andL-ascorbic acid)[32], so they may have little sense as antioxidants for CQAs.Sodium hydrogen sulfite is widely used as antibrowning agents in food processing[33-34], and the addition of sodium hydrogen sulfite reportedly inhibited the loss of carotenoids in fresh daylily flowers and mango during hot air drying or extraction[35-36].The results of the present study demonstrated that 70% aqueous methanol solution containing 0.2% sodium hydrogen sulfite had the best recovery and stability of caffeylquinic acid.This finding could be attributed to the presence of NaHSO3, which could potentially prevent the degradation of phenolic acids during extraction.Accordingly, adding 0.2% sodium hydrogen sulfite during the extraction, which was helpful to improve the stability of phenolic acids.
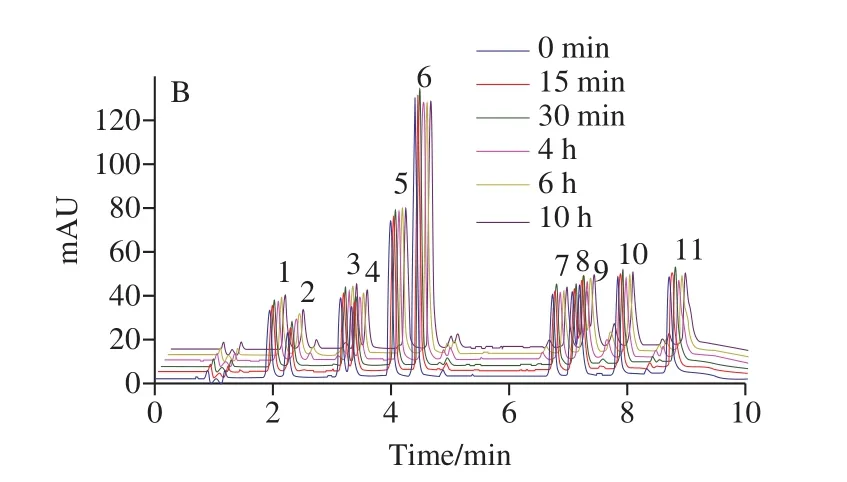
Fig.1 Chromatogram of degraded products of CA and CQAs in sunlight
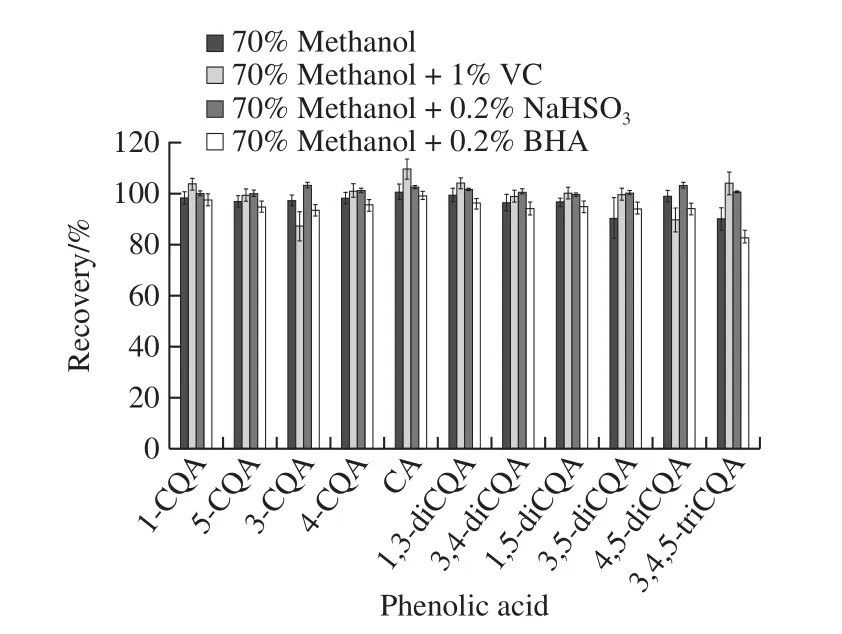
Fig.2 Effects of different antioxidants on the recoveries of CA and CQAs
2.2 Optimization of UPLC conditions
To achieve the best chromatographic separation, the column, the mobile phase and its conditions for elution, and the detection wavelength were investigated in this study.
An ACQUITY UPLC HSS T3 column (Waters)(2.1 mm × 100 mm, 1.8 μm) and an ACQUITY UPLC BEH C18column (2.1 mm × 100 mm, 1.7 μm) were optimized.Both columns exhibited excellent separation of phenolic acids under different mobile phases and elution conditions.The ACQUITY UPLC HSS T3 column exerted a good separation effect on the mobile phase containing 0.1% formic acid aqueous solution (A)-0.1% formic acid acetonitrile solution (B).Its gradient elution conditions were the same as those found under the materials and methods section of this paper.Better separation was achieved using the ACQUITYUPLC BEH C18column in a mobile phase containing a 0.1%aqueous formic acid (A)-acetonitrile (B) solution; its gradient elution program was as follows: 0−2 min, 92%−87% A,8%−13% B; 2−4 min, 87%−82% A, 13%−18% B; 4−6 min,82%−77% A, 18%−23% B; 6−7 min, 77% A, 23% B;7−9 min, 77%−50% A, 23%−50% B; 9−10 min, 50% A, 50% B;10−10.5 min, 50%-92% A, 50%−8% B.The ACQUITY UPLC HSS T3 column was used in this study, and the chromatograms of the standards and samples are presented in Fig.3.
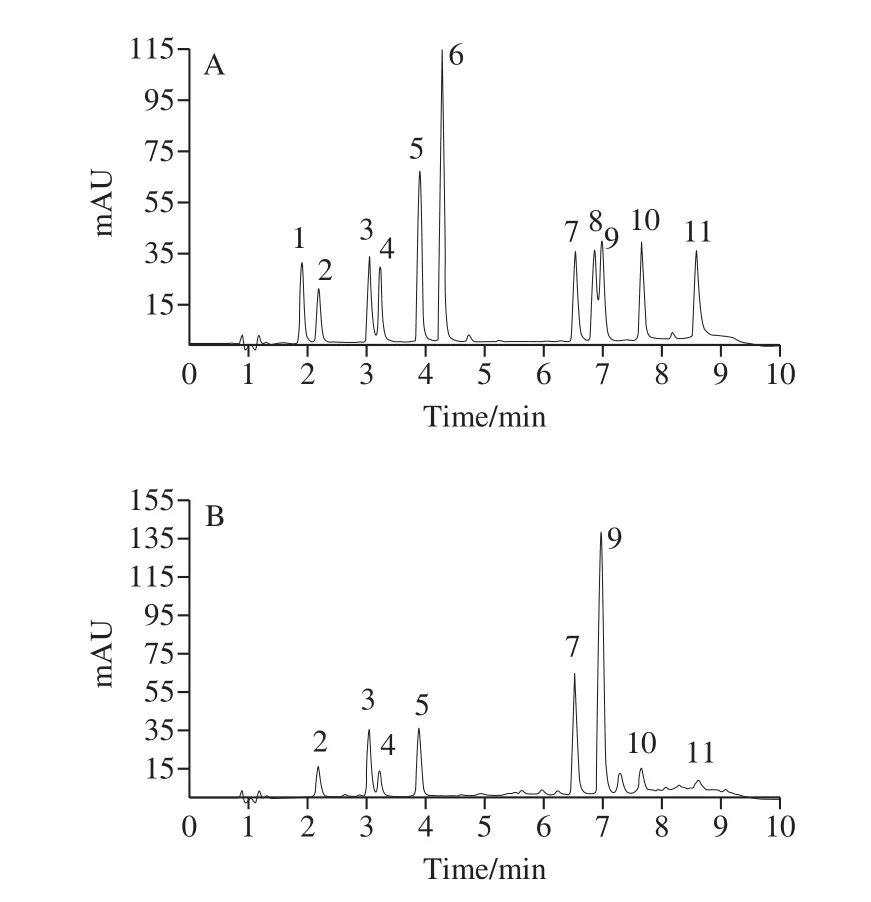
Fig.3 Chromatograms of CA and CQAs in a mixed standard solution (A) and in sweetpotato leaves (B)
A standard solution of eight phenolic acids was scanned by DAD in the wavelength range of 190−400 nm to obtain a three-dimensional spectrum of the time, wavelength, and ultraviolet absorption intensity of the eight compounds.The results of the spectrum showed that the maximum absorption wavelengths of 1-CQA, 5-CQA, 3-CQA, 4-CQA,CA, 1,3-diCQA, 3,4-diCQA, 1,5-diCQA, 3,5-diCQA,4,5-diCQA, and 3,4,5-triCQA were 328, 326, 326, 326,324, 322, 326, 329, 328, 328, and 330 nm, respectively.The 326 nm wavelength was selected as the detection wavelength in this study.
2.3 UPLC method validation of quantitative analysis
2.3.1 Linearity and detection limit
Table 3 showed that the method completed the separation of 11 phenolic acids in less than 9 min, and the correlation of 11 phenolic acids verified the linearity of the calibration curve, the correlation coefficient was higher than 0.999 48 in the test range.The LOD and LOQ ranges for the eleven phenolic acids were 3.6−21.4 ng/mL and 12.1−71.3 ng/mL, respectively.
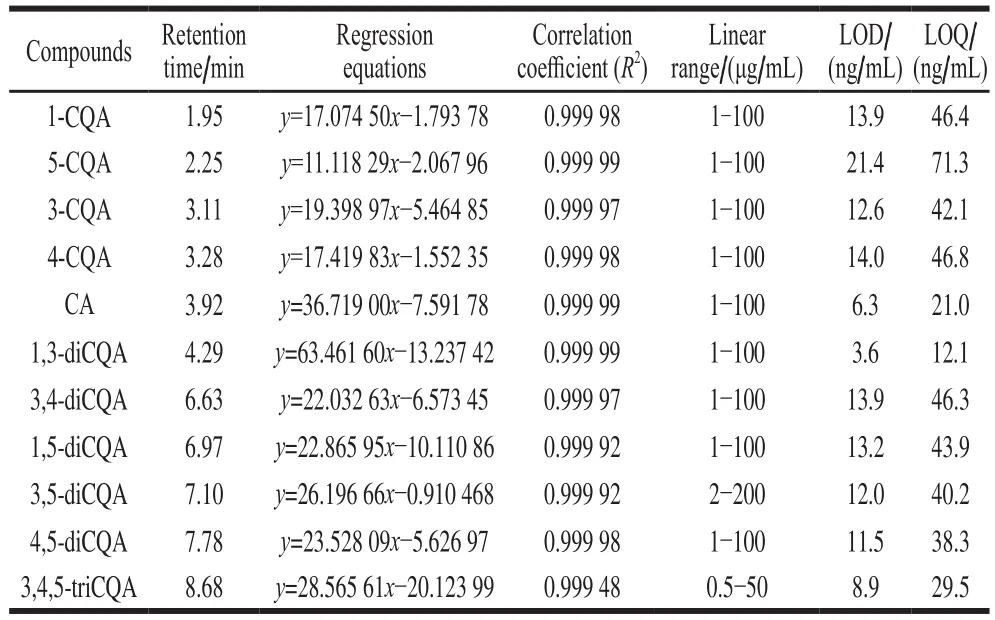
Table 3Regression equations, correlation coefficients, linear ranges,limits of detection, and limits of quantification of 11 phenolic acids
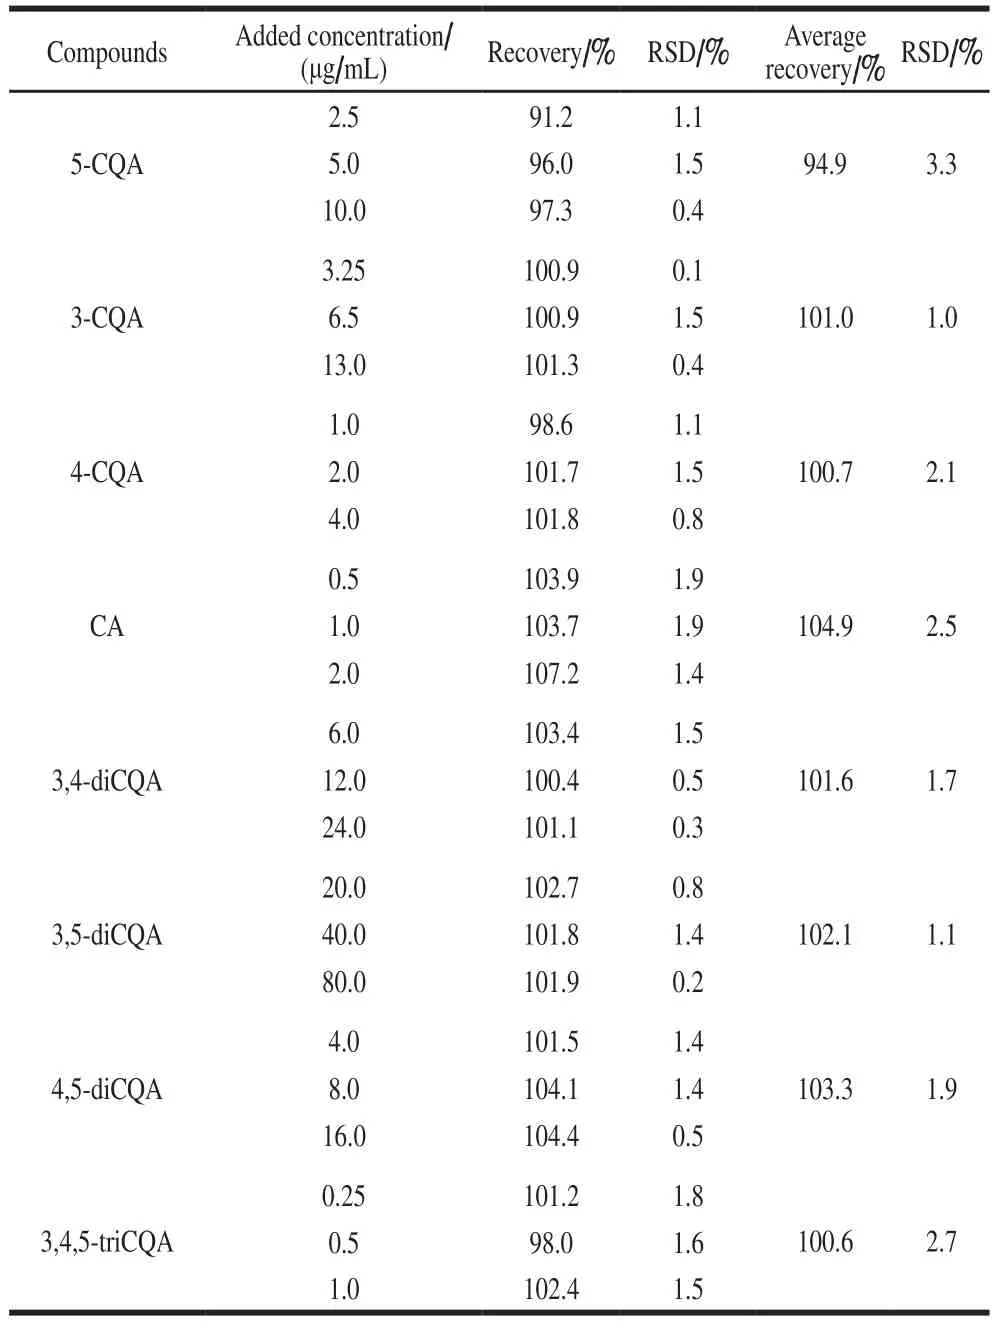
Table 4Recoveries and precision of 8 selected phenolic acids in spiked sweetpotato leaves
2.3.2 Precision, stability, and recovery
Only eight phenolic acids, 5-CQA, 3-CQA, 4-CQA,CA, 3,4-diCQA, 3,5-diCQA, 4,5-diCQA, and 3,4,5-triCQA,were detected in this study.The RSD of the retention time of eight phenolic acids was less than 0.07%, and the peak area RSD was 0.2%–1.4%.The storage stability (RSD) of the measurements for eight phenolic acids was 0.5%–2.0%.We added different concentrations of standard substances according to the sample concentration to perform the spikerecovery test.The results demonstrated that the average recoveries of the eight phenolic acids ranged from 94.9%to 104.9%, and their RSD ranged from 1.0% to 3.3%(Table 4).These results showed that UPLC-DAD was precise,accurate, and sufficiently sensitive for the simultaneous quantitative determination of the eight phenolic acids in sweetpotato leaves.
2.4 Effects of different sample preparation methods
Phenolic acids in Tainong 71 leaf samples prepared by freeze drying, freeze grinding, oven drying, sun drying,and direct homogenization were determined using the same protocol in accordance with the aforementioned method.Measurement results were calculated on a dry weight.The total amounts obtained for the eight phenolic acids prepared by different sample preparation methods were 33.48, 44.48,16.05, 13.67 and 2.20 g/kg, respectively.The contents of 5-CQA, 3-CQA, 4-CQA, CA, 3,5-diCQA, 3,4-diCQA,4,5-diCQA, and 3,4,5-triCQA obtained using the five sample preparation methods were in the following ranges,respectively: 0.26−3.06, 0.37−4.29, 0.14−1.67, 0.07−1.81,0.37−13.95, 0.80−18.73, 0.17−2.02, and 0.01−1.25 g/kg(Fig.4).The results showed that 3-CQA, 3,4-diCQA,3,5-diCQA, 4,5-diCQA, and 3,4,5-triCQA obtained the highest content under freeze grinding; 5-CQA, 4-CQA and CA exhibited the highest contents under freeze drying; and eight phenolic acids obtained lower content when the samples were subjected to direct homogenization than other methods.ANOVA indicated that the sample preparation methods affected the contents of the eight phenolic acids (Fig.4).The content of 3-CQA, 3,4-diCQA, 3,5-diCQA, 4,5-diCQA,and 3,4,5-triCQA by freeze grinding was significantly(P< 0.05) higher than that of other methods.Similarly, freeze drying significantly (P< 0.05) higher than other methods at 4-CQA and CA.A significant difference in CQAs and CA was observed between homogenization and other methods(P< 0.05).In the drying methods, except for 4,5-diCQA,freeze-dried phenolic acid content was significantly higher than oven-dried and sun-dried, but there is no significant difference between oven-dried and sun-dried (P< 0.05).Comparison of the effects of different sample preparation methods indicated that the highest phenolic acid content in sweetpotato leaves was generally obtained by freeze grinding,followed by freeze drying, oven drying, sun drying and homogenization.Accordingly, freeze grinding was selected to conduct this study.
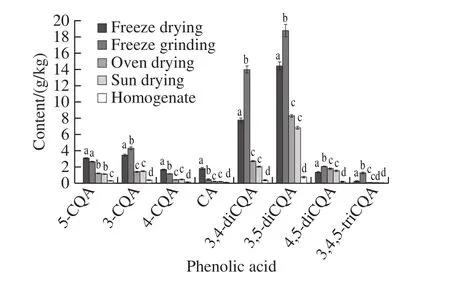
Fig.4 Contents of CA and CQAs in sweetpotato leaves determined using different sample pretreatment methods
Studies have shown that phenolic acids in sweetpotato are determined based on lyophilized[5,11], dried[16], fresh thick slices[4], or homogenized samples[12,18].From the results,phenolic acids would be more easily degraded in fresh leaves subjected to direct homogenization.Compared to oven drying and sun drying, freeze drying was the best way to preserve and utilize the phenolic acids in sweetpotato leaves.However,the results of freeze-dried samples were still significantly lower than those of directly liquid nitrogen milled samples,which indicated that during the drying process including freeze drying, the CA and CQAs would undergo different degradation or conversion, therefore, the results confirmed that freeze-milled samples could more truly represent the content of CA and CQAs in sweetpotato leaves.
2.5 Quantitative analyses of phenolic acids in different part of sweetpotato plant
Phenolic acids in sweetpotato leaves were separated rapidly using the proposed UPLC-DAD method (Fig.3).The distribution of individual CQAs in the different parts of the sweetpotato is shown in Table 5.The data indicated that the sweetpotato plants were rich in caffeoquinic acids,and their compositions were 5-CQA, 3-CQA, 4-CQA, CA,3,4-diCQA, 3,5-diCQA, 4,5-diCQA, and 3,4,-5CQA, which was consistent with the results of the study by Islam[5],Sasaki[11]and Xi Lisha[19]et al..Eight phenolic acids were detected in sweetpotato leaves, but some of them were not detected in petioles and stems.Wide variation was observed in relation to individual phenolic acids.The CQA contents of leaves were as follows: 18.0−44.8 g/kg(total), 0.64−3.69 g/kg (5-CQA), 2.75−11.51 g/kg(3-CQA), 0.46−2.10 g/kg (4-CQA), 0.08−2.42 g/kg(CA), 4.18−13.95 g/kg (3,4-diCQA), 8.33−18.73 g/kg(3,5-diCQA), 0.64−2.45 g/kg (4,5-diCQA), and 0.41−1.40 g/kg(3,4,5-triCQA).The CQA contents of petioles were as follows: 0.7−11.9 g/kg (total), 0−0.61 g/kg (5-CQA), 0.20−3.01 g/kg (3-CQA), 0−0.54 g/kg (4-CQA), 0.15−3.10 g/kg(3,4-diCQA), 0.28−3.73 g/kg (3,5-diCQA), 0−0.59 g/kg(4,5-diCQA), and 0−0.29 g/kg (3,4,5-triCQA).The CQA contents of stems were as follows: 0.3−9.7 g/kg (total),0−0.33 g/kg (5-CQA), 0.10−3.01 g/kg (3-CQA), 0−0.42 g/kg(4-CQA), 0−0.06 g/kg (CA), 0−1.92 g/kg (3,4-diCQA),0.17−5.17 g/kg (3,5-diCQA), 0−0.47 g/kg (4,5-diCQA), and 0−0.17 g/kg (3,4,5-triCQA).We made multiple comparisons of the results of CA and CQAs from 13 varieties, and the results showed that the total phenolic acids content in leaves of different varieties was significantly different (P< 0.05).In addition, the leaves contain the largest amount of total CQAs, with an amount significantly (P< 0.05) greater than petioles and stem.The CQAs content of the petiole was not significantly different from that in stem (P> 0.05).The total content range of the eight phenolic acids in sweetpotatosamples was 24.4–65.4 g/kg.Ximeng No.1 possessed the highest total phenolic acids content, whereas Fucaishu No.18 showed the lowest content.
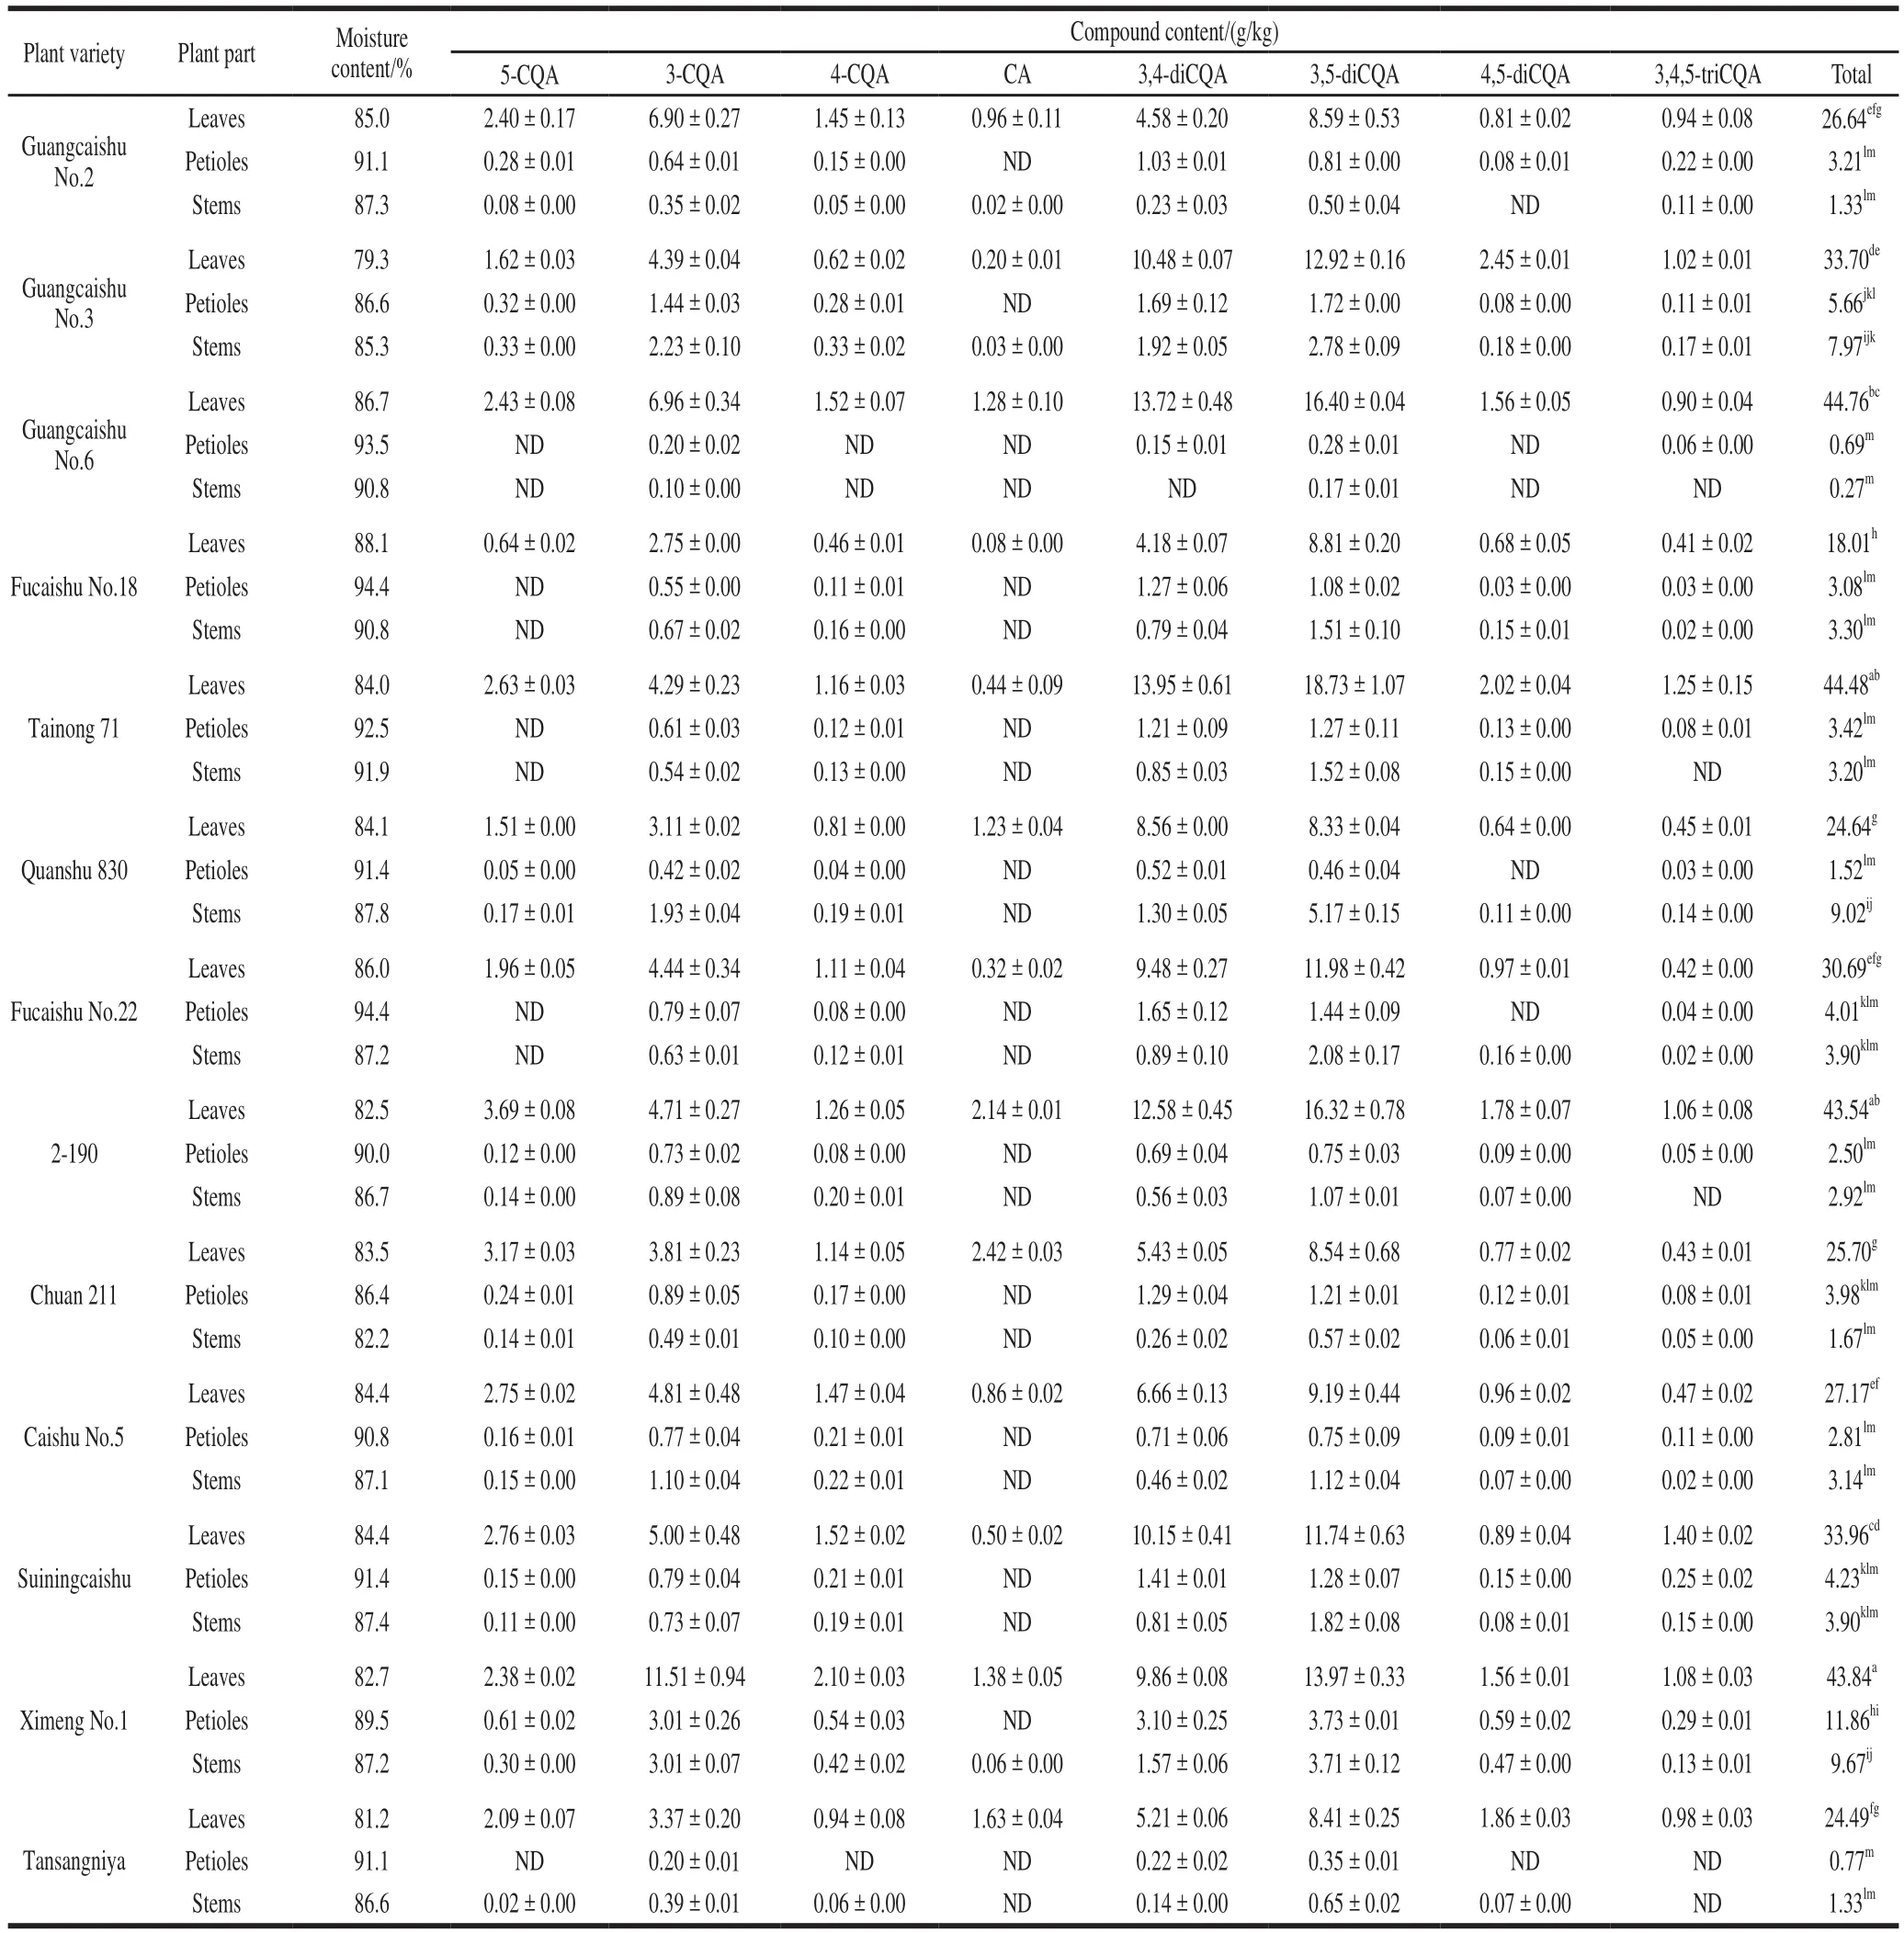
Table 5Distribution of phenolic acids in aerial parts of different sweetpotato varieties
It was found that 3-CQA, 3,4-diCQA and 3,5-diCQA were the most abundant components in leaves, petioles or stems of sweetpotato plants.Comparing composition percentages of three CQAs groups, the results were diCQAs(52.5%–80.2%) > monoCQAs (18.2%–46.6%) > triCQAs(0%–8.3%) (Fig.5).Studies have shown that monoCQAs were converted to diCQAs in an enzyme-catalyzed reaction[37-38], so this may be the reason for the distribution pattern of CQAs in sweet potatoes.Xu Jianguo et al.[39]found that diCQAs possessed better antioxidant activities than monoCQAs, and their antioxidant activities were probably influenced by the position of esterification on the quinic moiety.Therefore, due to the different composition and content of CQAs, the antioxidant activity of different varieties would also be different.
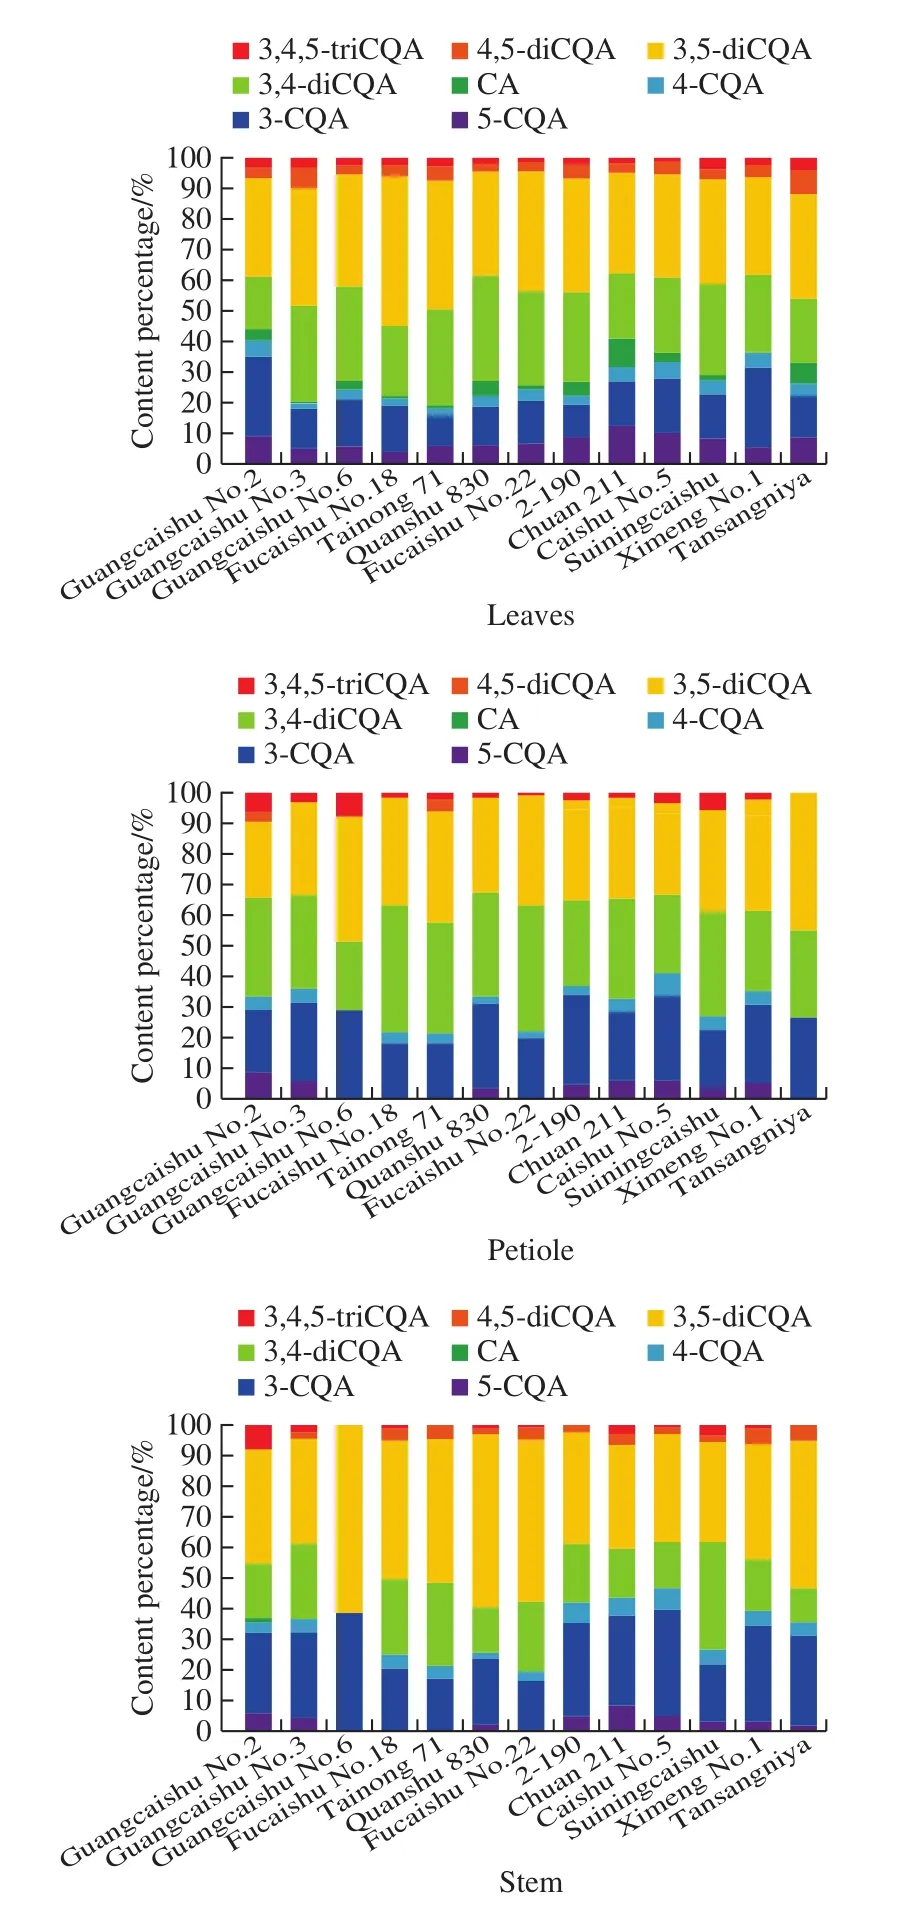
Fig.5 Percentage of CA and CQAs in aerial parts of different sweetpotato varieties
3 Conclusions
An optimized UPLC-DAD method was established to determine the eleven phenolic acids in sweetpotato leaves,and it was more rapid, accurate, and high sensitivity.The extraction study demonstrated that antioxidants could improve the stability of CQAs.Sodium hydrogen sulfite had better recovery and stability than the control, ascorbic acid, and BHA.The effects of sample pre-treatment methods for phenolic acids were investigated, the highest content of phenolic acids in sweetpotato leaves were obtained by freeze grinding, followed by freeze drying, oven drying, sun drying,and homogenization.In order to more realistically determine the content of phenolic acids in sweetpotato plant parts,freeze grinding is a better choice.
Freeze-ground leaves, petioles, and stems and 70%aqueous methanol solution with 0.2% sodium hydrogen sulfite were used to determine the phenolic acids of 13 sweetpotato cultivars.The results indicated that the phenolic acids contents in the plant parts of 13 genotypes contain CA, 3-CQA, 4-CQA, 5-CQA, 3,4-diCQA, 3,5-diCQA,4,5-diCQA, and 3,4,5-triCQA, and diCQAs > monoCQAs >triCQAs.From CA and CQAs content in different parts,the leaves were significantly higher than the petioles and stems, but there was no significant difference between the petioles and stems.Our findings show substantial variation found among sweetpotato plant parts and suggest that consumers or commercial investors have a choice in selecting sweetpotato varieties with a high content of phenolic compounds.In addition, processing and preservation methods are also critical, as these directly affect the changes on phenolic acids in sweetpotato plants.
