An approach to gas sensors based on tunable diode laser incomplete saturated absorption spectra∗
2021-06-26WeiNie聂伟ZhenYuXu许振宇RuiFengKan阚瑞峰MeiRongDong董美蓉andJiDongLu陆继东
Wei Nie(聂伟) Zhen-Yu Xu(许振宇) Rui-Feng Kan(阚瑞峰) Mei-Rong Dong(董美蓉) and Ji-Dong Lu(陆继东)
1School of Electric Power,South China University of Technology,Guangzhou 510640,China
2Key Laboratory of Environmental Optics and Technology,Anhui Institute of Optics and Fine Mechanics,Chinese Academy of Sciences,Anhui 230031,China
Keywords: absorption saturation,spectral profile reconstruction,TDLAS,pressure,self-broadened half-width coefficient
1. Introduction
Laser absorption spectroscopy has been widely used in gas sensing. In particular, tunable diode laser absorption spectroscopy (TDLAS) is well-established for the measurement of the concentration,temperature and velocity of gaseous media.[1–4]The application of TDLAS technology in gas sensing often encounters high gas concentrations, large transition intensities or long absorption paths. All these factors are usually associated with saturated absorption,where the transmitted laser intensity at a certain frequency is small or even zero,and its spectral characteristics are incomplete (some or all of the spectral core is missing). For example, in the burning of biomass(wood and wheat straw),the range concentrations of atomic potassium released exceed 3 orders of magnitude; the absorption line with a wavelength near 769.9 nm reaches saturated absorption when highconcentration gaseous potassium is measured,and its absorption peak lacks all or part of the spectral core.[5–7]The saturation of absorption makes spectroscopy applications more difficult,and even hinders spectroscopy applications.
The existing spectral analysis methods cannot directly process incomplete spectral profiles, because these analysis methods all need to use a complete spectrum profile and a complete spectral model for least-squares fitting.[8–11]Zhouet al.have established an absorption line selection criterion,which stipulates that the peak absorption must be less than about 0.8 to avoid the experimental difficulties associated with saturated absorption.[12]According to this criterion, many methods have been proposed to expand the dynamic range of TDLAS gas sensing, such as the selection of multiple lasers(or multiple absorption lines with different line strengths)for segmented measurement,[13]which will undoubtedly increase the cost and complexity of the measurement equipment. In addition,the wavelength modulation spectrum method can expand the range of gas concentration sensing, but it has little effect on the suppression of absorbance saturation and is not suitable for saturated absorbance conditions.[14,15]
For high absorbance conditions, Penget al.established a second-order Taylor series approximation laser transmission model and a high-precision second-order algorithm for calibration-free measurement of gas concentration.[15]Their method can effectively expand the TDLAS measurement range, but it is still not suitable for use under saturated absorbance conditions. Quet al.realized the TDLAS measurement of potassium atoms under saturated absorption conditions. They first simulated the absorption spectrum based on the known temperature, path length, pressure value, spectral parameters,and Voigt linear function,and then determined the concentration of the analyte by fitting the measured spectrum profiles with the simulated spectrum profiles.[6]This method confirmed that an incomplete saturated-absorption spectrum has obvious advantages for improving the upper detection limit of single absorption lines. However,due to the required initial parameters, it was impossible to deal with incomplete absorption spectra when the temperature, pressure, and optical path were also unknown. Essentially, their approach was still a whole-profile fitting method.
There are many spectral profiles (such as Gaussian,Lorentz, Voigt, Galatry, Rautian and the Hartmann-Tran profile, etc.) used in practical spectralmeasurement applications, among which the Voigt profile is the most widely used, and there have been many reports about its calculation methods.[16–18]For an incomplete spectrum corresponding to saturated absorbance, although the spectral core is missing,the two wings of the spectrum are complete. Here, according to the characteristics of the two wings of the spectrum,we establish a method of spectral profile reconstruction based on Voigt profile two-wing fitting, and realize the application of saturated incomplete spectra in gas sensing.
2. Absorption saturation
The Beer–Lambert law is used to describe the process of laser energy change following absorption by a gas, but it is only valid as long as the molecules act independently of each other under high concentrations. For a large transition line strength and a long absorption path at low gas concentrations, the requirements of the Beer–Lambert law are fulfilled and the absorbance is directly proportional to the analyte gas concentration,[19]as expressed by
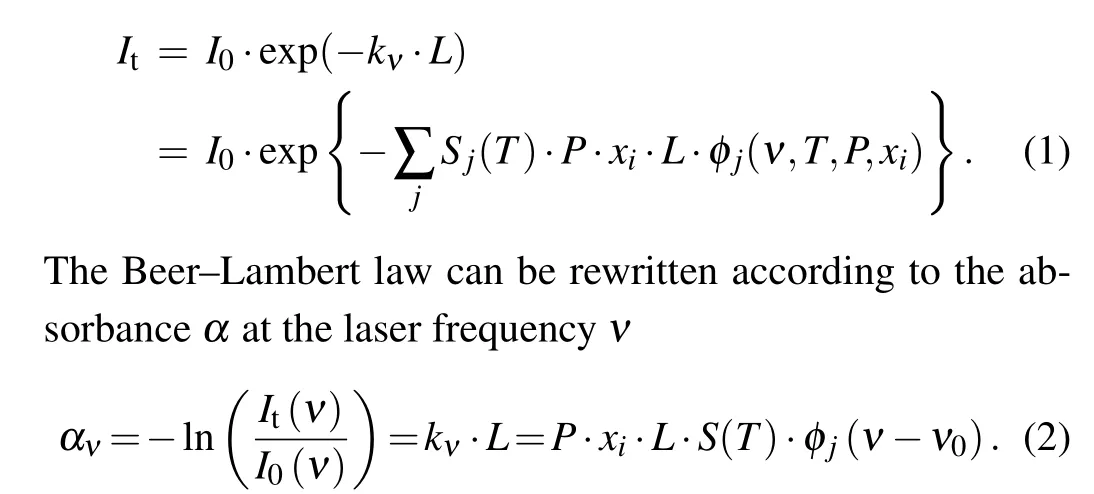
Here,I0andItdenote the incident laser intensity and transmitted laser intensity at the frequencyν;kνstands for the absorption coefficient;Ldenotes the effective optical path length;Pis the total gas pressure;xiis the mole fraction of the gasi;Sjis the line-strength of transitionj;ν0is the line-center frequency;φjdenotes the line-shape function of transitionj.
It can be seen from Eq. (2) that an increase in pressure,spectral line intensity, concentration or effective absorption path length will produce stronger absorption,which is characterized by saturated absorbance. Because of this,the transmission intensityItis very small at a certain frequency. Theoretically,whenIt→0 V,αν →+∞. However,due to the effect of noise and acquisition card accuracy, the minimum detectable transmission intensityItof direct absorption is about 0.001 V.
Figure 1(a) shows the water vapor absorption lines scanned by a tunable diode laser,which contains saturated absorption lines. Figure 1(b)shows the absorbanceαcalculated according to the Beer–Lambert law.
It can be seen from Fig.1(a)that increasing the high voltage level of the sawtooth wave and tuning the absorption peak to a high voltage level can increase the maximum peak height of the unsaturated absorbance. However, due to the limited operating voltage of the semiconductor laser,the high voltage level of the sawtooth wave is generally less than 3 V,and it is useless to amplify the detector signal through the amplifying circuit. In addition,the absorption line is usually tuned to the middle position of the sawtooth wave to achieve a complete spectrum scan. The background noise due to the laser,detector and data acquisition card is generally greater than 0.001 V.Thus,the maximum amplitude of the transmitted signal is less than 1.5 V and the minimum amplitude exceeds 0.001 V.According to Eq. (2), we can calculate that the maximum theoretical amplitude(peak height)of the unsaturated absorbance spectrum is about 7. In fact, the maximum detectable peak height of an unsaturated spectrum profile will be further reduced,due to the combination of multiple noises and the overall rise of the sawtooth signal caused by the circuit.
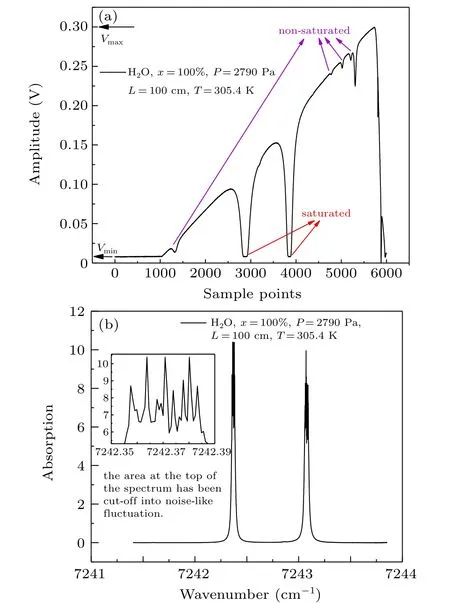
Fig.1.(a)Transmission signal including saturated and unsaturated absorption spectra; (b)water-vapor saturated absorption spectrum. The spectral peak position has been cut off and has become a noise-like fluctuation.
3. The spectral profile reconstruction method and its verification by simulation
According to Demtr¨oder’s definition, the area above the half-height position is called the spectral core, and the areas below half height are called the two spectral wings.[20]However,in this article,the“two wings”we have mentioned do not strictly follow Demtr¨oder’s definition, but refer to a part that does not contain the top area of the spectrum and whose height may be higher than,lower than,or equal to the half height of the spectrum.
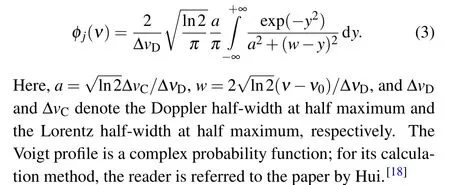
The Voigt profile function is the convolution of a Gaussian function and a Lorentzian function,and is the most commonly used spectral lineshape function under normal temperature and pressure conditions;it is given by
The spectral profile reconstruction method we propose in this article is essentially a nonlinear fitting, it uses a part of the spectrum data to recover the whole spectrum shape. First,we select the two wings of the actual measured spectrum,and then use the Voigt model and the L-M algorithm to obtain the complete shape of the incomplete spectrum profile. In order to ensure a good fitting effect, we should pay attention to the following points:(1)select the two wings to be as high as possible,but do not include the saturated part of the top region of the spectrum;(2)calculate the Gaussian broadening based on the ambient temperature value and enter it into the fitting program; (3)setting the boundary of the fitting parameters(center wavenumber, integral absorbance, Lorentz broadening) is helpful for fast convergence. In this article, the upper and lower boundaries that we set are 10 times and 0.01 times the corresponding initial values, respectively. In the actual measurement,we can get the estimated value(initial values)of the parameters to be measured through calculation or experience.Even if the environment to be tested is completely unknown,we can adjust the boundary range appropriately to keep the true value within the set boundary, and we have verified that the Voigt profile two-wing fitting method is effective as long as the true value is within the boundary range. A flowchart of the spectral profile reconstruction method is shown in Fig.2.
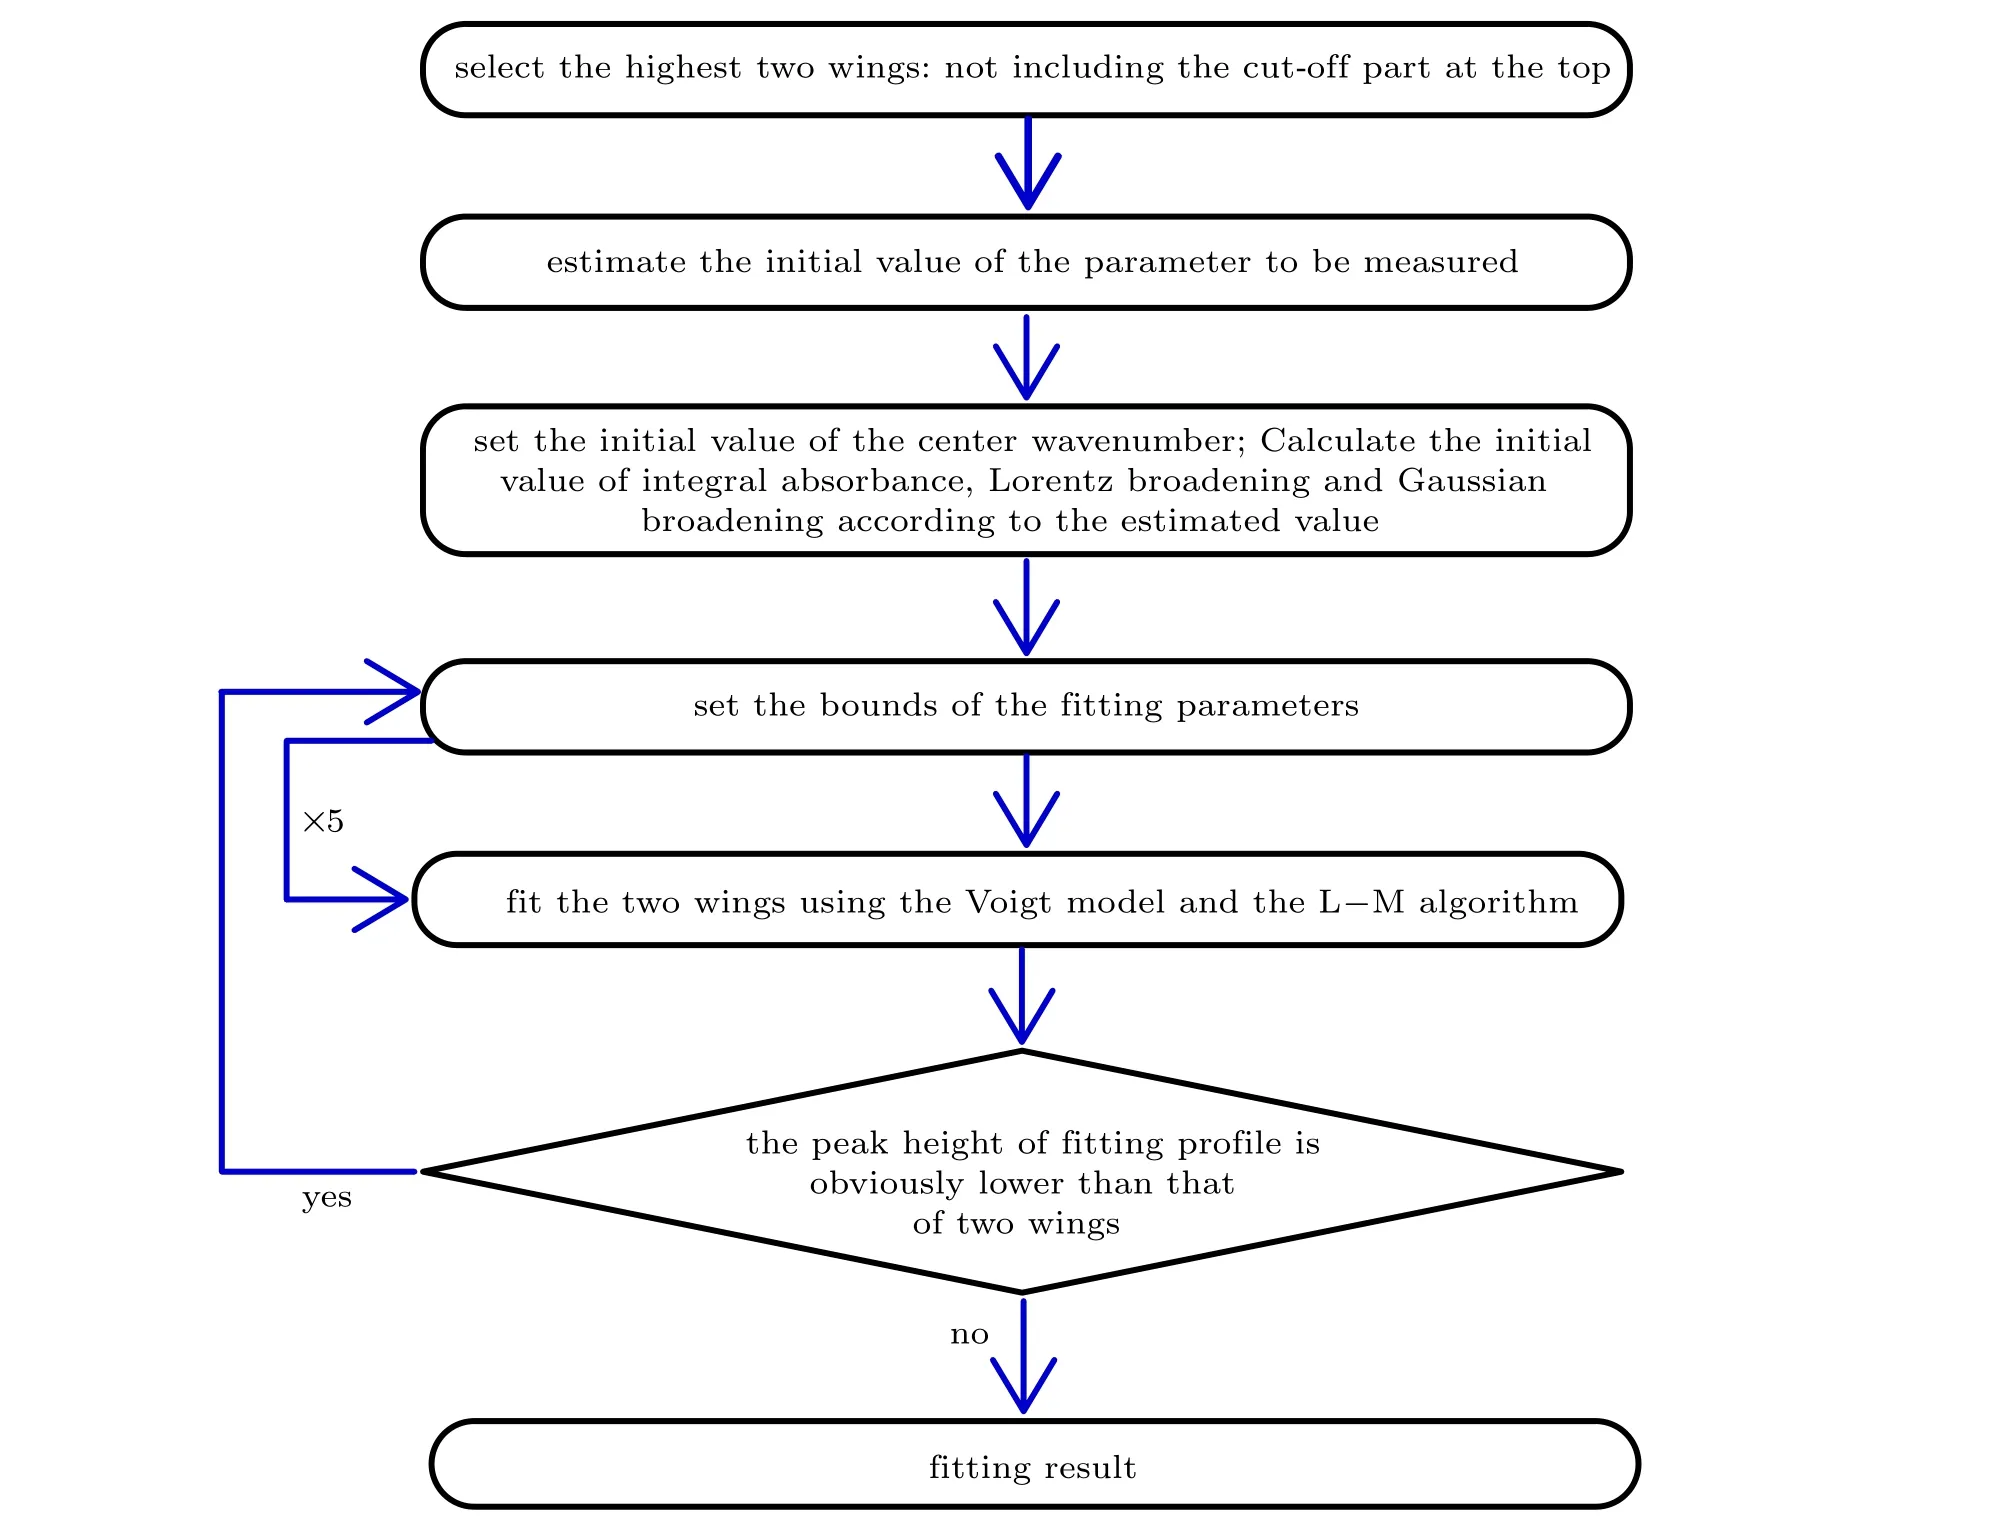
Fig.2. A flowchart of spectral profile reconstruction method.

Fig. 3. Different two-wing heights and fitting results. (a) The height of the two wings is the full height of the spectrum; (b)the height of the two wings is three-eighths higher than the half height of the spectrum;(c)the two wings heights are equal to half of the spectrum height; (d) the height of the two wings is three-eighths lower than half of the spectrum height.
We choose an isolated absorption line(there is no strong absorption line nearby) for the simulation and verification of the spectral profile reconstruction method. An absorption line with a wave number of 5393.65 cm−1is one of the suitable choices, because it avoids the influence of other absorption lines on the simulation results, and it has proved suitable for water vapor measurement.[21]We simulated the absorption spectrum of water vapor using the spectral parameters from the HITRAN database.[22]The simulated gas temperature is
296 K, the effective optical path is 500 cm, the water vapor mole fraction is 1%, and the pressures were 10 atm, 5 atm,1 atm and 0.1 atm. We have taken pressure broadening into account and added Gaussian noise to the spectrum in the theoretical calculation. Although the simulated spectrum was a complete shape,its peak height was greater than seven,so the actual spectrum in this simulated environment must be saturated. We chose the two wings of the spectrum at different heights and fitted them using the Voigt profile two-wing fitting method to reconstruct the spectral profiles one by one. The results of the reconstruction are shown in Fig.3.
As can be seen from Fig. 3, the difference between the reconstructed spectral profile and the original spectral profile is small,which verifies that the Voigt profile two-wing fitting method is effective at reconstructing an incomplete spectral profile. However,the residual of the reconstruction results under high pressure is significantly higher than those under low and normal pressures.In particular,when the height of the two wings is small,the fitting residual under high pressure conditions is larger.This is because the spectrum will broaden under high pressure conditions,which causes the two wings of adjacent spectral lines to overlap with each other, making the inherent two-wing characteristics of the spectrum insignificant.Therefore, the incomplete saturated absorption spectrum reconstruction method is more suitable for applications in low and normal pressure environments.
According to the approximate calculation method of the complex probability function,[17]we can calculate the ratio of the maximum gas concentration that can be detected by a single absorption line before and after the spectral profile reconstruction method is used. We assume that the minimum two-wing height for the spectral profile reconstruction method is one quarter of the spectral height and that the maximum peak height of the unsaturated spectrum is seven. Therefore,according to Eqs. (2) and (3), the maximum spectral heights that can be completely measured before and after the VPTWF method is used can be expressed asαν1(ν0)andαν2(ν0),respectively.
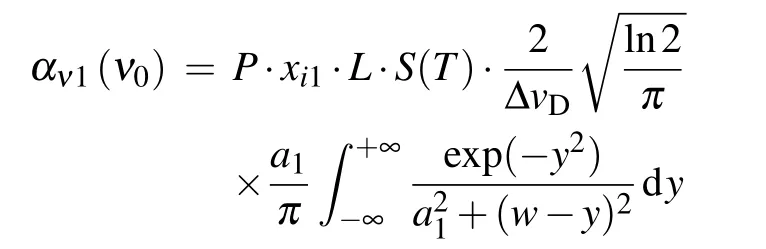
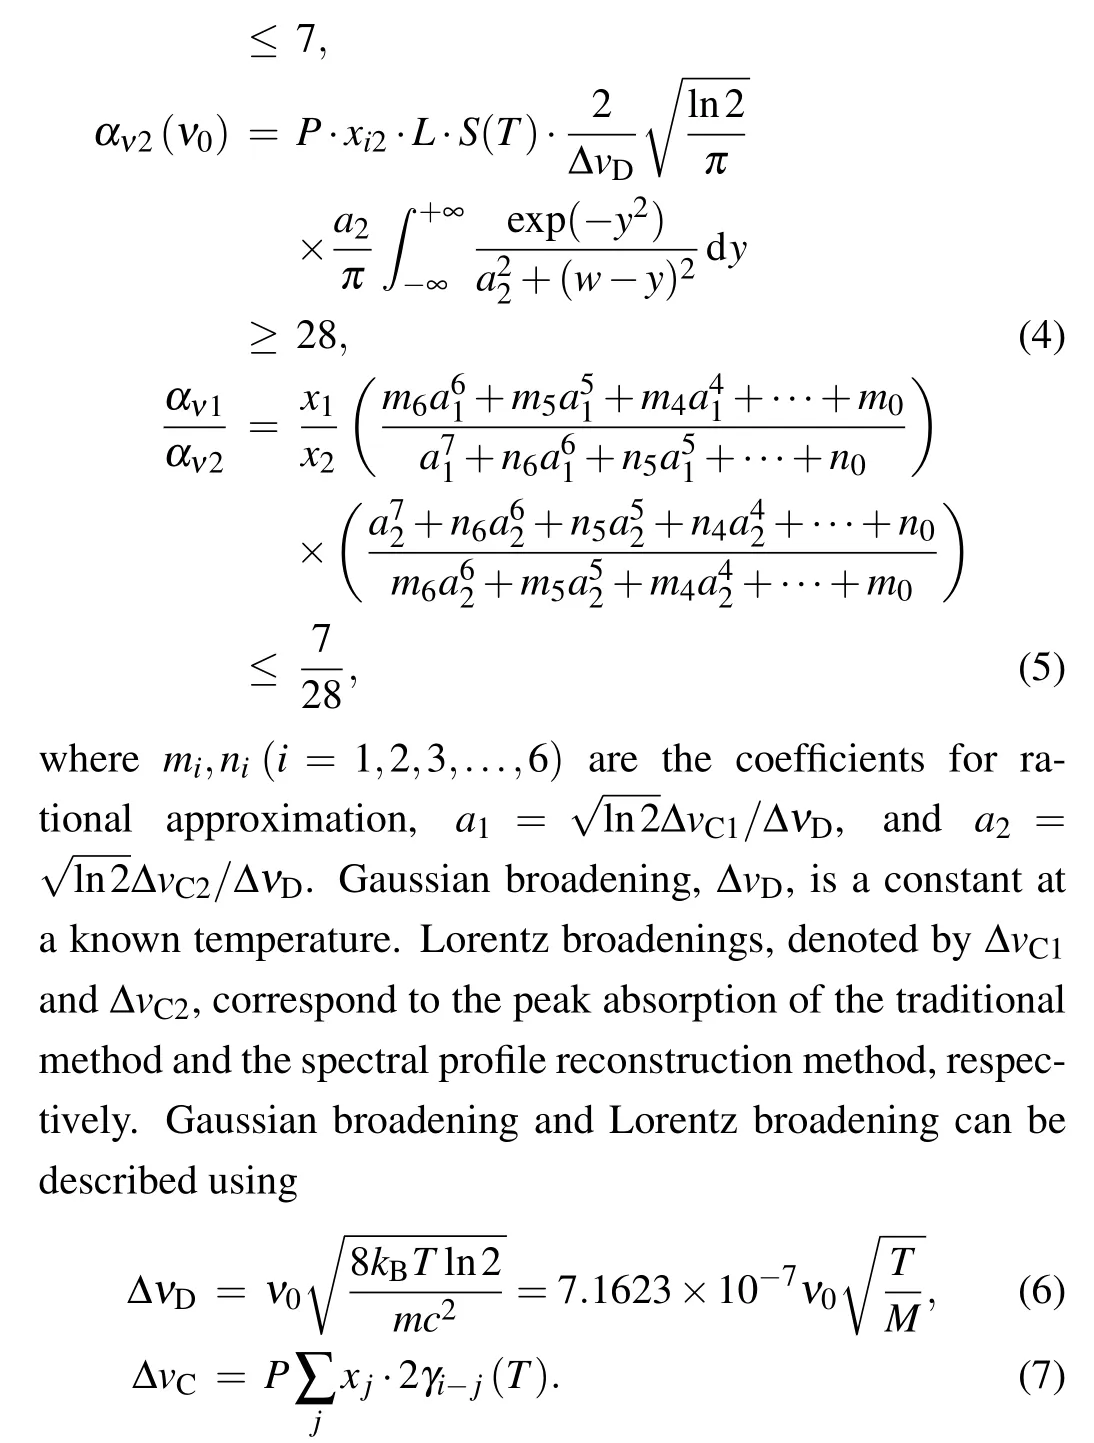
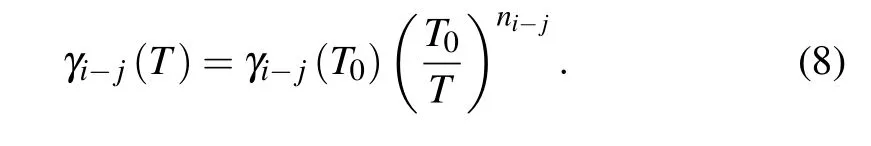
Here,ν0[cm−1]is the line center frequency,T[K]is the temperature,Mis the molecular weight of the absorber species,γi−j(T)[cm−1/atm]is the pressure broadening half-height and half-width coefficient at temperatureT, and its relationship with temperature is expressed by
From Eqs.(5)and(7),we know the ratio of concentration increase is not only related to the concentrationx1,but also to air-broadened half-width,self-broadened half-width,pressure and gas temperature. For the above simulation conditions,the TDLAS measurable gas concentration has been increased by 8.7 times(x2/x1=8.7),compared to the case before the spectral profile reconstruction method was used. In fact,due to the combination of multiple noises and the overall rise of the sawtooth signal caused by the circuit, the maximum peak height of the conventional unsaturated spectrum is less than seven.Therefore, the spectral profile reconstruction method further improves the upper limit of gas concentration absorption spectrum sensing.
4. Application of the incomplete saturated absorption spectrum method
4.1. Experimental setup
The absorption spectrum of water vapor in the nearinfrared region is measured by the TDLAS method.In order to obtain a saturated absorption spectrum, the water vapor concentration is increased to 100%,and saturation of the absorption is achieved by adjusting the water vapor pressure. The experimental setup is depicted in Fig.4.
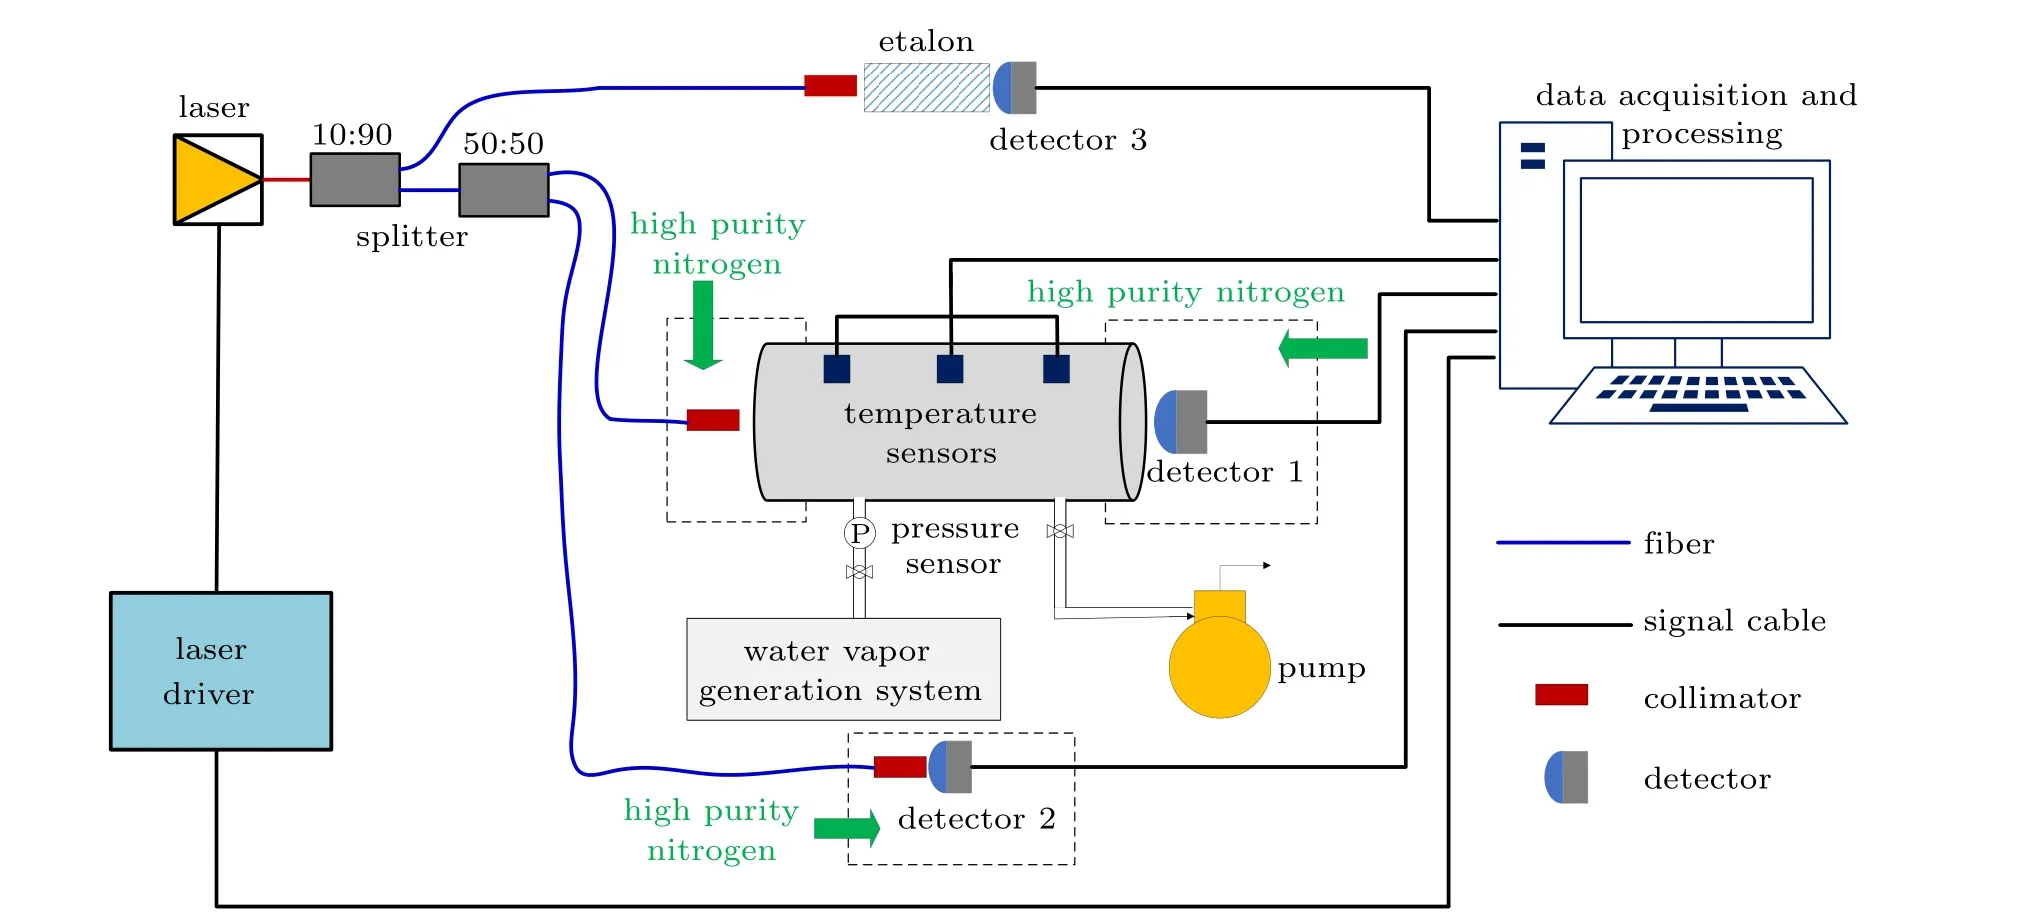
Fig.4. Schematic diagram of the experimental setup.
A distributed-feedback (DFB) InGaAsP diode laser is used for water vapor spectrum measurement. A collimator(parabolic mirror) is used to collimate the output of the laser and is free from any etalon interference a lens might cause.A laser driver containing temperature and current modules is used to control the light emission of the laser. The current injected into the laser is tuned by a sawtooth wave signal to achieve a laser output wavelength that covers the desired absorption features of the H2O molecules. A transimpedance amplifier circuit is used to convert photocurrent signals to voltage signals, and to achieve signal amplification. The voltage signal is recorded by a data acquisition card(NI,PXIe 5105).The optical path length of the absorption cell is 100 cm, and its temperature and pressure are measured with a platinum resistance sensor(full-scale 1.4 K–500 K and an accuracy of<0.12%of FS)and a pressure sensor(full-scale 1 Pa–0.1 MPa and an accuracy of<0.2%in the reading),respectively. The water-vapor generation system releases water vapor at low pressure.Three temperature sensors are used to judge whether the gas in the gas pool is uniform after each change of the total gas pressure. The light output from the DFB diode laser is divided into two parts by a 1×2 fiber splitter. One beam(at 10% of the total intensity) is passed through the etalon to form interference fringes for laser time–frequency conversion,
whereas the second beam (90% of the total intensity) is further divided into two parts by a 1×2 fiber splitter. The first part is passed through the absorption cell, and used to measure the optical absorption by the water vapor, whereas the second part is directly measured by detector 2. We built three“sealed cases” to isolate the collimator and detector from the outside environment, and purged them using high-purity nitrogen gas to avoid interference from ambient water-vapor absorption. The water-vapor absorption spectrum measured by the detector 1 is corrected using the background absorption information measured by detector 2. The water vapor is introduced into the absorption cell by a pump. The wavelength scanning frequency of the laser is set to 5 kHz and the signal sampling rate to 30 MSam/s, and the experimental data acquisition and processing is implemented on the LABVIEW software platform. A 100-scan average is used to improve the signal-to-noise ratio(SNR)of the measured spectrum.
4.2. Experimental results
To verify that the spectral profile reconstruction method is not only suitable for single-peak fitting, but also for multipeak fitting,a line pair at around 1.38µm was selected. This line pair can be covered by one diode laser,which was previously used for velocity[24]and dew/frost point measurements in a wind tunnel.[7]
We achieved saturated absorption by controlling the pressure of the pure water vapor entering the absorption cell. First,we calculated the absorbance of the saturated absorption according to Beer–Lambert law, and then fitted each spectrum according to the procedure shown in Fig.2;the fitting result is shown in Fig.5.
The integrated absorbance valueAand the Lorentz halfheight and half-width values can be obtained by a spectral profile reconstructed by the Voigt profile two-wing fitting method,and the total gas pressure is calculated according to
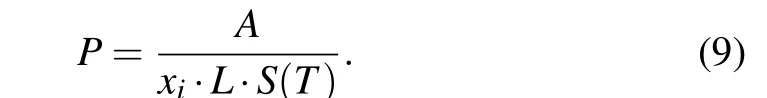
Here,xiis the water-vapor concentration,Lis the effective optical path of the absorption cell,andS(T)is the line intensity of the selected spectrum(its experimental value can be found in Ref. [7]). The temperature in the gas absorption cell, as measured by the platinum resistance sensor, is 305.4 K. For the absorption line at 7243.08 cm−1,the results of single-peak fitting and double-peak fitting are the same,which proves that the spectral profile reconstruction method is also suitable for multi-peak fitting.The water-vapor pressure was calculated by the integrated absorbance value, and then compared with the measurement result of the commercial high-precision pressure sensor(Pfeiffer Inc. CCR361,Germany). A comparison of results is shown in Fig.6.
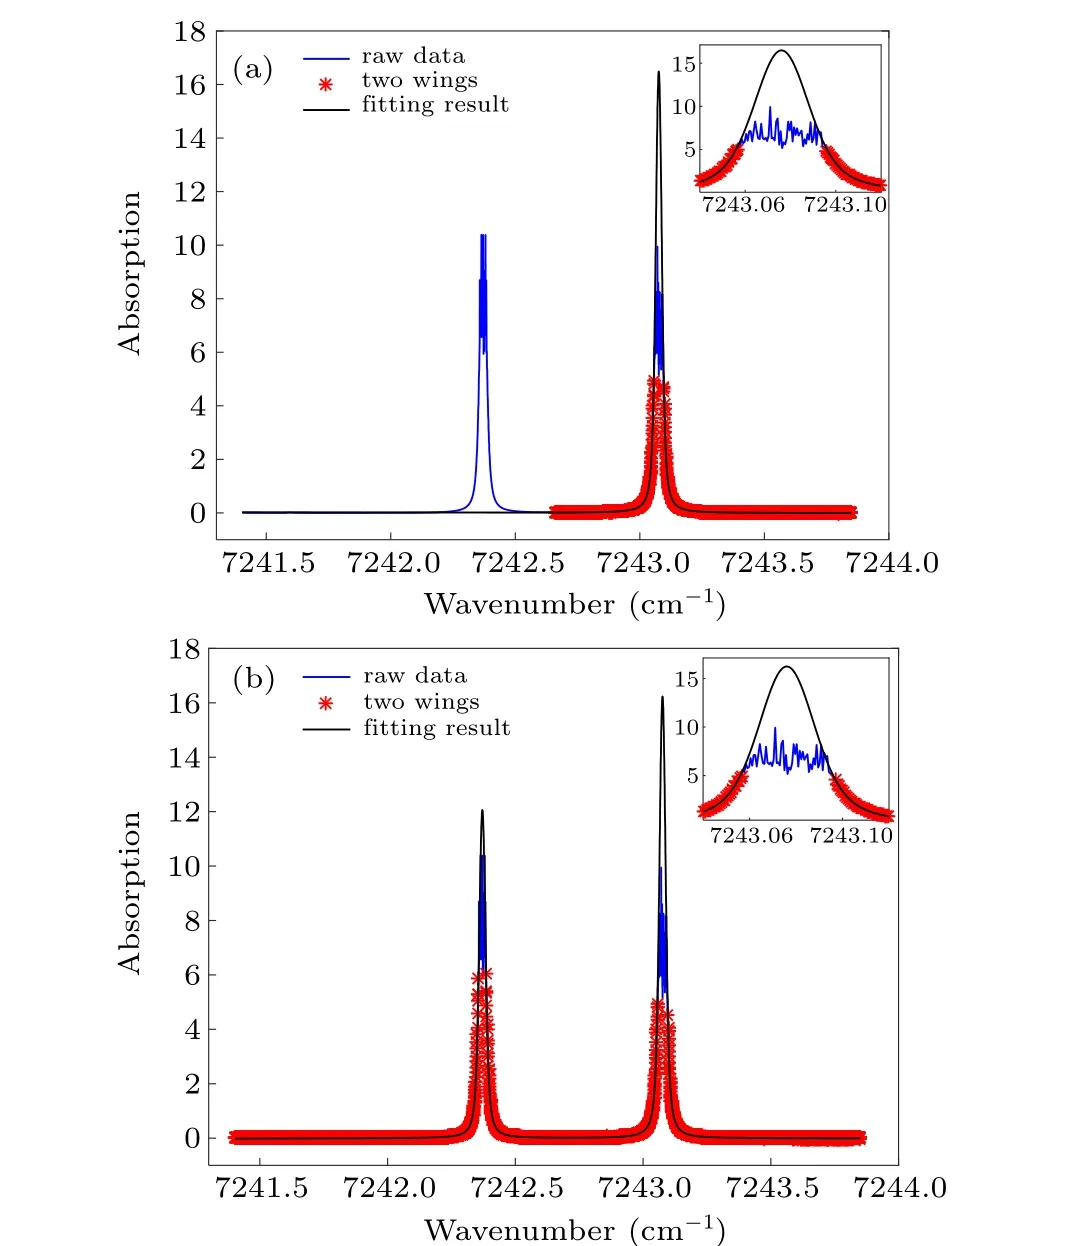
Fig. 5. Reconstruction of an incomplete spectrum using the Voigt profile two-wing fitting method. (a)Single-peak fitting;(b)double-peak fitting.
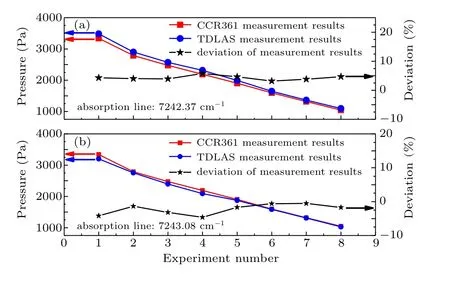
Fig. 6. The results of water vapor pressure measurements made by incomplete saturated spectroscopy and their deviation from the results obtained by CCR361 high-precision sensors.The measurement results of the two absorption lines were simultaneously obtained through the multi-peak reconstruction method.Since the water vapor generation system is at room temperature,the saturated water vapor pressure is always low.
As shown in Fig.6,the maximum deviation between our absorption saturation spectrum pressure results and the commercial high-precision pressure sensor is less than 5%. However,this 5%deviation is not only caused by this new method,it is the result of the joint actions of multi-parameter uncertainty (among which, the uncertainty of the optical path is about 1.02%,the uncertainty of the line strength is 5%<S ≤10%,and the uncertainty of the temperature is 0.12%).
While using the spectral profile reconstruction method to obtain the integrated absorbance value, the Lorentz broadening for the full width at half maximum of the spectrum can also be obtained. Then,according to Eq.(7),the Lorentz broadening at the full width at half maximum under different pressures can be linearly fitted to obtain the self-broadened half-width coefficient at temperatureT(305.4 K).
According to Eq. (7), we know that the slope of the fitted line in Fig.7 is the self-broadened half-width coefficient at 305.4 K. We can easily obtain the self-broadened half-width coefficient at the reference temperature (296 K) according to Eq. (8). The result was compared with the HITRAN 2016 database(as shown in Table 1),where the maximum deviation at 7242.37 cm−1was 0.24%, and the maximum deviation at 7243.08 cm−1was 9.10%. There are two main reasons for the different deviations of the Lorentz broadening results of these two absorption lines. The first is the accuracy of difference reconstruction,and the second is the different uncertainties of the self-broadened half-width coefficient of the two absorption lines in the HITRAN database.
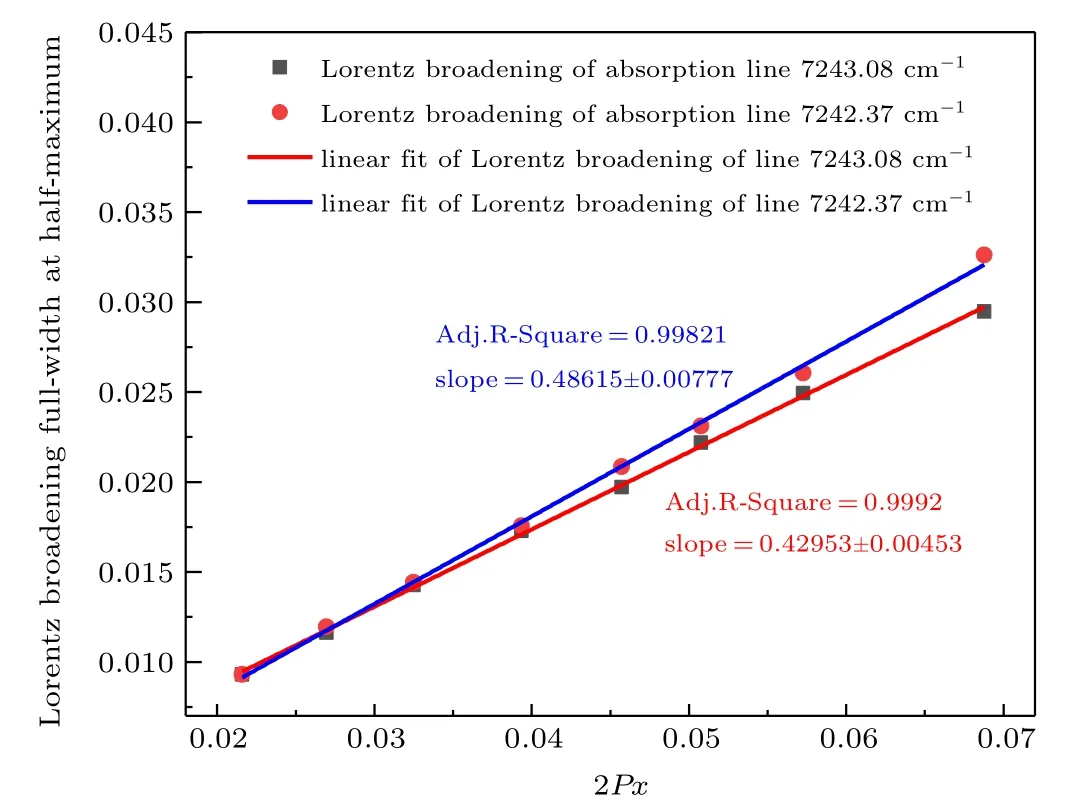
Fig. 7. The linear fitting of Lorentz broadening at the full width at half maximum under different pressures. The slope of the fitted line is the selfbroadened half-width coefficient.
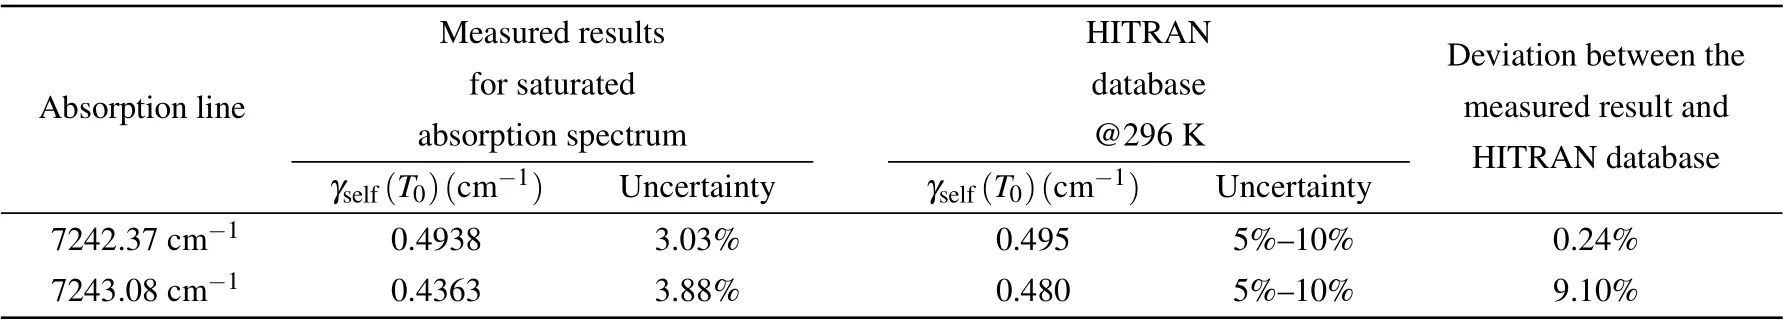
Table 1. Comparison of the measured self-broadened half-width coefficient at 296 K and the corresponding values in the HITRAN2016 database.
5. Conclusions and outlook
A novel,simple,and effective method for incomplete saturated absorption spectrum applications has been developed,successfully demonstrated, and validated. This method recovers the whole spectrum using the partial spectrum data.Through simulation, we verified the feasibility of the reconstruction method based on different two-wing heights under normal and low pressures. We introduced the application procedure of the spectral profile reconstruction method in detail.This method was successfully used to measure H2O pressure and the Lorentz broadening of a saturated absorption spectrum within a 100 cm absorption cell. The pressure measurement results are in good agreement with commercial high-precision pressure sensors; however, the self-broadened half-width coefficient results show some deviation when compared with the HITRAN database, which requires us to further verify the effectiveness of the broadening coefficients in the HITRAN database at high analyte concentrations.
In conclusion, we have demonstrated a potential method for saturated-absorption incomplete-spectrum analysis. This provides a new possibility for the TDLAS measurement of gases with greater concentration dynamic ranges using a single laser or a single absorption line. In the future, we intend to further validate the spectral profile reconstruction method under high-pressure conditions,and we also aim to expand its measurement capabilities to other spectroscopy technologies such as the Fourier transform infrared(FTIR)spectrum,cavity ring-down spectroscopy (CRDS), differential optical absorption spectroscopy(DOAS),etc.
杂志排行

Chinese Physics B的其它文章
- Quantum computation and simulation with vibrational modes of trapped ions
- ℋ∞state estimation for Markov jump neural networks with transition probabilities subject to the persistent dwell-time switching rule∗
- Effect of symmetrical frequency chirp on pair production∗
- Entanglement properties of GHZ and W superposition state and its decayed states∗
- Lie transformation on shortcut to adiabaticity in parametric driving quantum systems∗
- Controlled quantum teleportation of an unknown single-qutrit state in noisy channels with memory∗