Geochemical characterization of the salinity of irrigated soils in arid regions(Biskra,SE Algeria)
2021-06-21MohamedAmineAbdennourAbdelkaderDouaouiJesBarrenaManuelPulidoAbdelhamidBradaAmelBennacerChiaraPicciniAlbertoAlfonsoTorre
Mohamed Amine Abdennour·Abdelkader Douaoui·Jesús Barrena·Manuel Pulido·Abdelhamid Bradaï·Amel Bennacer·Chiara Piccini·Alberto Alfonso-Torreño
Abstract The agriculture in Biskra,southeastern Algeria,is based on traditional practices and characterized by small irrigated fields.In the last decades,the increasing demand in water as well as the scarcity of rainfall has forced many farmers to use groundwater of low quality to maintain the profitability of their crops.Unfortunately,this practice seems to be the main harmful factor for soil quality in the region since it is responsible for the salinization of the irrigated areas.Aiming to assess the impact of this phenomenon,the soils of the irrigated perimeter of El Ghrous-a representative rural community located in the west of Biskra-have been analyzed.A set of 82 soil samples was collected from top and subsoil(0-15 and 15-35 cm respectively),on which the following physicochemical analyzes were performed:Ca2+,Mg2+,K+,Na+,Cl-,SO42-,HCO3-,NO3-,pH,electrical conductivity(EC)and sodium adsorption ratio.A Principal Component Analysis was performed to individuate the geochemical processes that influenced significantly the evolution of soil salinity and its pathways.The results showed a calcium sulfate(CaSO4)facies with a high risk of salinity and a low to medium risk of alkalinity.The calcite residual alkalinity and generalized residual alkalinity decreased as the solutions became more concentrated.Most of the samples were oversaturated in carbonate minerals(aragonite,calcite,and dolomite)and undersaturated in evaporitic minerals(anhydrite,gypsum,and halite).Finally,two multiple linear regressions(using cations and anions as independent variables)have been proposed to quantify soil salinity.These equations,with an accuracy of 85 %,can represent a time and money-saving tool for managers and farmers to estimate the EC,in comparison to the traditional estimation methods.
Keywords Electrical conductivity·Cations·Anions·Soil quality·Saturation index·PHREEQC
1 Introduction
Soil salinization is a dynamic issue that constitutes a chronic threat to physicochemical soil properties(Besser et al.2017).On a global scale,the estimated loss of arable land through soil salinization and alkalization amounts to about 10 Mha each year(Jalali 2007).Thus,in arid regions,several researchers investigated the effects of soil salinization on crop production,in Tunisia(Besser et al.2017;Haj-Amor et al.2017),Egypt(Salem and Osman 2017),Spain(Niñerola et al.2017),Iran(Jalali 2007),and China(Wang et al.2015).Salinization occurred in many deserts in Algeria,leading to severe degradation of soil resources(Abdennour et al.2019b;Koull and Chehma 2016;Medjani et al.2017;Semar et al.2019).
In arid environments the effects of irrigation water on soil properties have been widely discussed(e.g.Ayadi et al.2018;Besser et al.2017;Bradaïet al.2016;Douaoui et al.2006;Hamed et al.2013a,2014b;Hamed and Dhahri 2013).In particular,recent studies have focused on this problem in Algeria:Semar et al.(2019)observed a significant chemical exchange among soil horizons involving sodium,chlorides and sulfates.Boufekane and Saighi(2016)confirmed the effect of water quality on the occurrence of salty soils.Boudibi et al.(2019)gave warnings about the high salinization risk in the Biskra region due to the groundwater salinity,detected by GIS and geostatistics approaches.
The chemical composition of natural solutions depends on three main processes:(a)the dissolution of primary minerals,(b)the evolution or dilution of solutions,and(c)the neo-formation of secondary minerals by precipitation during evaporation(Zouggari 1996).When water enters in contact with soil minerals,many chemical reactions occur within the aqueous phase and between the soil solution and the minerals(Bradaïand Douaoui 2013).The salt soil solution can be modeled by using the geochemical simulator PHREEQC,to evaluate the equilibrium state for each mineral(Parkhurst and Appelo 2005).Understanding the geochemical processes that take place during contact between water and soil,it is important to characterize the natural parameters influencing soil chemistry and to identify the geochemical pathways controlling soil evolution.
Soil alkalization is considered to be a rapid process in irrigated areas,occurring in a few years,and considerably affecting soil properties(Cheverry and Bourrié2003).The salinity/alkalinity is generally quantified using parameters such as the electrical conductivity(EC)and the percentage of adsorbed sodium or sodium adsorption ratio(SAR).Nowadays,the concept of residual alkalinity is being increasingly used,since it allows to predict the geochemical pathway during the evaporation(Debieche 2002).Such prediction appears necessary to understand the consequences of soil salinization.
In Algeria,the spreading of irrigation in agriculture led to a significant advance in crop production.In recent years,the development of irrigated crops in the south of the Country(climatically influenced by the Sahara Desert)has been based mostly on groundwater pumping(Kuper et al.2016).Such practice ensured higher income for farmers,but it is also responsible for soil salinization,accompanied occasionally by alkalization processes(Nezli et al.2007),caused by the poor quality of water.Therefore,a better understanding of such degradation problems-which are threatening sustainability in important productive areas of Algeria-represents the main challenge for the scientific community(Bradaïand Douaoui 2013).
In this region,the geological setting,irrigation with poor quality groundwater,and land use patterns are the most important factors affecting soil salinity.In arid regions,both natural features and human interventions affect soil quality and the sustainability of natural resources such as water and soil.Increasing the knowledge of the geochemical evolution of soils in arid and semi-arid regions could improve the understanding of the hydro-geochemical systems in such areas,leading to the sustainable development of soil resources and effective soil management.Identifying the factors affecting soil quality using suitable evaluation methods is necessary.For a better characterization of the hydro-geochemistry,multivariate statistical methods and the analysis of chemical facies and saturation indices were used in the literature(Sajil Kumar 2020;Yidana and Yidana 2010).
In arid regions,several natural factors,such as the nature of the parent material,the presence of shallow groundwater tables and the degradation of saline rocks,can cause soil salinity(Gorji et al.2015),together with the practice of old irrigations techniques,the irrigation with salt-rich water,the land clearing,and the use of fertilizers with high salt content.Uncontrolled irrigation with the groundwater of poor quality and by inadequate methods poses problems for management and soil and water resources conservation,mainly related to the hydro-geochemical dynamics.Indeed,irrigation can either bring salts to the soil or mobilize those already present into the soil itself.In both cases,soil degradation can occur.
In the Biskra region,Algeria,farmers are currently using groundwater of poor quality,usually rich in salts,for irrigation,and no information is available about its geochemical pathway.In this study,the irrigated perimeter of El Ghrous-a representative rural community located in the west of Biskra-was chosen,since it presents a particular spatio-temporal dynamics of soil salinization which would be difficult to follow and to characterize without a geochemical study.The main goal of this research is to characterize the geochemistry of the soils in the El Ghrous area-irrigated with saline groundwater-and to depict the factors controlling soil quality in an area with prevalent agricultural use.Such characterization would allow us to define a method for quantifying salinity from single values of some cations and anions by applying multiple linear regression,to propose a model for estimating the electrical conductivity of soil at each depth.The proposed equations were also used for mapping soil salinity,helping the assessment of soil quality in the study area.
2 Study area conditions
2.1 Location and climate
The study was performed in the irrigated perimeter of El Ghrous in Biskra Region,SE Algeria(Fig.1).This region covers an area of 9324 ha,and the altitude ranges from 130 to 200 m a.s.l.(Fig.1).The Biskra region constitutes a pivotal zone between the north and the south of Algeria and can be considered a transition zone from the morphological and bioclimatic point of view.The transition is quite abrupt at the foot of the Saharan Atlas,where from a fairly high and rugged relief in the north we pass to a plateau topography slightly inclined towards the south(Bougherara and Lacaze 2009).The Biskra region is under a Saharan climate,with an average annual rainfall of 138 mm,an average air temperature of 22.3 °C,and relative humidity of 42.9 %(National Meteorological Office).

Fig.1 Geographical location of the study area
2.2 Geology and hydrogeology
The Biskra region represents a structural and sedimentary transition zone.Its northern part is mountainous,while the southern one is a collapsed area-part of the northern Sahara.The transition between these distinct domains occurs through a set of flexures,folds,and faults of prevalent E-W orientation,called‘‘accident south atlasique’’(Chebbah 2016).The region is mainly characterized by sedimentary terrain,ranging from the Barremian at the base to the Quaternary at the top.El Ghrous perimeter is characterized by a Quaternary formation,with several levels of encrusted glacis(gypsum and limestone):it includes the calcareous,chalky,sandy and clayey alluviums.Such formation,also called Deb-deb of the Quaternary(Drouiche et al.2013;Mostephaoui et al.2013),consists of chalk and limestone located around the oases(Fig.2).
The study area is part of the wide hydrogeological basin of northern Sahara.It comprises several aquifers of various importances by lithological composition,geological structure,and hydrogeological potentialities.Geophysical surveys,drillings,and the observations of stratigraphic columns allowed to identify different aquifers exploited in the Biskra region.According to Drouiche et al.(2013),the main aquifers exploited in the El Ghrous region belong to the following regional water bodies:
·Mio-Pliocene tablecloth:exploited mainly in the south of the region,where its thickness becomes considerable.It consists essentially of an alternation of impermeable clay layers and sand and gravel layers.
·Lower Eocene tablecloth:outcropping in the north of the region,becomes increasingly deeper southwards.Its reservoir is made of limestones and marly limestones.Various drillings showed that the Eocene limestones exhibit a dense network of diaclases often karstified.This aquifer is intensively exploited and extends from the north to the center of the region.
2.3 Pedology and agricultural setting
According to the Soil Map of Algeria(Durand and Barbut 1938)(Fig.3),the El Ghrous area is dominated by alluvial soils and soils originated by wind erosion.Most of them contain sulfates in the topsoil,generally with light grey color-sometimes beige.Their structure is often finely lumpy,and a gypsum embedding with calcareous clusters or nodules are present.
El Ghrous region is famous for its dates and for its vegetable crops in greenhouses,where three production systems are dominant:a date production system,vegetable crops system,and a mixed system(dates and vegetable crops).
Irrigation of agricultural land in the study area is provided by groundwater.Irrigation with saline groundwater plays a harmful role in arid environments-where evaporation is strong-enhancing the accumulation of soluble salts into the soil.According to Abdennour et al.(2020),groundwater in the El Ghrous region has a very high salinity,exceeding in most boreholes the standard prescribed by the FAO(3 dS m-1),and the total dissolved solids(TDS)varying from 820 to 5000 mg/L(theoretically unusable for irrigation).Water geochemical facies in the region vary from one aquifer to another.The two dominant facies are the calcium sulfate facies for the Mio-Pliocene water table,and the sodium sulfate facies for the Lower Eocene water table(Drouiche et al.2013).In the El Ghrous area two main irrigation techniques are used:submerged irrigation,locally and for the date,palm cultivation in oases,and drip irrigation,for cash crops under greenhouses in the north of the region.
The intensification of agriculture has been accompanied by an important application of agrochemical inputs,representing a potential source of soil and groundwater contamination.According to Drouiche et al.(2013),the high fertilization doses largely exceed the recommended ones.They estimated that only about 50 % of the fertilizer applied is absorbed by the crops.
The Biskra region experienced a recent remarkable development thanks to both plasticulture and phoeniciculture(Daoudi and Lejars 2016).The official statistics from the Direction des Services Agricoles(DSA)of Biskra state that during 2013 El Ghrous represented about 3.2 %of the total irrigated area and about 3.8 % of the total crop production in the province of Biskra.The irrigated area shows a wide surface affected by soil salinization,as a consequence of the excessive use of water of poor quality for irrigation(Abdennour et al.2019a).According to Abdennour et al.(2019a),a significant increase of plasticulture was observed in the region across the period from 2009 to 2017,even if only 30 % of the initial area was retained.This led to a decline in soil fertility caused by the increased use of saline irrigation water.
3 Materials and methods
3.1 Soil sampling and analyses
Soil sampling was carried out in October/November 2017 in 41 randomly selected points,geolocated using a handheld GPS.Samples were collected both from topsoil(0-15 cm)and from subsoil(15-35 cm).A total of 82 samples were packed in plastic bags to be brought to thelaboratory,then dried in the open air and sieved at 2 mm(Aubert 1978).Chemical analyses were performed c/o the Laboratory of Soil Science of the Technical Research Centre on Arid Regions of Biskra,following standard procedures(Rodier et al.2009).
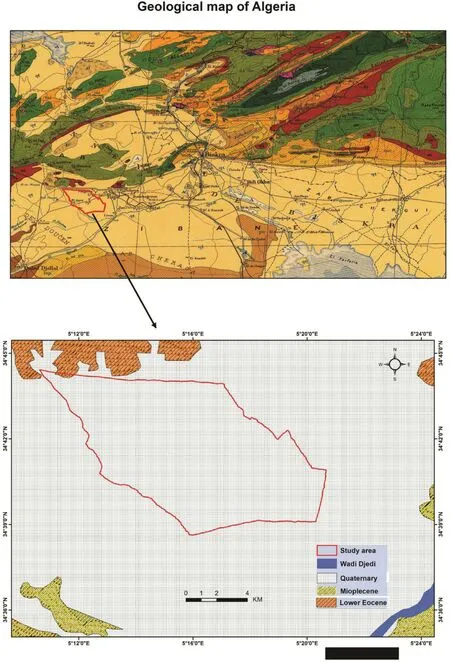
Fig.2 Geology map of study area
Soil pH was measured in a soil-water solution 1:2.5.Cations(Ca2+,Mg2+,K+,and Na+)and anions(Cl-,NO3-,HCO3-,and SO42-)were extracted from a soilwater solution 1:5,to determine the ionic balance.Different titration methods were utilized in the determination of the concentrations of Ca2+and Mg2+(EDTA titrimetric),Cl-(Mohr),and HCO3-(complexometric).A flame photometer(Jenway)was used for the quantification of Na+and K+.

Fig.3 Soil map of El Ghrous
Since the physical properties of the soil(i.e.a sandy texture)did not allow us to easily determine the saturation history of the soil samples-due to difficulties encountered in identifying the saturation criteria of the paste(He et al.2015;Semar et al.2019)-EC was measured by electrical methods on a 1:5 aqueous extract,and the measured values were adjusted at a temperature of 25 °C(Franzen 2007).
All cations and anions were processed by PHREEQC software for geochemical modeling of saturation indices.The chemical balance of six minerals(anhydrite,aragonite,calcite,dolomite,gypsum,and halite)was estimated from the saturation index(SI),which is expressed as follows(Parkhurst and Appelo 2005):

where IAP is the product of the ionic activity,and Ks is the solubility constant of the mineral.If groundwater is saturated by a particular mineral species,then SI=0(steadystate),whereas SI>0 indicates supersaturation relative to the mineral species(precipitation state),and SI<0 indicates undersaturation(dissolution state)(Zaidi et al.2017).
The identification of geochemical processes was performed using tracers(concentration factor,CF)and geochemical facies from the Piper and Riverside diagrams.Since chlorides(Cl-)are not degraded and tend to remain in the solution once dissolved,CF is a good indicator of ionic exchanges among subsurface horizons(Semar et al.2019).Alkalinity was determined from three parameters:(1)residual alkalinity of calcite(RAc),(2)generalized residual alkalinity(RAg)(Marlet and Job 2006),and(3)SAR(Richards 1954).
3.2 Data analysis
A multivariate technique,Principal Component Analysis(PCA),was utilized to reduce the number of variables in some explicative axis or components(Philippeau and Philippeau 1986).The saturation state of the soil samples was analyzed by using the PHREEQC hydro-geochemical equilibrium model(Parkhurst and Appelo 1999).
Correlation analysis and different types of regression were used to obtain reliable equations to determine the values of EC.Cross-validation comparing measured and estimated values were carried out to define the prediction performance of the obtained equations.The resulting correlation coefficient,the mean error(ME),and the root mean square error(RMSE)were used as performance indicators(Arslan 2012).
Estimated EC values were then mapped by the Inverse Distance Weighting(IDW)interpolation methods,which assumes that close points have more similar values than further ones(ESRI 2011).
Statistical analyses were performed using the following software packages:SPSS v.18.0(PCA),Diagrams v.6.51(Piper and Riverside diagrams),PHREEQC v.2.8(saturation index),and ArcGIS 10.2 with Geostatistical Analyst Extension(mapping).
4 Results
4.1 Soil characterization
Table 1 lists the mean values of the analyzed parameters for both 0-15 and 15-35 depths.Soils are slightly alkaline(pH>7.5)with an average pH value of 8.1 in the whole considered depth.Measured samples range from 7.7 to 8.9 and from 7.7 to 8.7 for topsoil and subsoil,respectively.EC shows extremely variable values ranging from 0.5 to 6.5 dS m-1in topsoil(mean value:1.9 dS m-1,coefficient of variation(CV):47.4%),and from 0.1 to 3.7 dS m-1in subsoil(average:1.2 dS m-1,CV:38.6%).This remarkable variation in EC values is mainly due to the irrigation water quality-coming from two different aquifers-and to the irrigation technique used in this area,which varies between submersion irrigation and drip irrigation.
The mean concentrations of the main cations and anions follow the sequences:Ca2+>Na+>Mg2+>K+and SO4->Cl->HCO3-respectively.Ca2+was the dominant cation,ranging from 8.0 to 76.0 meq L-1(mean value:32.2 meq L-1)in topsoil,and from 3.2 to 55.0 meq L-1(mean value:26.8 meq L-1)for subsoil.Na+ranged from 1.1 to 36.0 meq L-1in topsoil,with an average value of 10.8 meq L-1,and from 0.2 to 26.0 meq L-1in subsoil(mean value:5.0 meq L-1).
SO4-content ranges from 2.8 to 50.0 meq L-1in the topsoil(average:14.0 meq L-1),and from 1.8 to 30.0 meq L-1in the subsoil(average:12.0 meq L-1).Clvaried from 1.2 to 19.0 meq L-1in topsoil(mean value:6.5 meq L-1),and from 1.2 to 13.0 meq L-1in subsoil(4.5 meq L-1).The concentration of HCO3-was relatively low,ranging from 0 to 12.0 meq L-1with an average of 2.5 meq L-1in topsoil and of 1.7 meq L-1in the subsoil.Values of anions and cations content showed a high variability(expressed by high coefficients of variation).
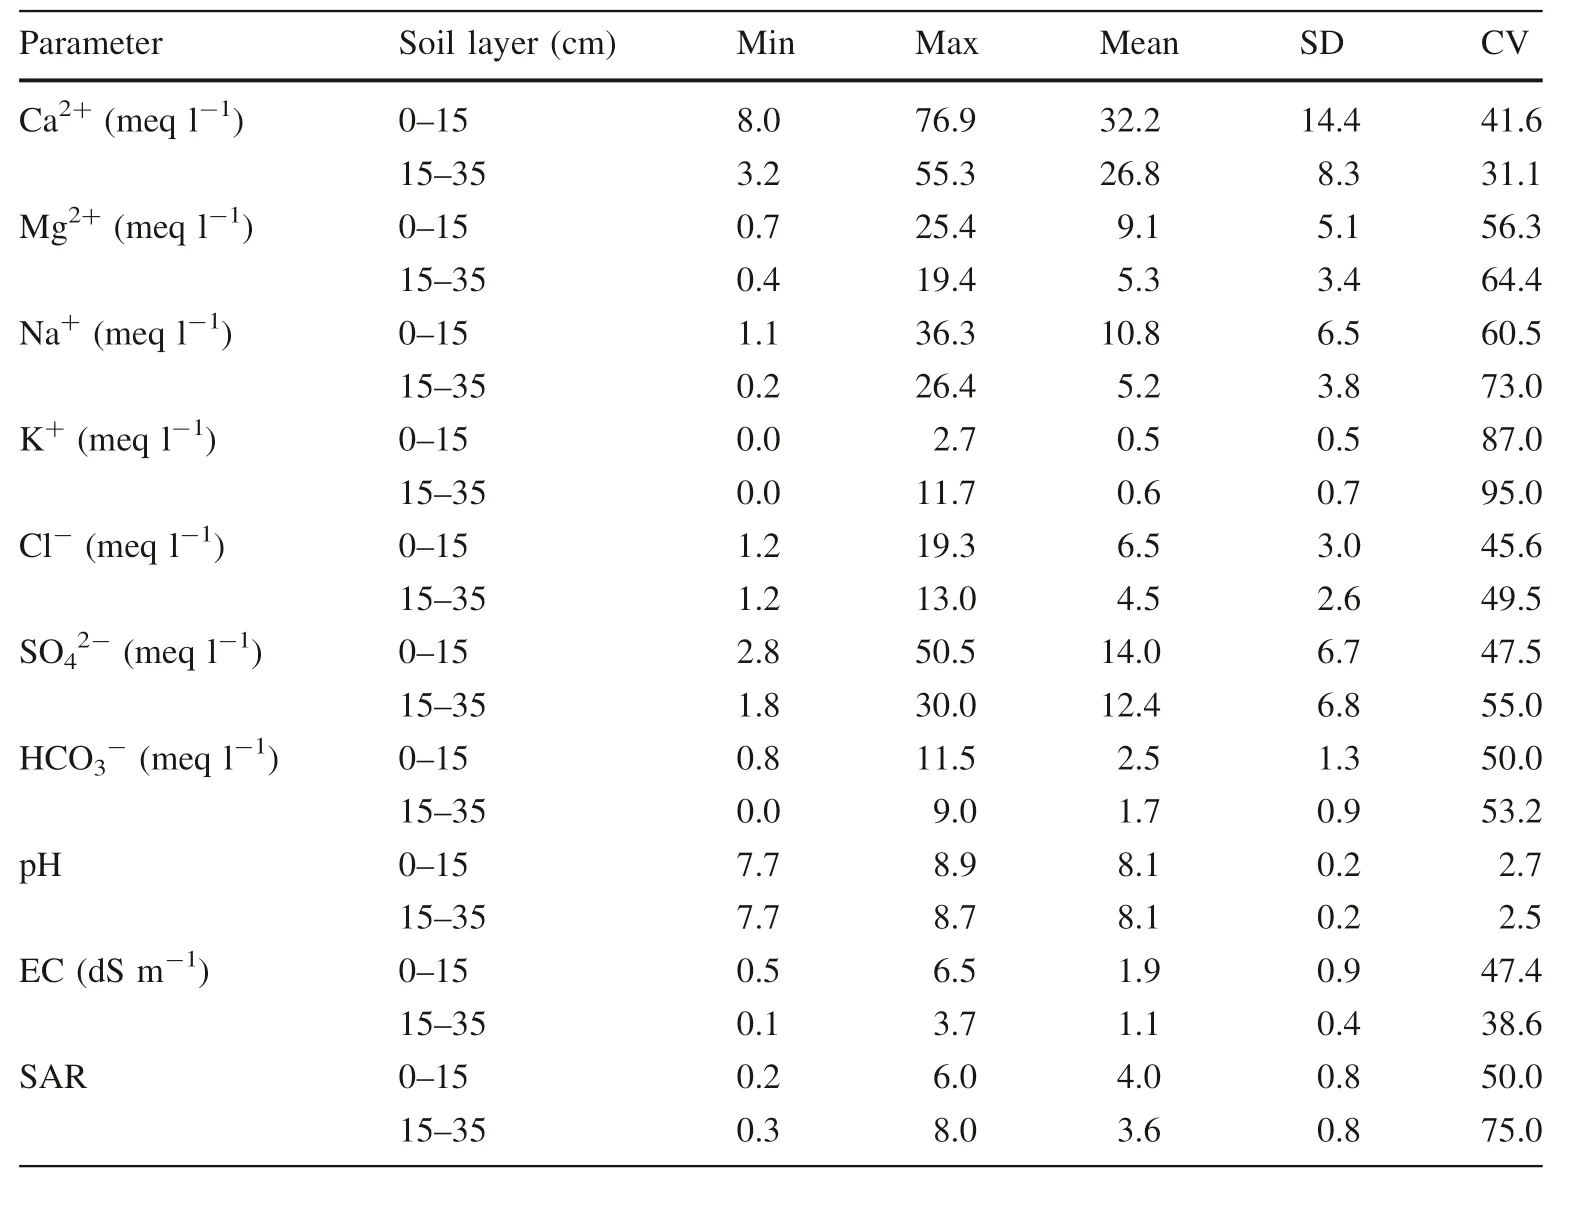
Table 1 Statistical summary of the analyzed parameters
4.2 Multivariate analysis of topsoil properties
Table 2 shows the Pearson’s correlation coefficient among the 11 parameters analyzed in the topsoil.EC,a proxy of salinity,was significantly correlated(p<0.05)to the calcium(r=0.69)and sulfate(r=0.74)contents.Also,the sodium content showed a high correlation with both magnesium(r=0.50)and calcium(r=0.63).On the other hand,bicarbonate and potassium showed a low correlation with almost all the variables.It is noticeable that 53 out of 55 possible combinations resulted in positive.
Table 3 shows the load values for each parameter in the 4 components selected(Eigenvalue>1.0).They explained about 73 % of the total variance.The first component(PC1)explained 36.2 % of the total variance,and all the parameters had a negative load.The most correlated variables with this component are EC,Ca2+,and Na+.Thus,PC1 can substantially explain salinization and sodification processes.PC2 describes 17.0 % of the data variability,and Nitrate and sulfate showed the highest loads.Therefore,this component could be considered to explain soil degradation processes.The last two components could explain alkalinization(pH has the highest load)andanthropogenic activities(potassium from soil fertilization has the highest load),respectively.Chemical composition of soil salinity is generally controlled by inputs,through water/rock interaction and human activities.Variation in soil EC may be related to the parent material,to the land use,and also to the pollution.It is also well known that P,NO3-,SO4-,Na+,and Cl-ions are mostly derived from agricultural fertilizers,animal waste,and municipal sewage(Jalali 2007).

Table 2 Pearson’s correlation coefficient between the analyzed parameters in the topsoil
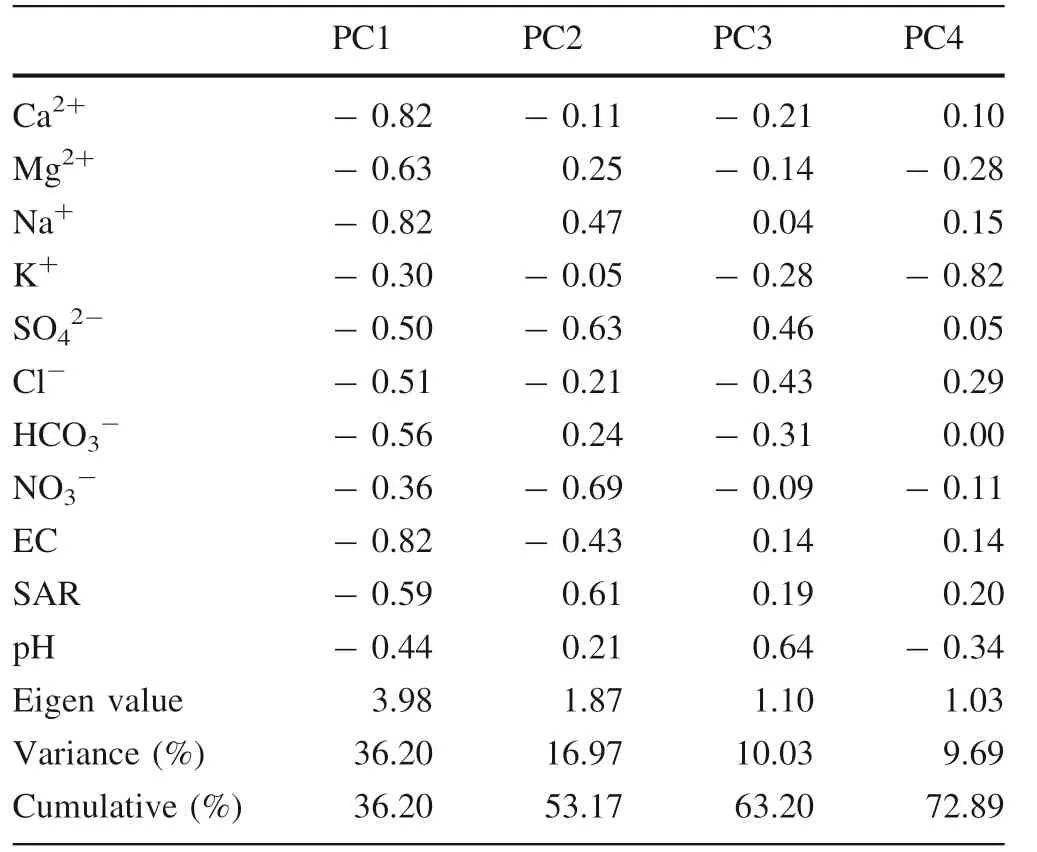
Table 3 Load values of each one of the parameters for each principal component
4.3 Multivariate analysis of subsoil properties
The correlation coefficients among the 11 parameters in the subsoil samples are shown in Table 4.The highest correlations were observed between sodium and SAR(r=0.92),and between EC and sulfate(r=0.75).Other interesting values were those observed between potassium and nitrate(r=0.57)and between EC and chloride(r=0.53).Finally,bicarbonate showed a weak correlation with the rest of the variables,being 0.12(with sodium)and-0.17(with chloride)the highest values.
About 68 % of the total variance was explained by 4 components(Table 5).The first one explained 27.5 % of the data variability,with higher loads for SAR(-0.80),sodium(-0.79),and EC(0.78).Thus,this axis could be associated with the sodification process.PC2 explained 20.5 %of the total variance,with negative loads for nitrate(-0.71)and potassium(-0.69)and could be related to the soil pollution-likely linked to fertilizer application.PC3 is related to the alkalinization process,with a negative load of-0.83 for bicarbonate.
4.4 Chemical facies
Figure 4 shows the distribution of soil samples on the Piper diagram.In the anion triangle,a dominance of sulfate can be observed,except few samples in which chloride was dominant.The cation triangle shows a strong prevalence of calcium.Different facies were observed in the two depth intervals:topsoil has a chloride and sulfate,calcium and magnesic facies.Subsoil showed a dominant hyper sulfatecalcic facies,due to the dissolution of carbonate rocks.The distribution of the main ions(Ca2+,SO42-)is highly influenced by the lithology of the region and is due also to anthropogenic sources such as irrigation water quality and uncontrolled fertilization.The most soluble rocks such as anhydrite,gypsum,and halite represent the main source of Ca2+,Mg2+,Na+,K+CO3-2,SO4-,and Cl-in the soil.However,the distribution of the main elements depends on the distance from reliefs,the lithology,the groundwater flow direction,and from other sources of contamination(Pazand et al.2018).The increase in salinity associated with sodium chloride and sodium sulfate facies can be a consequence of the combined action of different mechanisms,such as concentration by evaporation or contact with salt water.
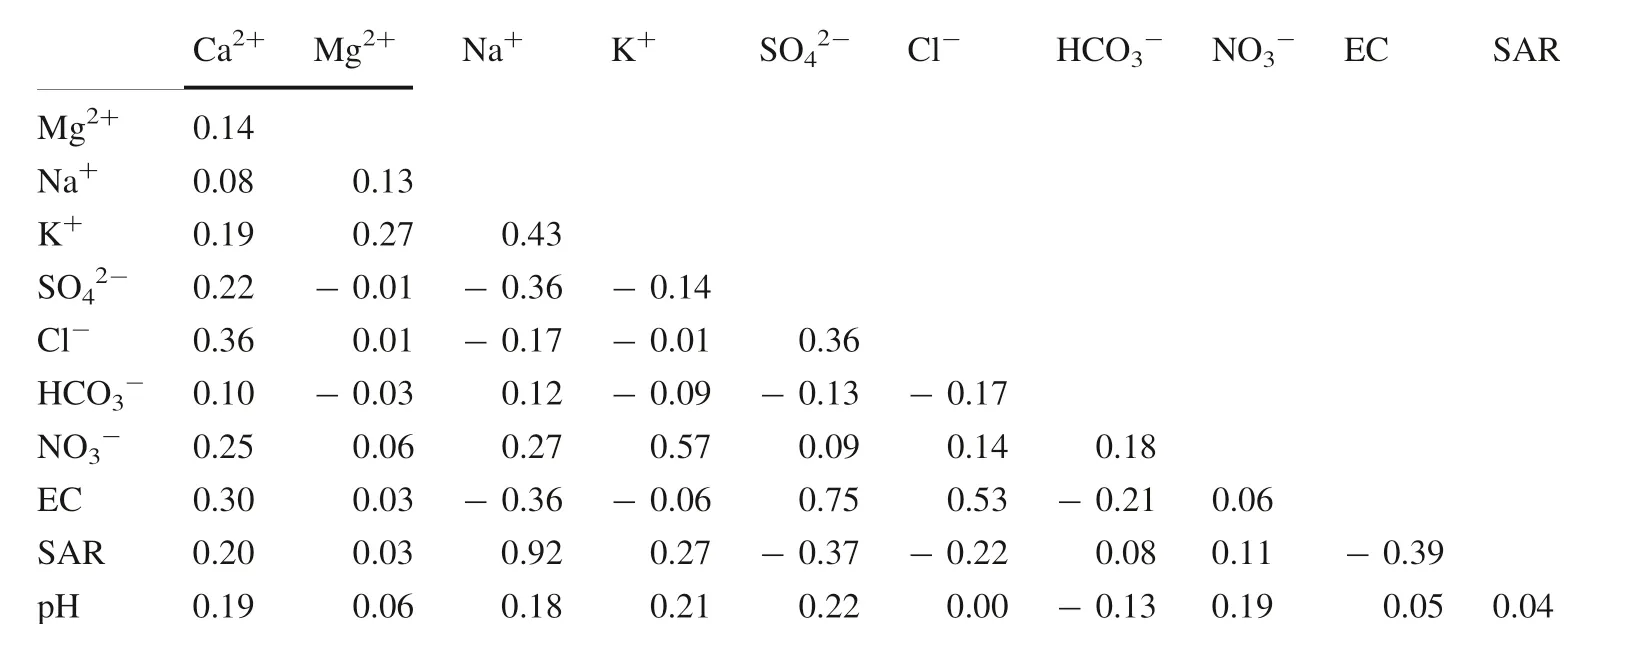
Table 4 Pearson’s correlation coefficient between the analyzed parameters in the subsoil

Table 5 Load values of each one of the parameters for each principal component
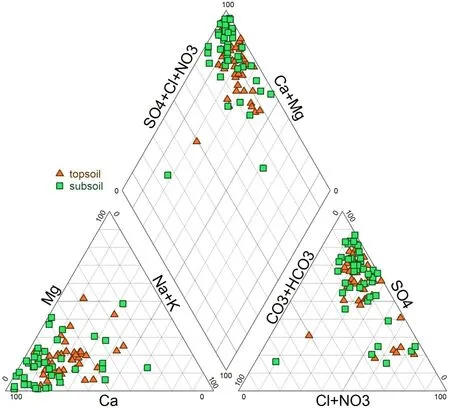
Fig.4 Distribution of the samples on the Piper diagram
SAR values ranged from 0.2 to 6.0(mean value:4.0)in topsoil and from 0.3 to 8.0(mean value:3.6)in the subsoil.Figure 5 shows the Riverside diagram,i.e.the combined effect between EC and SAR.Most of topsoil and subsoil samples belong to the classes C3S1 and C4S1,showing a high risk of salinity and a low risk of alkalinity.The class C4S2(topsoil:16.7 %,subsoil:7.0 %)indicates a very high risk of salinity and medium risk of alkalinity.Only a few samples from topsoil belong to the class C5S2(very high salinity and medium alkalinity).These last can be considered as degraded soil,unsuitable for crop production,and even posing problems of structural stability.The same water management for irrigation can suggest their uselessness for agriculture in the medium and long term.

Fig.5 Distribution of the samples on the Riverside diagram
4.5 Residual alkalinity and salinization pathways
The concept of residual alkalinity(RA)is referred to as the salinity ratio for the precipitation of minerals.Since calcite(CaCO3)is the first mineral to crystallize when the concentration increases,we have determined the residual alkalinity of calcite(RAc).This parameter can be used to predict whether the solution evolves into a neutral salt or carbonate state.
Figure 6 shows that the solution contains more calcium than alkalinity,i.e.,during the concentration process(measured by the concentration factor,CF)and the crystallization of calcite,the solution decreases in alkalinity and increases in calcium.Therefore,there is no risk of sodification because calcium is the dominant cation.This condition is called‘‘the neutral way’’,with sulfate dominant that can cause the degradation of soil structure.Moreover,the most diluted solutions showed slightly negative RAc values,while the most concentrated ones showed strongly negative values.
Figure 7 shows the values of the generalized residual alkalinity(RAg),with respect to the concentration factor of the solutions.The tendency is quite similar to RAc,confirming both the soil salinization path in both layers,and the role played by the gypsum dissolution.The increase of Ca2+concentration due to gypsum dissolution(Eq.2)causes calcite to precipitate(Eq.3)(Mohallel et al.2016).

Fig.6 Evolution of the residual alkaline calcite of the soil samples

Fig.7 Evolution of the generalized residual alkaline of the soil samples

Different sources explain the prevalence of gypsum in soils,occurring by:in situ alterations from gypsum parent material present in arid regions;evaporation of mineralized groundwater with sulfate facies;dissolution of carbonates during the concentration of the soil solution;salts from the fertilizers brought to the soil.
Chloride was used as a hydrochemical tracer,being an abundant soluble element typical of evaporitic milieus.Figure 6 shows the diagrams of the concentration of the main cations and anions for topsoil(Fig.8a)and subsoil(Fig.8b).Calcium and sulfate had a higher increase than chloride in the topsoil,but they became stable in the subsoil.
4.6 Saturation index
Figure 9 shows that the values of the saturation index of the soil samples both in topsoil and in the subsoil are almost the same,for the evolution of minerals such as calcite,dolomite,aragonite,anhydrite,halite,and gypsum.The simulation was performed using the thermodynamic software PHREEQC.

Fig.8 Concentration diagrams by depth intervals of soil samples;Depth 0-15(a);depth 15-35(b)
Most of the samples were oversaturated in carbonate minerals(aragonite,calcite,and dolomite)and undersaturated in evaporitic minerals(anhydrite,gypsum,and halite).Thus,carbonate minerals are likely to precipitate,while sulfate minerals are likely to dissolve.The dissolution of gypsum,mainly influenced by the geology of the region and by the groundwater used in irrigation,could explain the enrichment in sulfate and calcium.The prevalence of gypsum in soils occurs by in situ alterations from gypsum parent material in arid regions,by the evaporation of mineralized groundwater with sulfate facies,and by the dissolution of carbonates minerals during the concentration of the soil solution.

Fig.9 Values of the saturation index of the main minerals;depth 0-15(a);depth 15-35(b)
The excess of sulfate can derive also from anthropogenic activities,indicating pollution from land-use practices,revealed by the presence of the biochemically related elements SO42-,P,NO3-and K+.These represent the principal nutrient for plants,widespread in the North of the area(Hamed et al.2013b).
The evaporitic minerals are still in a state of undersaturation.Thus,chemical elements such as chloride and sulfate appear in the solution with high concentrations,as confirmed by the dominant chemical facies.Since halite is largely undersaturated in all the samples(range:-5.41 to-7.59),it tends to dissolve,contributing to an increase in mineralization.Chemical properties of soil in the El Ghrous region are controlled both by natural geochemical processes and by anthropogenic activities.
4.7 Regression models
Three different regression equations were obtained from the analysis of our dataset:(a)a parabolic equation,in which the saturation index of gypsum is the independent variable,(b)a multiple linear regression equation,obtained by using some cations as independent variables,and(c)a multiple linear regression equation,obtained by using some anions as independent variables.These equations aimed at estimating the salinity through the values of EC(dependent variable).Cations and anions used in these equations are derived from the previous multivariate PCA analysis.
Most of the samples were undersaturated for sulfur minerals(gypsum).This suggests that the dissolution of gypsum can be the source of calcium and sulfate in these soils,in agreement with the prevalence of calcium sulfate facies in the Piper diagram.Figure 10 shows a scatterplot of the saturation index of gypsum vs EC,together with a parabolic regression equation with high values of R2(0.75 in topsoil and 0.67 in the subsoil,respectively).
Multiple linear regression is the most widely used and best-known modeling method.Its general objective is to better understand the relationship between several independent variables or predictors and a dependent variable(Ouedraogo et al.2019).The relationship between EC,from one hand,and calcium(Ca2+),pH,potassium(K+),chlorine(Cl-),magnesium(Mg+),sodium(Na+),sulfate(SO42-),from the other,was investigated to find the best model to predict the EC for each soil layer.
Equation 4 was defined to estimate salinity in the topsoil using cations,and Eq.5 was defined to estimate salinity in the subsoil using anions.

In Table 6 the descriptive statistics of the parameters used for the validation of the above equations are reported.Figure 11 illustrates the best fit between observed and predicted values.
The difference between cations and anions content in the two soil layers is mainly due to the irrigation techniques adopted.In this area,farmers use two techniques:(1)drip irrigation,and(2)submerged irrigation.Drip irrigation is widespread in the northern area,where plastic greenhouse cropping is dominant.Here topsoil is saltier than subsoil since water is applied only at the surface.In arid regions,the rising water table and the climatic conditions enhancing evaporation favor the migration of salts to the upper surface layer.Moreover,in this part of the region fertilization is highly applied,since farmers produce mainly off-season crops.For this sake,the cost is always kept high.Submerged irrigation is widespread in the central and southern part of the region,for date palm crops.This technique,due to the high amount of water applied,fosters the leachingofsaltstowards the deepest layers(over 35 cm depth).Besides,the crust present on the soil surface participates in increasing the salt load in these layers during the irrigation.Over-pumping of the groundwater,the exploitation of saline aquifers,and the lack of drainage facilities are considered as important anthropogenic driving forces for salinity(Emadodin et al.2012).

Fig.10 Relationship between SI(gypsum)and EC;depth 0-15(a);depth 15-35(b)

Table 6 Values of the parameters used in the validation of the equations

Fig.11 The fit of the line between the observed and predicted values(EC):depth 0-15(a);depth 15-35(b)
4.8 Soil salinity mapping
Mapping EC from the proposed equations by means of the IDW interpolation method was performed,aiming at locating areas with high salinization risk.It can be seen that the class EC>1 dS m-1is largely dominant in both soil layers in the study area.This class is considered saline according to Durand’s classification(1983),thus these soils should be used with great care as the presence of salts has an effect on the plants and the quality of soil and groundwater.The most favorable class in this area is the one with EC<1 dS m-1,observed only as spots in a low percentage of the surface area.Soil salinity is affected by precipitation,evaporation,water table,and topography in natural conditions(Hamed et al.2014a;Xu et al.2014;Yin et al.2016).Moreover,the climatic conditions in southern Algeria,where evapotranspiration is very high,the poor quality of groundwater,and inappropriate human agricultural activities have led to the risk of secondary soil salinization.
The obtained maps should be useful to improve land management,e.g.through the installation of efficient drainage systems,or choosing crop species more adapted to salinity in those areas with serious problems of salinity.Figure 12 shows both the maps for topsoil and subsoil.
Figure 13 illustrates the worrying situation of the irrigated soils in the study area,due to the nature of the soil,to the unmanaged irrigation,and the uncontrolled fertilization.
5 Discussion
It is commonly accepted that soils from arid(and semiarid)areas,where irrigation agriculture is practiced,undergo a significant salinization risk evidenced firstly by high pH values.In El Ghrous most pH values are within the limits that Aubert(1983)proposed as thresholds for land degradation(pH:8.0-9.0).Secondly,EC values represent the best indicator of the effects of salinization.Our EC values showed great variability,indicating spatial heterogeneity of such effects in the region.However,75 %of our samples overcame the threshold of 1.0 dS m-1proposed by Durand(1983)as a starting point for salinization,from which it begins to be a problem for land management.
The prevalent cation and anion of our soils were calcium and sulfate,respectively.This could be explained byprecipitation and dissolution processes of calcaric and evaporitic minerals such as calcite,gypsum,and anhydrite(Hamed 2013;Lotfi et al.2018).A significant correlation between sodium and chloride in the subsoil samples was also highlighted.The concentration of these two ions in subsoil suggests that the dissolution of halite should be the possible source(Askri and Al-Shanfari 2017).Our findings suggest also that other processes are occurring along with halite dissolution.Sodium in excess could be due to exchange reactions with clay minerals,in which sodium ions are released and replaced by calcium ions(Ncibi et al.2020).In El Ghrous the modification in soil chemical composition is mainly controlled by climate,soil characteristics,and hydro-geochemical processes such as dissolution,precipitation,ionic exchange,and anthropogenic activities(Apodaca et al.2007).

Fig.12 Maps of soil salinity obtained from both equations:(up)topsoil(Eq.4)and(down)subsoil(Eq.5)

Fig.13 Photos of the catastrophic situation of the irrigated soils in El Ghrous
Calcium in excess over sulfate ions may be related to the cation exchange(Ca2+substituting Na+)combined with the dissolution of gypsum(Bouteraa et al.2019;Lotfi et al.2018).The dissolution of gypsum is influenced by the saturation or oversaturation of calcite.In addition,all samples showed bicarbonate deficiency compared to calcium and magnesium.This deficiency is probably due to the saturation of dolomite.According to Risacher and Fritz(2009),calcium and bicarbonate cannot increase simultaneously.
The alkalinity is constant or decreasing both in topsoil and subsoil,together with the lower concentration of calcium.This confirms the hypothesis of calcite precipitation with negative residual alkalinity(Djamaïet al.2011).Potassium is also constant since it is well-controlled by clay minerals(Wang et al.2004).The concentration of sodium in the subsoil can be a consequence of halite precipitation.Magnesium precipitated in some subsoil samples,where the molarity was lower than the molarity of bicarbonate and evolved according to its concentration factor in the topsoil.This can be explained by the removal of magnesium from the solution by precipitation as dolomite(Bradaïand Douaoui 2013).
The saturation grade of all soil samples analyzed by the model PHREEQC shows that carbonate minerals are susceptible to precipitation,while sulfate minerals with a low saturation grade are prone to be dissolved.The main processes controlling the chemical composition of dissolved salts in these soils are the dissolution of halite,gypsum,and anhydrite,as well as the precipitation of calcite,aragonite,and dolomite linked to ionic exchanges among them and with clay minerals(Lotfi et al.2018).Precipitation/dissolution of minerals can occur when the solution is concentrated by evaporation,changing its chemical composition.The most frequently formed minerals are calcite,magnesic minerals,and gypsum(Al-Droubi 1976).The evolution of these elements influences the nature of the geochemical pathway within the solution-neutral or alkaline(Cheverry 1974).
In arid regions,most of the soils show accumulation of differently soluble salts(limestone,gypsum,sodium chloride,etc.).Gypsum(CaSO4)is the most widespread salt in the soils of the study area.Gypsum is present in the parent materials,and in the sulfate water of two aquifers exploited in this region.In most cases,gypsum is associated with other salts(Mostephaoui et al.2013),and its origin in this region is essentially hydrogeological.
The study area is characterized by an arid climate and by soils with surface crusts composed by lime,gypsum and other salts.After irrigation,the precipitation of calcite and the dissolution of gypsum could influence soil physical properties through the cementation of particles in the form of gypsum-calcareous accumulation.This is particularly recurring in areas where the groundwater level is shallower(ca.20 m),in which farmers usually use this water for irrigation(Marlet and Job 2006).This salinity pathway is the neutral saline path with a dominance of sulfates,and being likely to evolve towards small calcium concentrations,presents a higher probability of soil structure degradation(Bourrie 2014).
The high solubility of gypsum creates a high osmotic pressure,reducing water extraction by plants.However,high EC values and the soil solution saturated with calcium cause the fixation of trace elements(Fe,Mn,Cu,and Zn)in less assimilable forms(FAO 1985).The presence of a hard or impermeable layer hinders root and water penetration.The dissolution of gypsum and its leaching during irrigation lead in some soils to an increase in plasticity and to an alteration of their cohesion and structure.The incorporation of organic matter,deep tillage,and careful management of irrigation water play an important role in improving the profile of gypsum-bearing soils(FAO 1985).
In these areas,sustainability can be only guaranteed if we understand the mechanisms of the spatial variability of the salinity at different scales.In this framework,one of the main problems that scientists must face is the determination of EC in the maximum possible number of points.The analytical method which uses the saturated paste is expensive and time-consuming,and sometimes also sampling in all the desired points is not easy(e.g.lack of permission from the field owner).The rationale we propose in this study could alleviate such research problems.
Finally,another remarkable question is the socio-economic sustainability of these areas:the lack of industrial activities and investments on tourism,along with a high rate of unemployment,have led to a considerable expansion of irrigated agriculture.Thus,soil and water quality monitoring seem to be crucial for the survival of many inhabitants,not only in El Ghrous or Algeria but also in other similar environments-in Argentina,India,Iran,Egypt.
6 Conclusions
Soil salinization is by far the most important land degradation process in arid areas,particularly if they are being irrigated with saline groundwater.In El Ghrous the salinity of topsoil was indicated by the concentration of cations,and the salinity of subsoil by the concentration of anions(calcium,sulfate,and chloride are the most common ions).Solutions with prevalent carbonate minerals are likely to trigger salt precipitation,while solutions with prevalent evaporitic minerals the dissolution is more probable.The neutral salinity pathway was caused by the concentration and crystallization of calcite.The equations and maps obtained showed reliable values.
These equations could be a good tool for farmers,stakeholders,decision-makers,and scientists since they allow them to save time and money during field and laboratory work.From our findings,we can suggest installing adequate drainage networks to avoid contact between freshwater and salty groundwater.Since it,unfortunately,looks like an unstoppable phenomenon,farmers should also choose cropping species more adapted to salinity.
AcknowledgementsThe authors thank Narimen Bouzidi,Saliha Benaoun,Tarek Othman,Boudibi Samir,Toufik Aidat,Sarah Badache,Kamila Ghouali,and Samira Kendri for their help in the field and laboratory works.The first author would like to thank the Algerian Ministry of Science and High Education for the grant to make a predoctoral stay within the staff of the GeoEnvironmental Research Group of the University of Extremadura,Spain.
Compliance with ethical standards
Conflict of interestOn behalf of all authors,the corresponding author states that there is no conflict of interest.
杂志排行
Acta Geochimica的其它文章
- Effect of crustal porosity on lunar magma ocean solidification
- Gold anomaly ranking based on stream sediment geochemistry in the Fariman-Kashmar axis,NE Iran
- Petrographic and geochemical characterization of weathered materials developed on BIF from the Mamelles iron ore deposit in the Nyong unit,South-West Cameroon
- Equilibrium mercury and lead isotope fractionation caused by nuclear volume effects in crystals
- Estimation of evaporation losses based on stable isotopes of stream water in a mountain watershed
- Geochemical significance of tricyclic and tetracyclic terpanes in source rock extracts from the Offshore Niger Delta Basin,Nigeria
