Gold anomaly ranking based on stream sediment geochemistry in the Fariman-Kashmar axis,NE Iran
2021-06-21HassanAzmiParvizMoarefvandAbbasMaghsoudi
Hassan Azmi·Parviz Moarefvand·Abbas Maghsoudi
Abstract One of the essential tasks accelerate the decision-making process in mineral exploration projects is ranking anomalous areas.In this study,we used fourteen geologic maps(at scale 1:100,000)in areas where systematic geochemical explorations were conducted in the Fariman-Kashmar axis in northeast Iran to conduct the anomaly ranking.On all these maps,samples were consistently prepared to be analyzed through statistical and geostatistical methods.At first,anomaly separation was carried out by fractal methods that resulted in the detection of 308 anomalous samples in 128 areas.These samples were classified into three groups of first,second,and thirdorder anomalies,whose number of anomalous samples were calculated based on this ranking technique.Three factors,including the average concentration of each anomaly,its surface area,and the number of its samples,were used to rank the areas.According to this technique,the maximum anomaly score obtained was 172 for the Taknar area,and the minimum score was 3 for several areas.To validate the ranking results,some exploration operations were carried out in some of these anomalous areas in which mining operations started later.Several significant gold anomalous areas were introduced,which is considered an important result of this study.
Keywords Anomaly ranking·Fractal model·Exploration decision·Gold exploration·Geochemistry exploration
1 Introduction
About half of the global mining investments in the late 20th century made on copper and gold(Hassani Pak 1999).This explains why the exploration of gold resources has particularly thrived in recent years across the world.Iran,due to its specific location and geological structure,is endowed with mineral resources.The country has also made extensive investments in the copper and gold mining sector to explore gold potentials.Geochemical exploration,which is conducted based on stream sediments and heavy mineral sampling,is one of the main methods for gold anomaly exploration.The obtained data analyses and the interpretations following geochemical explorations can help investors and explorers choose appropriate regions for more detailed exploration projects.
This study attempts to facilitate gold exploration techniques by providing a new perspective on anomaly ranking.Therefore,the anomalies should be first separated and then classified.The distribution of gold data is abnormal and highly skewed.Therefore,various methods are used for gold anomaly separation,among which the fractal methods are used as the suitable separation approach for gold anomaly separation(Ghezelbash et al.2020).
Fractal modeling methods are extensively used in various branches of Earth sciences and mineral exploration projects.Different fractal modeling methods have been introduced for geochemical data processing,including area-concentration,concentration-distance,concentrationvolume,and concentration-number(Cheng et al.1994;Rafiee 2005;Deng et al.2010;Afzal et al.2011,2013,2017;Afzal 2014;Daya and Hosseininasab 2019;Ghezelbash et al.2019a,b,Mao et al.2014).
In the present study,we used the concentration-number fractal method,introduce by Hassanpour and Afzal(2013),to separate anomalous populations from the background.The method is based on the following equation:

This equation means that the number of samples is equal to the concentration values higher than a given value.ρ is concentration and β is the fractal dimension.In this method,raw data are not normalized(Raei and Afzal 2014).
Anomaly ranking in geochemical stream sediment explorations is mostly carried out based on one factor,i.e.,the concentration of samples by using classical statistics(Hassani Pak 1999),or based on two factors such as the average concentration of samples and the surface area of anomalous zones(Jiangxi 1994a,b,c,d,1995a,b,c,d,e,f,g,h,i,j).In this research,we used three factors,including concentration,the number of samples in an anomalous area,and the order of anomaly.Combining these factors will increase the accuracy of results and improve making decisions about the outcome of explorations.The ranking in this study will be quantified and the prioritization will be made by using three factors,including the surface area,grades,and anomaly rankings.
2 Geology and the study area
The Khorasan Razavi province,located in northeastern Iran,includes certain sectors of two important structural zones of Iran,an extension of the Alborz range in the north and the Central Iran zone in the southern and central parts(Fig.1;Stocklin 1968a,b;Nabavi 1976;Agha-Nabati 2007).The Eastern Alborz Zone in KRP includes the Koppet Dagh and Binalood tectonic zones.As for the Koppet Dagh Zone,the main feature is the lack of magmatism throughout the development of this sedimentary basin,only in the southern boundary of which a Quaternary basaltic eruption has been reported.The Binalood Range,on the other hand,is surrounded by the rigid Turan Plate and the Central Iran Micro-continent with an approximate trend of NW-SE in the south of Mashhad.The zone extends between the northern areas of Sabzevar and Neyshaboor up to Mashhad,with igneous and metamorphic rock outcrops.
The study area,a part of the Central Iran zone,is mainly located in the Sabzevar zone,in which the following units are outcropped according to Lindgren et al.(1983)and Lindenberg and Jacopshagen(1983):
a.Volcano-pelagic series(Cretaceous)
b.Ophiolite-melanges located along the northern and southern plains of the zone(Cretaceous)
c.Rocks without ophiolite-melange in the central part of the zone(Eocene)
d.The Koohe Mish Sheeted diabase complex and its surrounding areas(Miocene)
The ophiolite-melange complex outcropping along the Taknar Fault(Southern boundary of the Sabzevar zone)can be separated into ultramafic or peridotite units.They are covered with pillow lavas of andesitic or andesiticbasaltic composition and covered with felsic and intermediate lavas of rhyolitic and rhyo-dacitic to andesitic composition.The evident feature in the volcanic rocks of the Sabzevar zone is their basic to acidic composition and its submarine nature,particularly for basic types.Therefore,this has resulted in the formation of pillow lavas above the ultramafic rocks in the complex with amygdaloidal andesitic and andesitic-basaltic members.They were also overlain by pelagic limestone and Radiolarian-bearing ferruginous-siliceous shale.Apparently,after a gap of volcanism(uncertain),a basic to acidic volcanic period with a composition ranging from basalt to andesite and from rhyolite to rhyo-dacite formed the basaltic prisms over pillow lavas in a relatively continental environment.These rocks were classified into the sub-alkaline and tholeiitic series.Another important point was that all felsic rocks were classified into calc-alkaline series,the pillow lavas were both of tholeiitic and calc-alkaline series.
The Upper Cretaceous plutonic suites outcrop in the Sabzevar zone,whose granitoid units are a combination of monzonite,quartz-monzonite,and granite.These rocks possess low potassium contents and are of tholeiitic series.Figure 4 shows the geologic map of the area(Rowshanravan et al.2007).
3 Data used
The database used in this study included the data from 11,504 samples of stream sediments analyzed for gold over fourteen 1:100,000 sheets in the Khorasan Razavi province(Jiangxi and GSI 1994a,b,c,d,1995a,b,c,d,e,f,g,h,i,j).
The Geological Survey of Iran has studied major parts of the Khorasan Razavi province through systematic geochemical exploration on a 1:100,000 scale.The reasons for choosing these 14 sheets are:
1.In these sheets,the sampling grid design,sample collection and analysis were carried out by the Chinese Jiangxi Company(1994-1995).
2.The most significant gold exploration zone of the Khorasan Razavi province is located within these sheets,on the north of the Darooneh Fault.

Fig.1 Major geological subdivisions of Iran and the location of the study area

Table 1 The name of 1:100,000 geologic maps and the number of samples taken from them

Table 2 The total statistical properties of samples for gold
The number of samples taken from each sheet is shown in Table 1,and the total number of stream sediment samples taken was 11,504 samples.Table 2 shows the overall statistical properties of samples for gold whose data show a highly skewed distribution.
4 Sampling method
Sampling was carried out from stream sediments within these sheets.In this sampling method,first,the sheet surface area was divided into 1.5 kmgrids,then,2 to 4 subsamples were taken from the streams available in the grid.Then,these sub-samples were mixed to form the final sample,which was attributed to the center of the cell.Figure 2 shows an example sheet section with the sampling grid.It is noteworthy that the total sample of each cell was analyzed for its gold content after the pretreatment process.
5 Data processing
5.1 Anomalies separation
The separation of anomalous zones from the background is one of the most important steps in early geochemical exploration stages.There are various methods for the separation of anomalies,including the use of raw data,enrichment index,standard deviation method,fractal methods,and so on.Some of these methods require normalization,but some do not.In this study,we used the concentration-number fractal method,since the element of interest was gold,whose data were not normally distributed.This method may somehow represent the concentration-area method because each sample covered an area of 1.5 km.
Regarding the fractal modeling(Fig.3),five main groups were identified based on the fractal diagram,as follow:
·Group 1(G1):background:grade values lower than 1.0 ppb.
·Group 2(G2):grade values between 1.0 and 1.5 ppb,called first threshold data
·Group 3(G3):grade values between 1.5 and 2.5 ppb,called second threshold data.
·Group 4(G4):grade values between 2.5 and 3.0 ppb,called third-grade anomaly data.
·Group 5(G5):grade values between 3.0 and 5.0 ppb,called second-grade anomaly data.
·Group 6(G6):grade values higher than 5.0 ppb,called first-grade anomaly data.
A set of 308 anomalous samples were classified through this processing approach.Accordingly,the anomalous community had three subgroups.In each sheet,several samples were classified as first to third order anomalies,as shown in Table 3.
Anomalous areas were identified based on the location of samples on each sheet(128 areas).The locations of anomalies over the studied sheets after anomaly separation are shown in Fig.4.Table 4 also shows the number of anomalous areas in each sheet whose locations are depicted in Fig.4.
5.2 Anomaly ranking
Anomaly ranking is an important task that enhances the results of exploration decision-making.The ranking process was carried out after the separation of gold anomalies.For ranking,the surface area of each anomaly and its samples was determined.The number of samples within each anomalous area,the grade values of abnormal samples in that area,the average Au grade,and the geological aspects of the area are highly important in anomaly ranking.We introduced three scores(S1,S2,and S3)to quantify these features and then compared them with each other.These scores include grade values(S1),the number of anomalous samples in each area(S2),and the order of each anomaly(S3),as follows.

Fig.2 A part of the sampling network showing the number and location of sub-samples
5.2.1 Grade score(S1)
The first score corresponds to the average grade of anomalous samples in each area which is normalized to the lowest grade in the anomalous area based on anomaly separation(Fig.3;G4)and is calculated using Eq.(2)

where Cj is the grade of sample j,and Nis the number of ith-order anomalous samples in each area.
5.2.2 Area score(S2)
This score is associated with the number of anomalous samples or the anomaly surface area,which means the more the anomaly surface area,the higher the score’s validity.Since each sample covered 1.5 kmof surface area,then we took into account the number of anomaly samples.In other words,this factor is normalized to the unit surface area and is calculated through Eq.(3):

5.2.3 Anomaly order score(S3)
In each anomalous zone,this score was associated with the number of anomalous samples situated in any anomaly order.Regarding the conducting processing,three anomaly groups were separated,including third-,second-and firstorder anomaly orders.Score 3 represents the order of anomaly in each area and is calculated using Eq.(4):

The final score(FS)is the sum of these three scores and is calculated through Eq.(5)

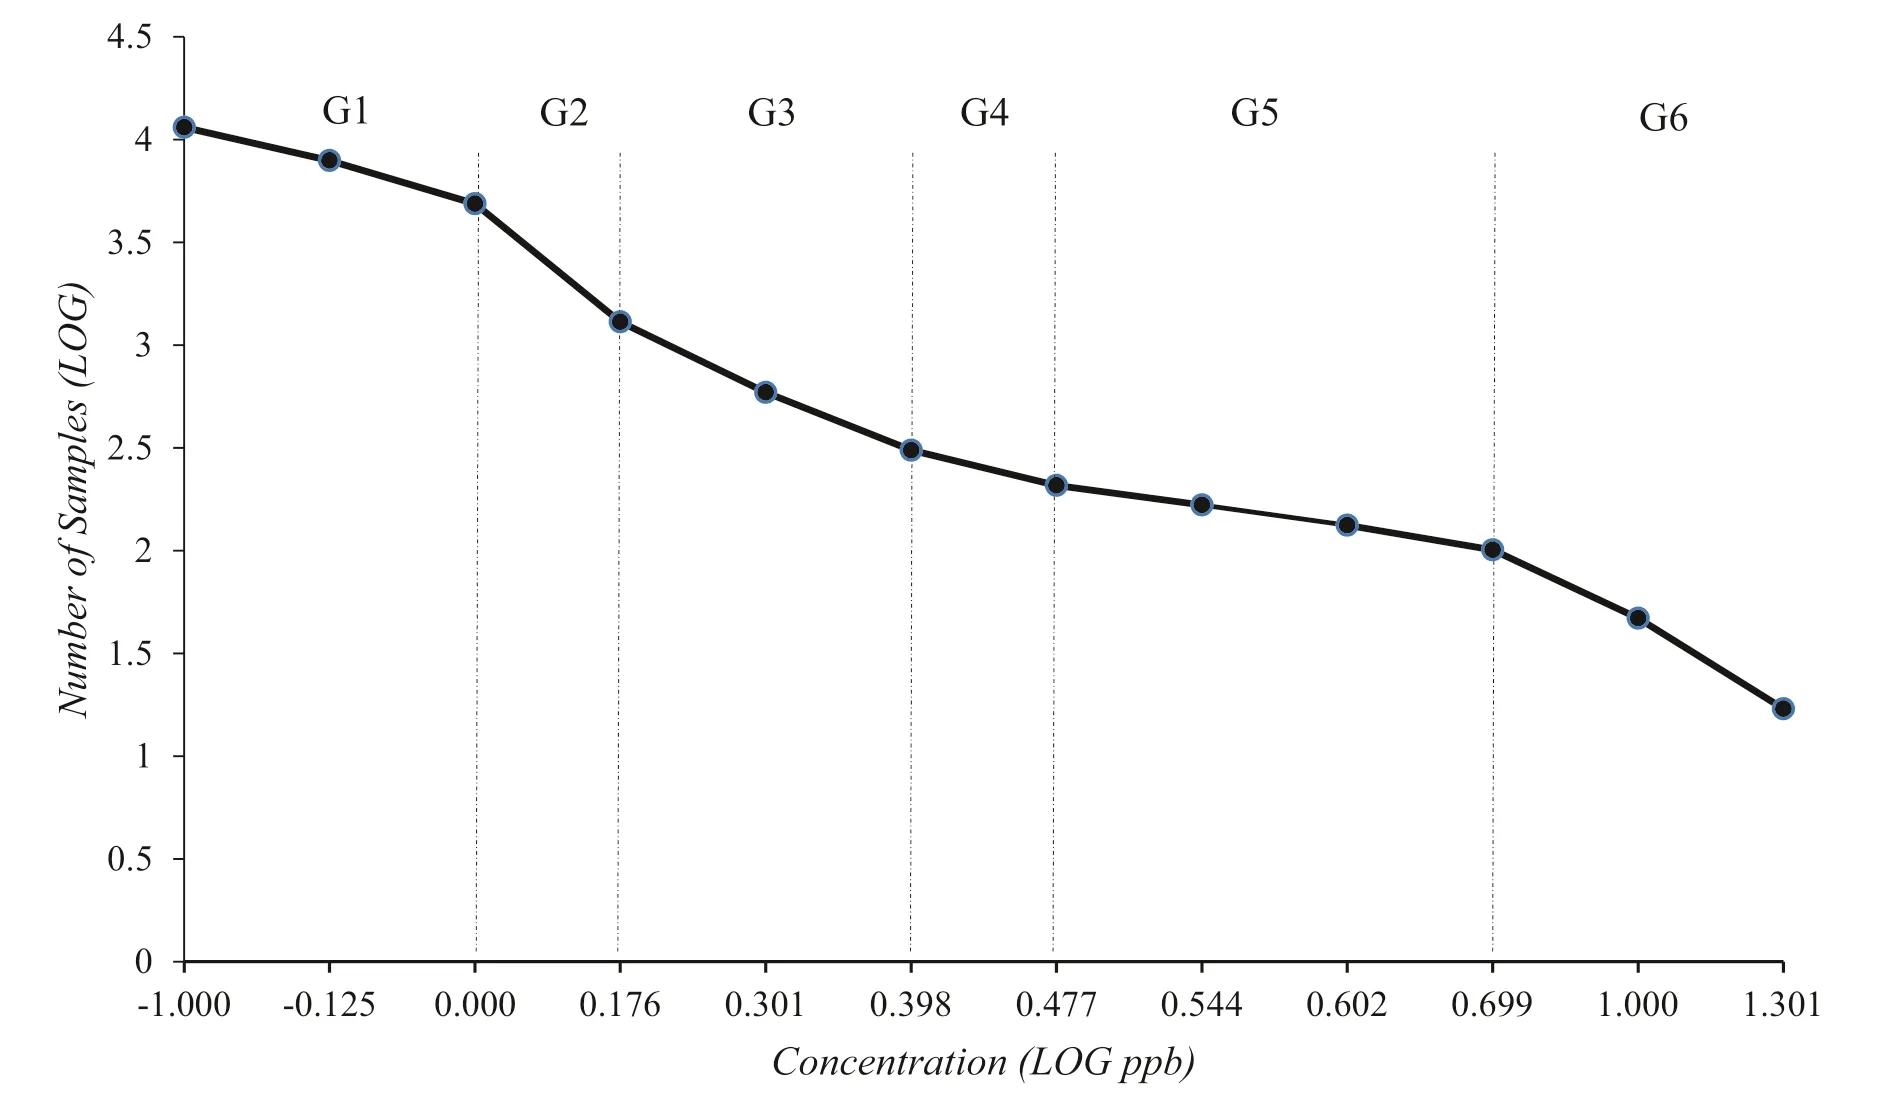
Fig.3 Anomaly separation based on the fractal method
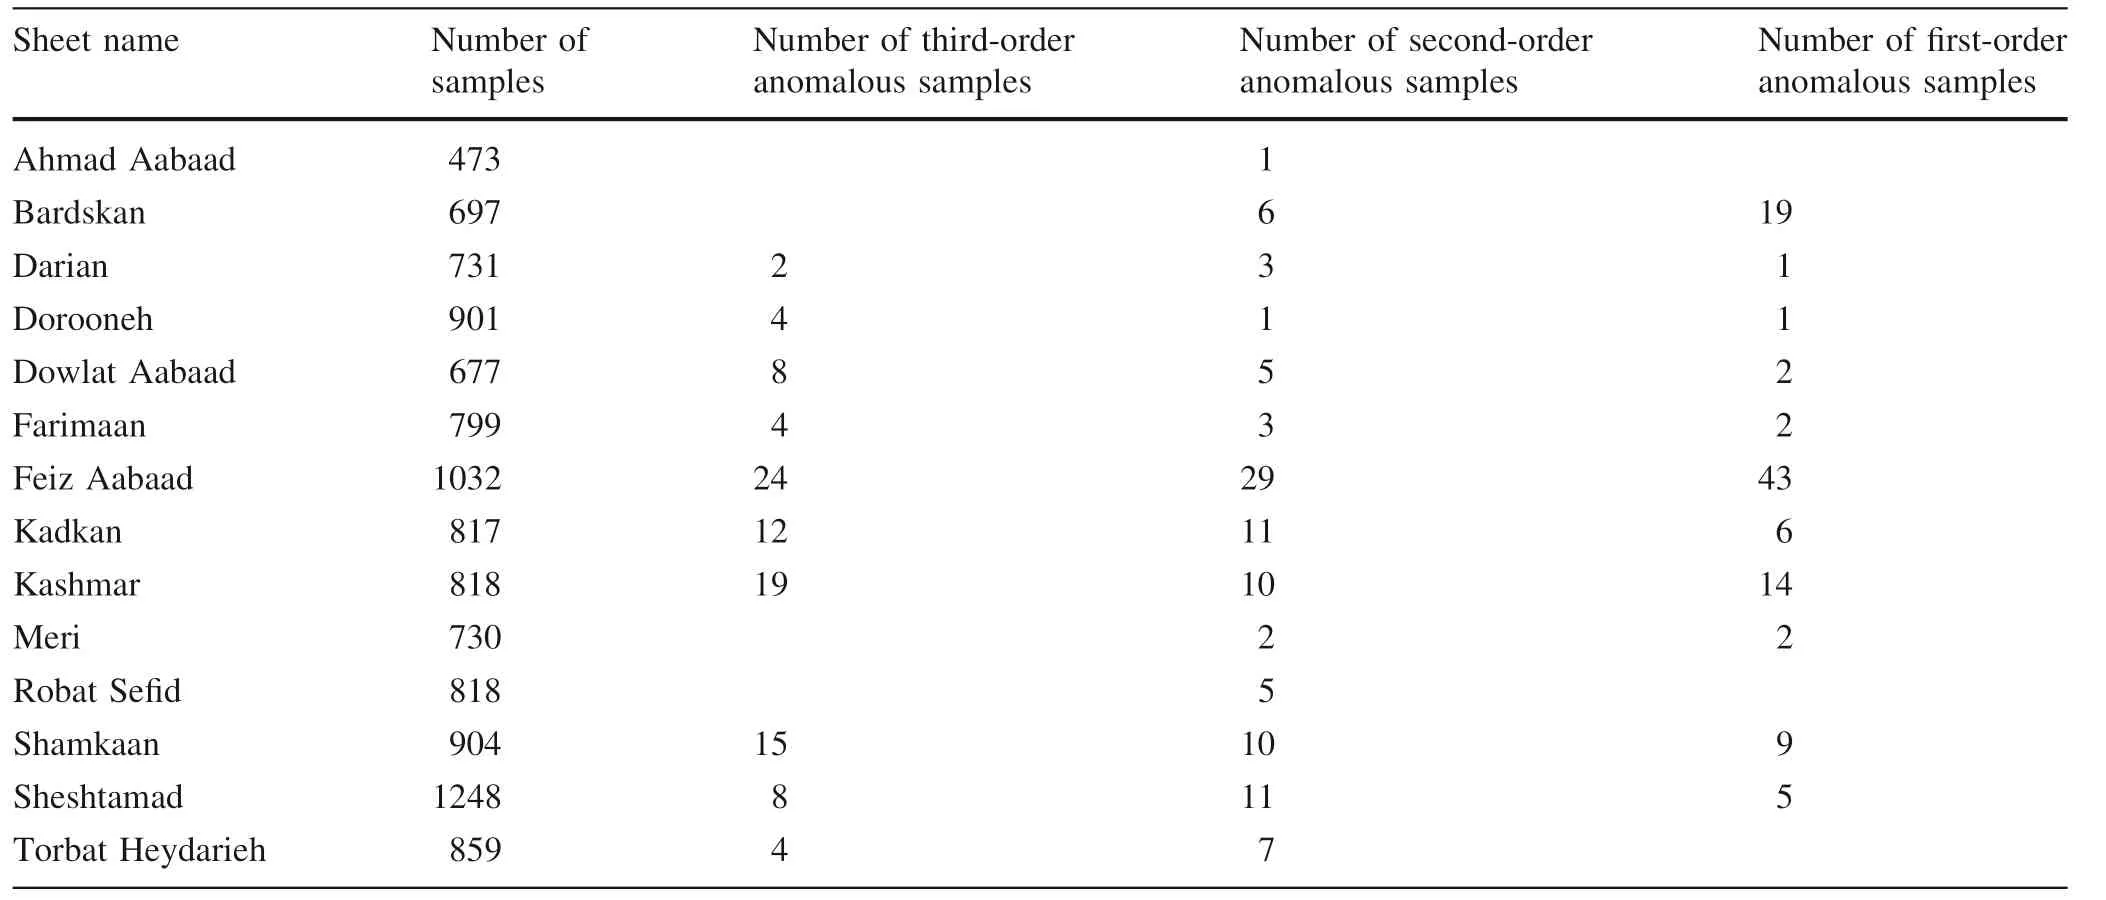
Table 3 Number of anomalous samples in each sheet
The final score is calculated for all anomalous areas.From the geological point of view,all anomalies were divided into two general groups:the anomalies associated with lithological outcrops(rock environments)and those associated with alluvial environments.The former enriched 110 anomalies(Table 5)while the second revealed the other 18 targets(Table 6).Tables 5 and 6 show the results of anomaly ranking,including the number of anomalies presented in Fig.4,the name of anomalies based on the geographical location,and the final score of anomalous zones.
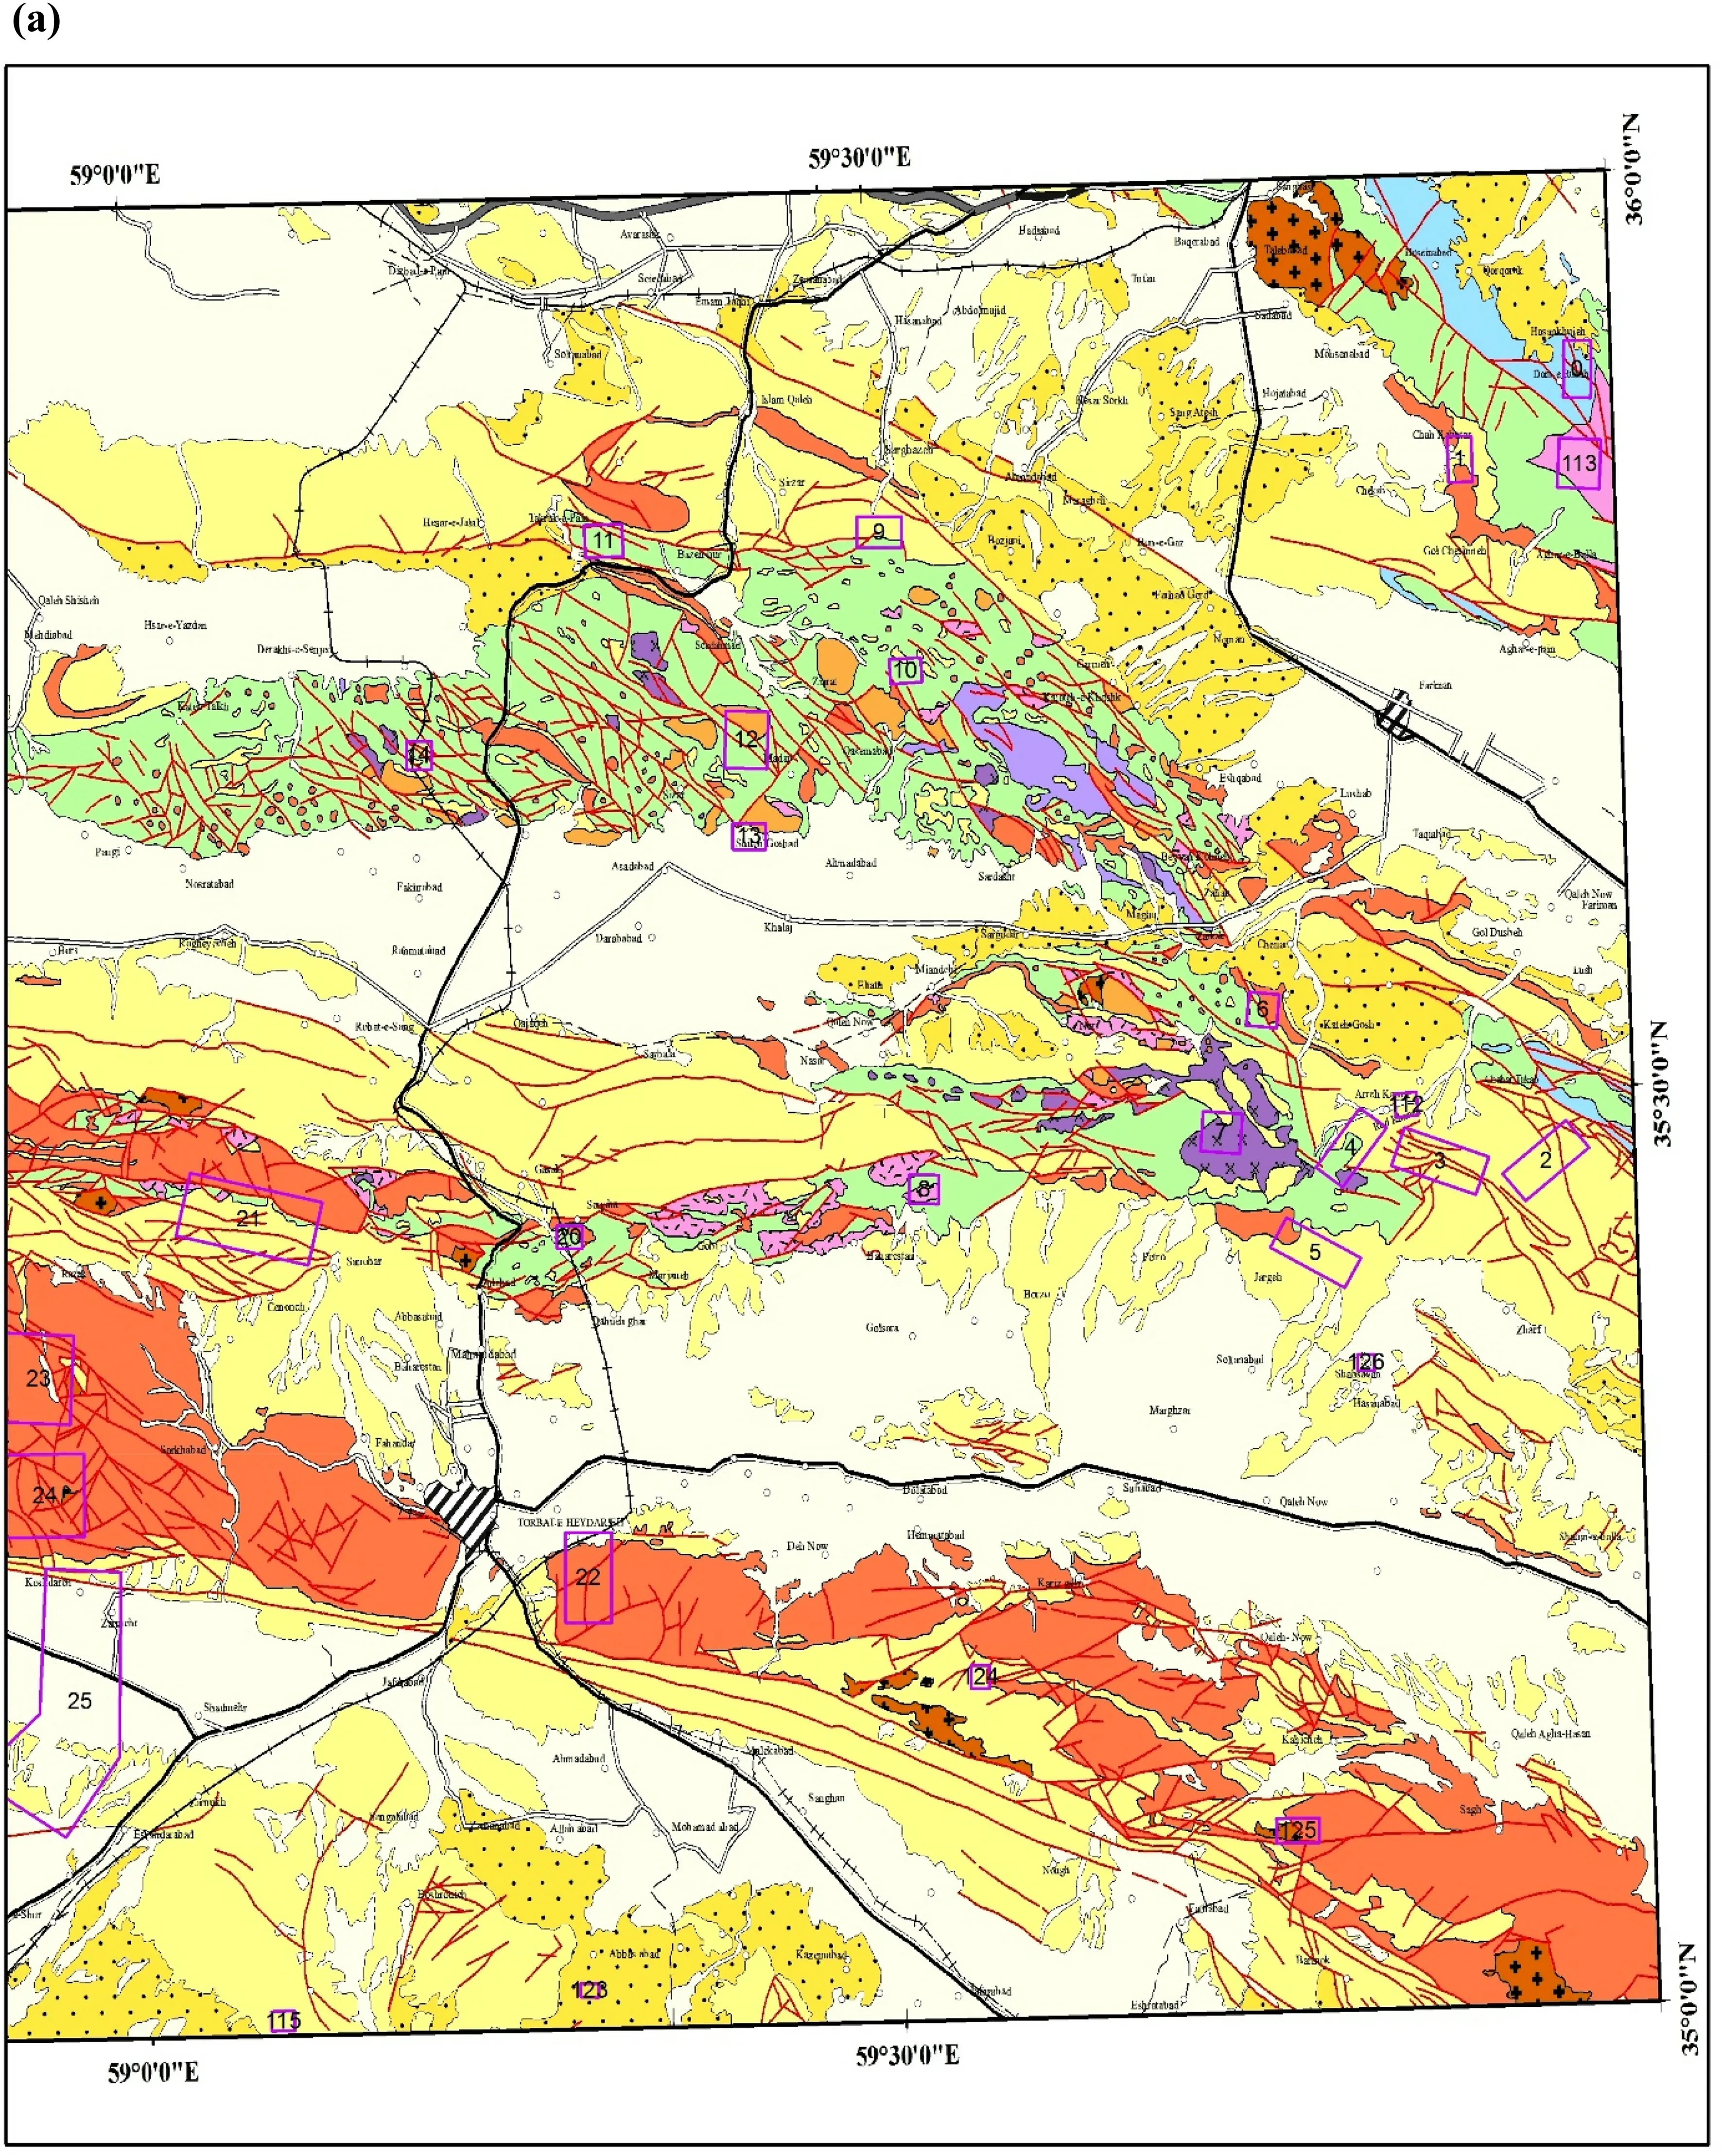
Fig.4(a)to(d)Distribution of anomalous areas on the geologic map of the Khorasan Razavi province
6 Discussion
Ranking results in rock environments(Table 5)indicate that the Taknar target has the highest score for gold exploration.It should be noted that the Taknar copper mine is located in this anomalous area.Other areas such as Arghash,Cheshmeh Noghreh,Tanorcheh,Kouhzar,Kalate HajAziz,Tajrood,Kaboudan,Gharghou,and Ghale Jough are among nine of the areas with score values higher than 30.Arghash and some other mineral prospects on the Kaboudan geologic map have been later turned into mines and are still in operation.However,other prospects still need detailed exploration.Another mineral prospect is the Sebandoon area with a score value of 6.3(ranked 37th)that is currently operating as an economic mine.
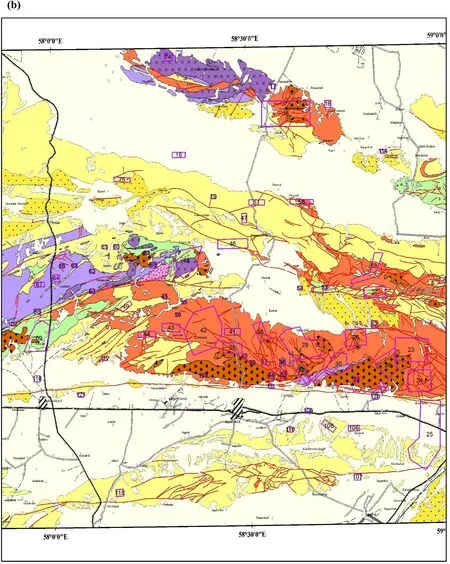
Fig.4 continued
As for anomalous areas in the alluvial environments(Table 6),the Zarmehr placer deposit has been proven as an ore deposit.A brief description of the anomalous areas is given below.In the alluvial environments,based on results related to the Zarmehr placer and its geographical location,it would seem that these anomalies are not important compared to the anomalous areas in rock environments,except Zarmehr and Alibig.

Fig.4 continued
To further investigate the ranking and characteristics of those anomalies that have become economic mines,the gold mines that exist in this zone were studied as well.Currently,there are three operating and three under-construction gold mines in the Khorasan Razavi province,as well as two other gold ore deposits that are being explored.Six of these mineral deposits are located within the study area,including the Arghash I and II mines,Seh Bandoon gold mine,Damangor gold mine,Koohe Zar gold mine,and Zarmehr Placer ore deposit whose general specifications and anomaly group had been investigated based on stream sediments.

Fig.4 continued
6.1 Kouh Zar gold mine(anomaly number 84)
This mine is located in the Kouh Zar anomalous area and its score in the rock environment was 42.6.This mineralization area is situated on the Khaf-Darooneh volcano-plutonic,between two major faults,Darooneh in the south,and Taknar(Rivash)in the north of the area.Various volcaniclastic rocks are outcropped in the mine,including vitric tuff,crystalline tuff,lithic-tuff,lapilli tuff,and lavas.The tuffs generally have rhyolitic to rhyo-dacitic composition and the compositions of lavas are generallyintermediate.Field studies have indicated that at least three volcanic events have taken place in the region.Based on a nummulitic limestone bed found between the volcanic rocks,it may be said that some parts of volcanism happened during the Eocene.Plutonic bodies with acidic to intermediate compositions(Oligo-Miocene)are outcropped in the northern and southern parts of the region.These suites include quartz monzonite,biotite-granite,monzogranite,and syeno-granite crossing the volcanic rocks.Karimpour(2005)believe that this ore deposit belongs to iron oxide copper-gold deposits(Karimpour 2005).
The old King was delighted, and embraced his thrice fortunate son and his new daughter-in-law tenderly, and appointed them as his successors to the throne

Table 4 Anomaly number in each sheet in Fig.4
6.2 Arghash I(Cheshmehzard)and II gold mines(anomaly number 8)
These mines are located in the Arghash anomalous area,in the south of the Neyshaboor city.The score of this anomaly area in the rock environment was 59.The geological units in the mineralization area include the Eocene,Miocene,Pliocene and Quaternary units.The most important rocks of this area are igneous rocks,including volcanic and volcanoclastic rocks of the Upper Paleocene-Upper Eocene and plutonic bodies younger than the Eocene.The first group includes andesitic,rhyo-dacitic and trachy-andesitic lavas,agglomerate,and volcanic breccia.During this period,the sedimentary basin underwent some changes that other units,including limestone,conglomerate,volcanoclastic rocks of Middle Eocene,as well as basic volcanic rocks,were simultaneously deposited within this volcanic unit.This unit includes a major part of outcrops in the region.The Upper Eocene volcanoclastic units include tuff,breccia tuff,sandy tuff,and agglomerate in addition to large volumes of volcanic lavas with dominant trachy-andesitic and megaporphyric trachy-andesitic compositions scattered over the study area,particularly in the northern parts.
The second group included granitoid bodies such as gabbro-diorite,granodiorite,granite,and basic to acidic dikes,which were injected into the above-mentioned setting along with the basin closure and its uplift in Late Eocene-Early Oligocene and were outcropped as bodies and apophases over the region.The genesis of this ore deposit was introduced as an epithermal gold deposit(Ashrafpour et al.2012).
6.3 Damanghor gold mine(anomaly number 90)
The Damanghor gold mine belongs to the Kaboodan anomalous area and is located in the north of the Bardaskan city.The score of this anomalous area in the rock environment was 37.6.The area of interest is almost covered by the Taknar Formation,which itself is formed of schist,meta-sandstone,and volcanic rocks and is accompanied by the Paleogene intrusive rocks and quaternary sediments.There are two igneous rocks in this area,the oldest and most important igneous rocks include metamorphosed rhyolite and rhyodacite of the lower Taknar Formation,and the Paleogene diabase that is the youngest igneous rock in the area intruded into the Taknar Formation.The metamorphosed igneous rocks form the low-height hills and rocks in the area and are mostly of greenschist and sericitic schist types.The genesis of this deposit has been introduced as massive sulfide gold(Safari et al.2014).

Table 5 Anomaly ranking for each anomalous arrock environments
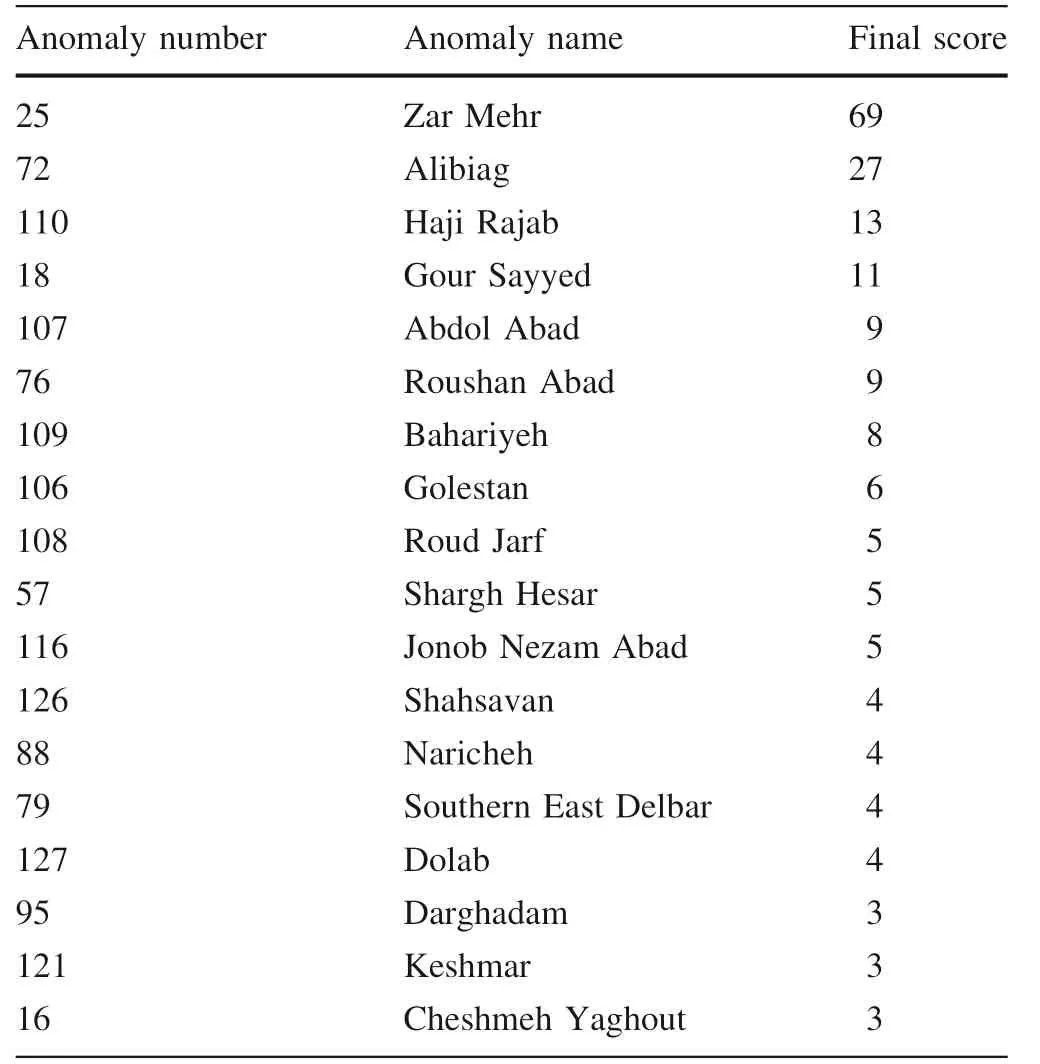
Table 6 Anomaly ranking for each anomalous zone in alluvial environments
6.4 Seh Bandoon gold mine(anomaly number 92)
Seh Bandoon gold ore deposit is located within the Seh Bandoon anomaly,75 km south of Sabzevar,and 35 km northeast of Bardeskan.The score of this anomaly in the rock environment was 6.3.From a structural point of view,this ore deposit is situated in the Sabzevar Ophiolitic Sequence,whose rocks include green volcanic rocks,red radiolarites and dark green volcanoclastic rocks of the Cretaceous age.The mineralization occurs as vein,fissure,and breccia along the joints and fractures of the host rock due to the injection of silicic hydrothermal solutions.This mine is believed to be a low sulfide epithermal gold(Pars Asia Payjoo Co.2012).
6.5 Zarmehr placer ore deposit(anomaly number 25)
This region is in the Razavi Khorasan province,25 km southwest of Torbat Heydaryeh,and 50 km east of Kashmar.The score of this anomaly area in the alluvial environment was 69.In an earlier project in the year 2010,to explore probable gold reserves in an 85-ha area,a series of 10-m-deep test wells were dug in the alluviums from which the samples were taken.The sampling process involved channel sampling,sample analysis,and the study of heavy minerals.The sampling grid was initially designed as 100×100 m that was densified to 50×50 m in some parts.The samples were collected every two meters from all sides of the wells and included a heavy mineral sample and a soil sample.In other words,five samples were obtained from each 10-m-deep well.In total,550 heavy mineral samples and 531 soil samples were taken from 1100 m of the dug wells(Azmi 2003).It should be noted that in the current study,these datasets were not used in anomaly raking.
The study of these mines indicates that the following anomalies that were ranked in this study have already turned into economic mines:Koohe Zar Anomaly with ranking 5 and score 42.6,Arghash with ranking 2 and score 59,Kaboodan with ranking 7 and score 37.6,Seh Bandoon with ranking 37 and score 6.3 in the rock environment,and Zarmehr placer with ranking 1 and score 69 in the alluvial environments.These rankings suggest that more detailed explorations are needed in this zone.
7 Results and conclusions
We separated and then ranked the gold anomalies in this zone,whose specifications and important results are provided as follow:
·Separation of anomalies using the fractal method proved to be effective for a area of 35,000 km
·Separation of 308 gold anomaly samples out of 11,504 data using the fractal method can serve as a standard for anomaly separation in areas where the number of stream sediment samples is limited
·Gold anomaly ranking for 128 areas based on the presented factors(S1,S2,S3)
·Separation of anomalies in alluvial and rock environments
·Numerical comparison of anomalies
·Quantification of exploration priorities
·Recommendation for investments in gold exploration
·Definition of new gold exploration targets
·Application of the method to decision-making
·Its application to other elements as well.
Finally,regarding the ranking of anomalies and comparing the results with existing mines,the most important conclusion is that this zone has a distinct priority for gold exploration in other anomalies that have not been opened as economic mines.It is expected that several other gold mines should be opened in the zone soon.In this study,we used several datasets and separated the anomalies based on the data of the zone.This serves as one of the noticeable features of this research.The sampling and analytical methods and the conductors were the same for all samples.Therefore,any error in the sampling and analytical procedures is approximately equal for all of the samples,meaning the separation of anomalies to be a valid process.
杂志排行
Acta Geochimica的其它文章
- Effect of crustal porosity on lunar magma ocean solidification
- Petrographic and geochemical characterization of weathered materials developed on BIF from the Mamelles iron ore deposit in the Nyong unit,South-West Cameroon
- Equilibrium mercury and lead isotope fractionation caused by nuclear volume effects in crystals
- Estimation of evaporation losses based on stable isotopes of stream water in a mountain watershed
- Geochemical significance of tricyclic and tetracyclic terpanes in source rock extracts from the Offshore Niger Delta Basin,Nigeria
- Paleoclimate evolution and aridification mechanism of the eastern Tethys during the Callovian-Oxfordian:evidence from geochemical records of the Qiangtang Basin,Tibetan Plateau
