Burst pulses for positive corona discharges in atmospheric air:the collective movement of charged species
2021-06-21YongkangPENG彭永康XiaoyueCHEN陈小月LeiLAN蓝磊HaoyuZHAN詹皓予YongcongLIU刘永聪WanglingHE何旺龄andXishanWEN文习山
Yongkang PENG(彭永康),Xiaoyue CHEN(陈小月),Lei LAN(蓝磊),Haoyu ZHAN(詹皓予),Yongcong LIU(刘永聪),Wangling HE(何旺龄) and Xishan WEN(文习山)
1 School of Electrical Engineering and Automation,Wuhan University,Wuhan 430074,People’s Republic of China
2 School of Electrical and Electronic Engineering,North China Electric Power University,Baoding 071000,People’s Republic of China
Abstract Positive corona burst pulses are an unstable pulse mode.They appear in a small range of the onset stage,and their current pulses result from the collective movement of charged species.This paper focused on the connections between these pulses and the collective movement of charged species.The movement of species is divided into four parts with respect to time:the(1)initial growth of species,(2)formation and development of the streamer region and negative ion sheath,(3)dead time(the time interval between the pulses),and(4)rapid re-growth of species.The movement of the species in the four parts and the correspondence with the current pulse were analyzed.The numerical results indicated the following:the rapid rising of the species matched the rising edge of the pulses,the streamer region,and negative ion sheath appeared in the falling edge of the primary pulse,and the rapid re-growth of species matched the re-ignition of the pulses.The results were in qualitative agreement with deductions and experimental observations in the literature.
Keywords:positive corona discharge,burst pulses,pre-onset pulses,collective movement of charged species
1.Introduction
Positive corona discharge is widely known to involve four stages[1–3],where these stages are marked by burst pulses[4],streamer pulses[5],glow coronas[6],and breakdown pulses[7].The burst pulses appear in a small range of the onset stage,where the pulse mode is a large primary pulse followed by several secondary pulses.According to the venerable body of research on the connections between the burst pulses and the collective movement of charged species,the current pulses result from the collective movement of charged species.
Trichel[8],who first detailed the burst pulses of positive coronas in 1939,proposed a mechanism involving electron avalanche progress in the initial pulses and the role of negative ions in continuous glow[8].Morrow[9]stated that‘Trichel deduced most of the details of the mechanism proposed for positive glow corona’[10].According to Amin’s observation[4]regarding burst pulses,a pre-onset positive corona has three critical potentials for different pulse states,and the new burst pulse starts when the space charge has crossed 80%of the gap.Miyoshi,Hosokawa[3]and Trinh[2]also observed the typical pulse train.Miyoshi,Hosokawa discussed the relationships between the burst pulse and streamer pulse,and they proposed that the successor electron avalanches supply the initiating electrons to ignite the secondary pulse(figure 2 of[3]).Trinh synopsized the entire discharge progress of positive coronas,presenting the typical burst pulses in figure 7 of[2].
In recent decades,simulation methods[11,12]have been used to analyze corona discharge together with experimental ones.The research of Morrow and his coworkers is canonical in the related field.They reported a series of theories[11,13–15],methods[16,17],and classical documentation[18,19]with a fluid model for positive and negative coronas in air and some other gases.Two previous studies[15,20]formulated a theory for positive coronas,which describes the development of the first primary pulse and the first secondary pulse when a positive voltage is abruptly applied to a point in the air at atmospheric pressure.The initial changes in the pulse,distribution of charged species,and electric field were studied.Notably,the propagation of positive ions and electrons in the streamer was elucidated.
Liu et al[21–24]advanced Morrow’s research by simulating the transformation process.Their findings were consistent with those of Morrow in terms of positive corona simulation.Many other researchers analyzed the pulses of positive corona or burst pulses[25–28].He et al[25]studied burst pulses in the positive half of alternating current corona.Li et al[26]studied the detailed characteristics of positive corona.Liu et al simulated pulses of positive corona in[27].He et al also proposed a theoretical model based on the movement of the space charged clouds and explained some physical mechanism of the pulses of positive corona with the model[28].More recently,Chen et al[29]studied the mode transition of negative coronas from Trichel pulses to pulseless glow.He emphasized the great importance of gas heating.The gas dynamics and a detachment reaction are taken into account in the model.
Notably,in[15],the charged species were plotted on a single graph(figure 13 in[14]),which indicated an obvious region where positive ions have the same order of magnitude as electrons;this region corresponded to the so-called streamer region.A later study also indicated the same phenomenon(see figure 6.10(a)in[30]).
Building on these previous studies,the present study aimed to investigate(i)the collective movement of the charged species and(ii)the charged species’connections with the pulse current in the stage marked by a positive corona burst pulse.
2.Model description
A one dimensional model with a DC 30 kV supplied voltage used in the present paper had been calculated in our former work[31].An in-depth study on the basis of its simulation results was done in the present paper.The focus in this paper is the coupled relationship between the collective movement of the charged species and the electric field.Some important details for the model are recapitulate here.
The continuity equations for electrons,positive ions,negative ions,are as follows:
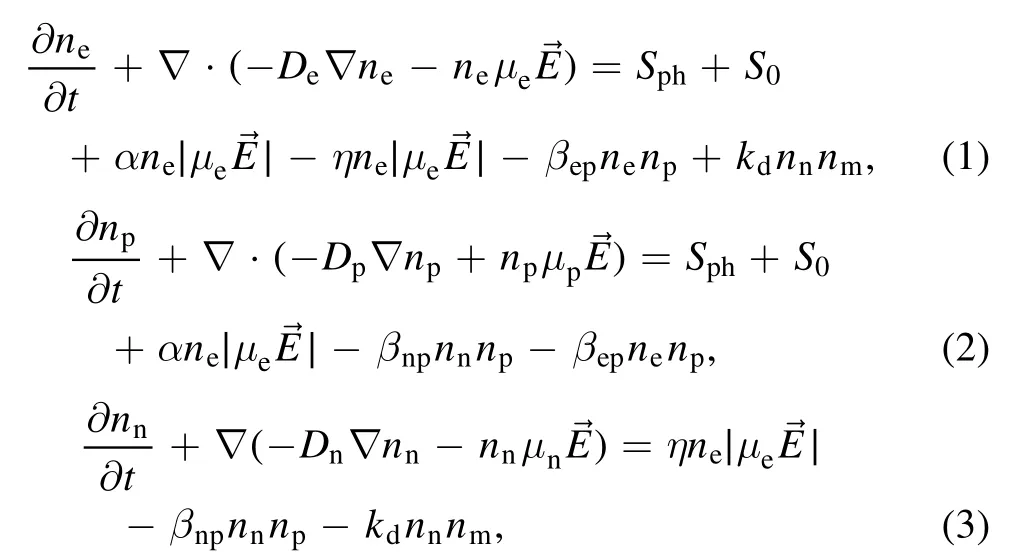
wherene,np,nn,μe,μp,μn,De,Dp,Dn,are the number densities(in m−3),mobilities(in m2(V−1s−1)),and diffusion coefficients(in m2s−1)of electrons,positive ions and negative ions,respectively.Sph,S0are the photoionization source term and initial source term.Ionization,attachment of electrons to neutral molecules,recombination of electrons with positive ions and recombination of positive and negative ions,are with the reaction coefficientsα(m-1),η(m-1)andβepandβnprespectively.
To make the electric source term more richly descriptive,the role of metastable molecules was also considered in our model.The consideration of such a role was used by Lowke[22]to account for the effect of electron detachment from negative ions
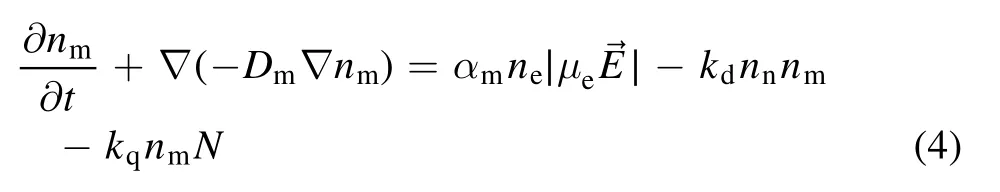
αmis the creation coefficient for metastable molecules impact with electrons,kdis the detachment coefficient for detaching electrons from negative ions,andkqis quenching rate constant for metastable molecules.
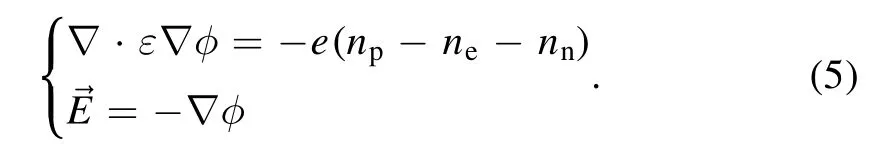
The electric fieldand electric potentialφcan be calculated using Poisson’s equation
The parameters used in the simulation are shown in table 1.
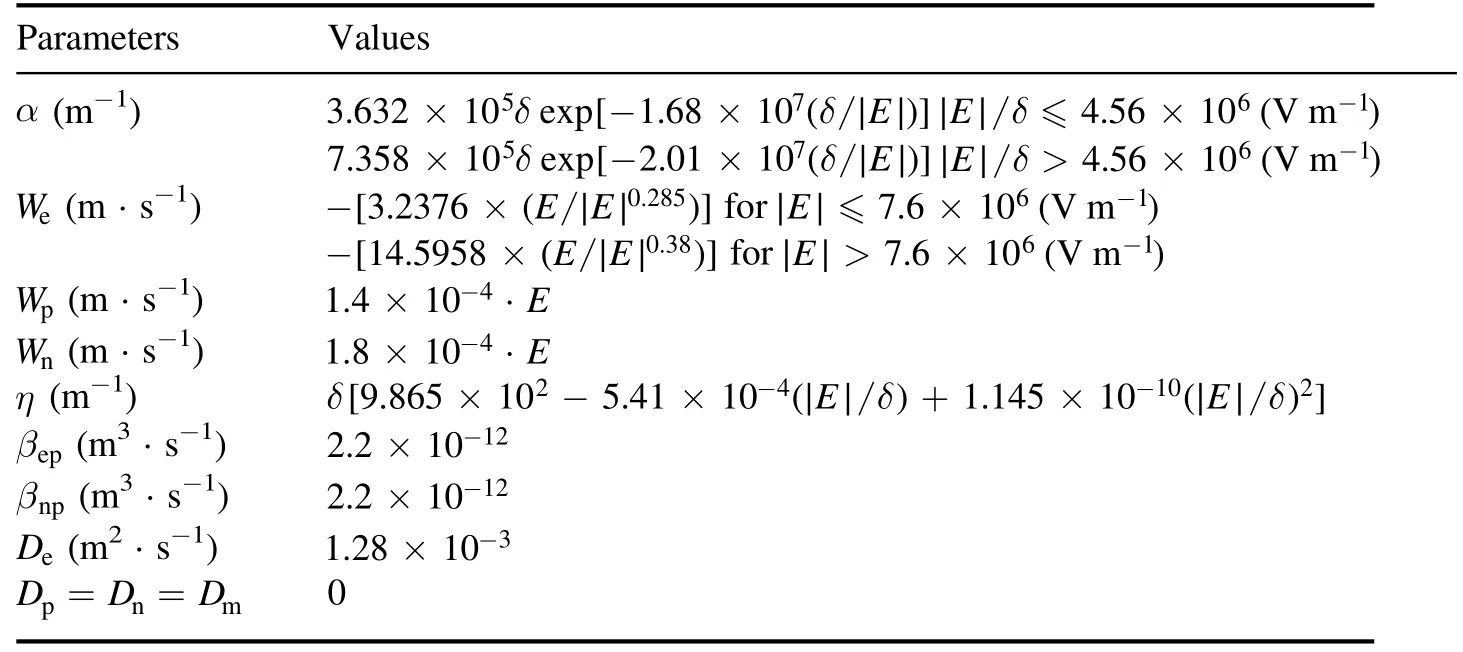
Table 1.The transport parameters for the charged species.
The photoionization source termSphsolved by the Helmholtz equations[32]:
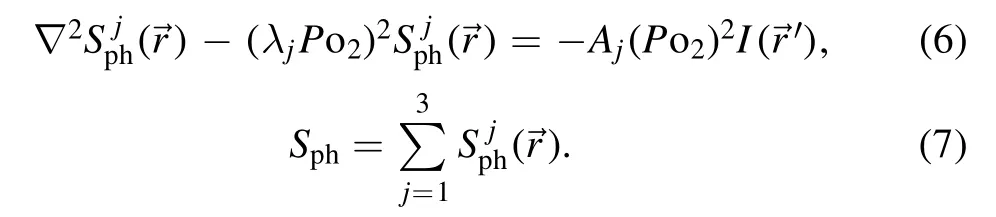
The values ofAjandλjare shown in table 2.Po2is the partial pressure of O2in Pa andis the emission of ionizing UV photons.
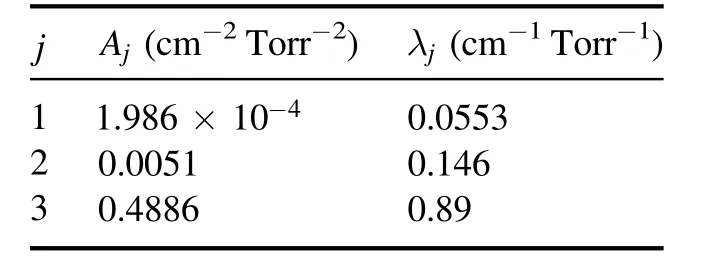
Table 2.Constant coefficients for equation(6).
The initial number densities of charged particles were given artificially by the Gaussian distribution in equation(8)
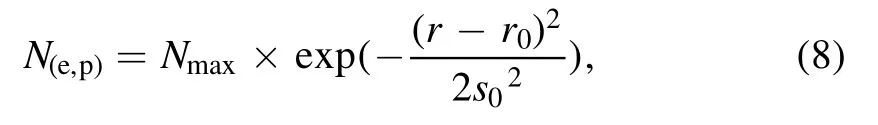
where Nmax=1016m−3,r0=5×10⁻⁴m,and s0=1×10⁻⁴m.Zero initial density was assumed for negative ions and metastable molecules,as shown in figure 1.
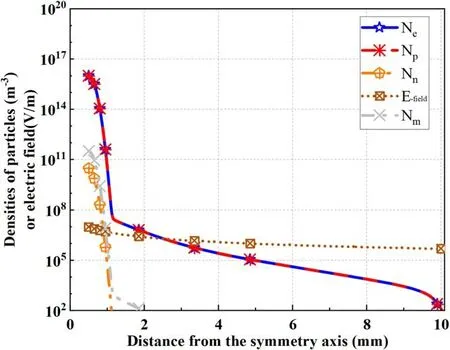
Figure 1.Initial distribution of species and the electric field in the discharge gap(t=0).
The electrode system comprised a solid cylinder with a radius of 0.5 mm and a coaxial steel mesh cage with a radius of 200 mm.A 30 kV DC voltage was applied to the anode(the inner electrode)when the cathode(the outer electrode)was grounded.
E-fieldis the legend of electric field.We put it with the densities of charged particles in the same figure to show the corresponding relationship between charged particle density and electric field.
The mesh of the model was divided into four parts,as shown in table 3.
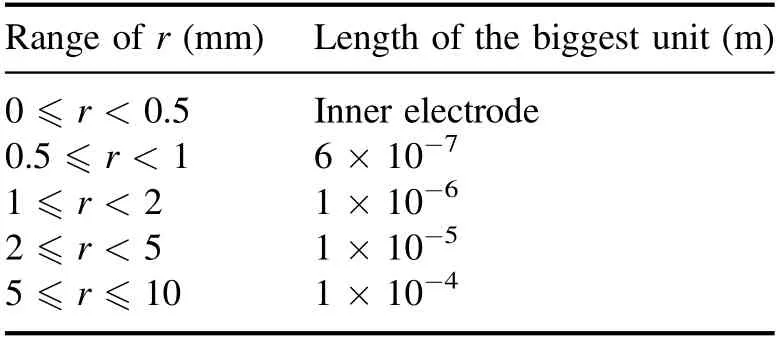
Table 3.Mesh of the model.
Figure 2 illustrates the flow of the computing program used for the simulation.The finite element method was used to solve these equations.Specifically,when the computing program is initiated,each variable is given an initial value.Subsequently,the electric field is calculated by solving Poisson’s equation,andSphis obtained by solving the Helmholtz equations.Thereafter,the densities of electrons,positive ions,negative ions,and metastable molecules—denoted asne,Np,Nn,andnm,respectively—are obtained by solving the continuity equations.The requisite reaction coefficients take those values noted in[31].Error checking was conducted to verify the convergence characteristics.To investigate the successive burst pulse trains,tmaxwas set to 200 μs.In addition,the time step,Δt,depends on the absolute tolerance;Δt had the orders of 10−9–10−12s in a single pulse stage and 10−8s in the interval stage.
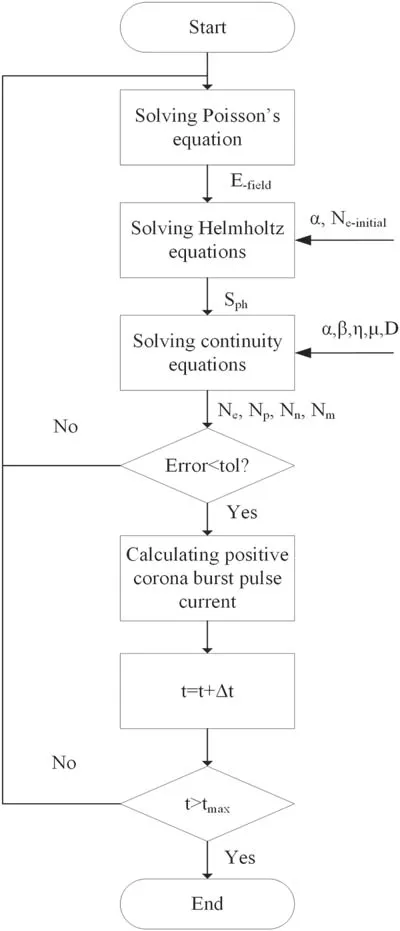
Figure 2.Flowchart of the computing program.
3.Simulation results and discussion
The obtained positive corona burst pulses at 30 kV are shown in figure 3.The primary pulse and secondary pulses had an alternating pattern;this finding is in qualitative agreement with the experimental observations in[2,3]and numerical results of[20].
The collective movement of charged species was analyzed.This collective movement was divided into four parts with respect to time:the(1)initial growth of the species;(2)formation and development of the streamer region and negative ion sheath;(3)dead time(the time interval between the pulses);and(4)rapid re-growth of the species.These parts match the different stages of the pulses(figure 4).
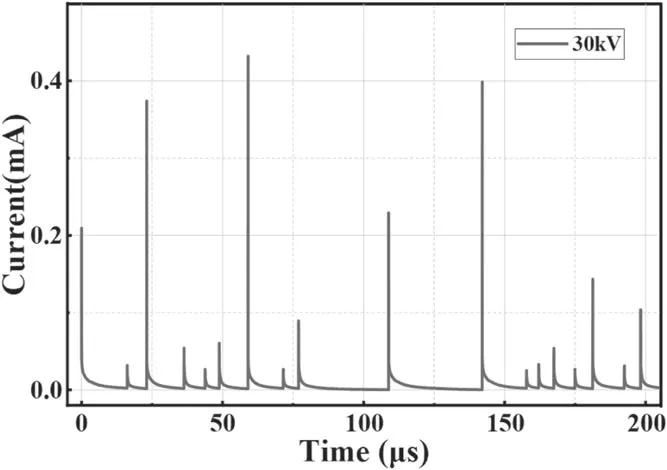
Figure 3.Positive corona burst pulse.
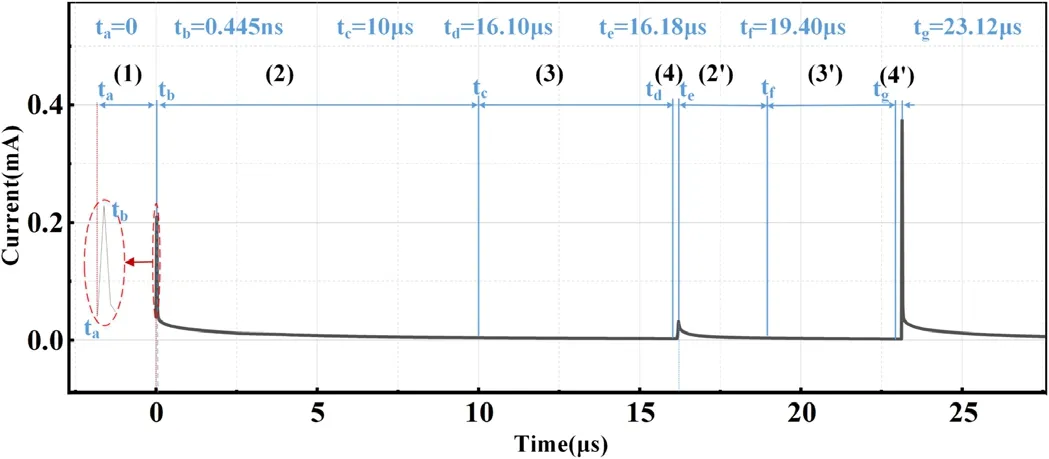
Figure 4.Time divisions of burst pulse.
3.1.Initial growth of species
From t=0,the charged species began to grow all over the discharged channel.The positive ions and electrons around the anode both rapidly increased from 1016m−3order to 1019m−3order.The densities of the positive ions,negative ions,and electrons then reached their peak values of 1.54×10¹⁹m−3,4.458×1017m−3,and 1.48×10¹⁹m−3at 0.445 ns,0.725 ns,and 0.915 ns,respectively.Their distributions and corresponding positions are presented in figure 5.
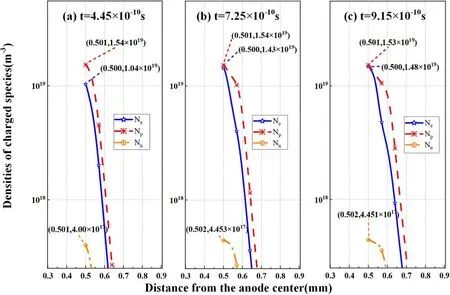
Figure 5.Initial growth and peak value of the charged species near the anode.
Figures 1 and 5(a)illustrate the rising edge of the first pulse from ta=0 to tb=0.445 ns.In this period,there were more positive ions than electrons near the anode.Because the electrons were absorbed by the anode,positive ions attained their peak first,resulting in the trend for the electric field near the anode falling to become a valley.The current increased due to the rapid increase of species and the decrease of the electric field.Subsequently,the low electric field decreased and choked the collisional ionization at the corresponding location,which decreased the current and consequently formed the peak of the current pulse.
3.2.Formation and development of the streamer region and negative ion sheath
3.2.1.Formation and development of the streamer region.Although the ionization at the remaining part near the anode was still strong,the electrons and negative ions were able to accumulate to their peaks where the electric field was low,as depicted in figures 5(b)and(c).
From t=0.725 ns,the density of electrons near the anode reached the same order of magnitude as positive ions did,thus forming a streamer region[6,15,33].As illustrated in figure 6,the streamer region was gradually developing toward the direction of the cathode,and the densities of electrons and positive ions in the streamer region decreased gradually.In the streamer region,the density of positive ions was slightly greater than that of electrons(enlarged part of figure 6).This resulted in the electric field at the corresponding location decreasing to approximately 103V m−1.In other words,the electric field in the streamer region was low—a similar outcome as that from extending the radius of the anode.
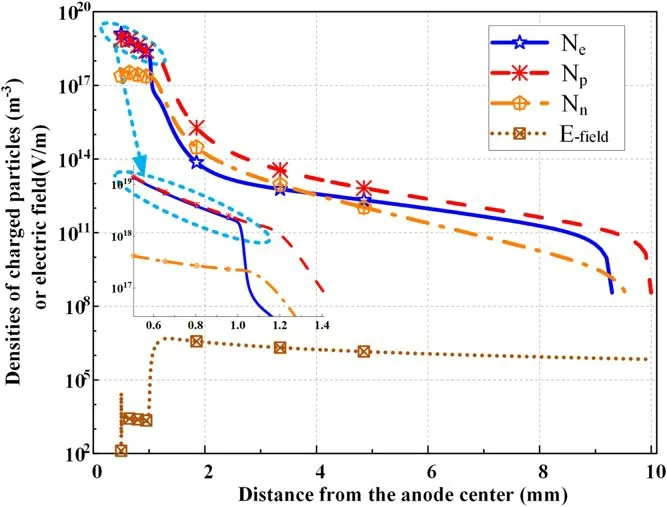
Figure 6.Densities of particles and electric field in the discharge gap at t=20 ns.
In the present study,we propose a criterion to describe the little difference between positive ions and electrons in the streamer region.The length of the streamer region was included in the analysis if the corresponding density difference between positive ions and electrons was <10%of the density of positive ions in the streamer region(equation(9))
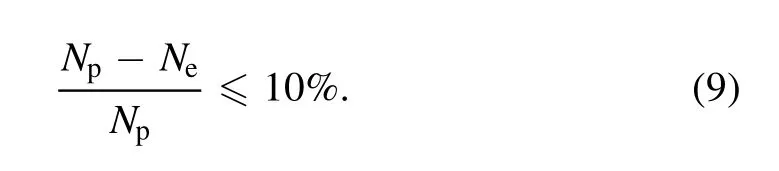
Figure 7 marks the boundary of the streamer region and its direction of movement with a black dotted line.The r coordinate and the corresponding electric field are labeled in parentheses.The streamer region was 0.011 mm at t=0.725 ns,and it was developing toward the cathode until 60 ns.Subsequently,the direction of movement of the streamer region turned back toward the anode.At approximately t=8 μs,the boundary of the streamer region arrived at the anode,where the streamer region completely disappeared.
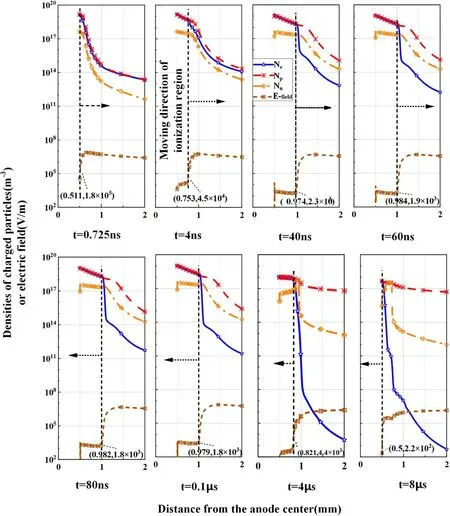
Figure 7.Movement of the streamer region.
The length of the streamer region versus time is plotted in figure 8.The trend had a steep rising edge and a gentle falling edge.
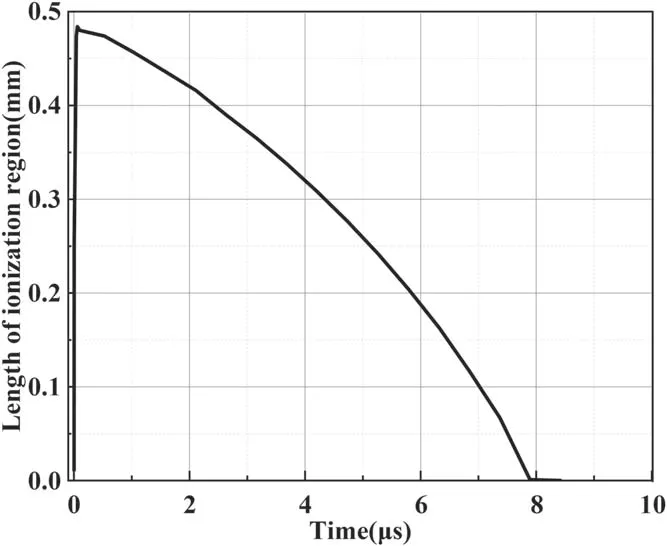
Figure 8.Length of the streamer region.
Compared with the current pulse,the extending stage of the streamer region matched the main falling edge of the current from tb=0.725 ns to t=60 ns.During this period,the current fell to 10%of the peak value.The shrinking stage matched the remaining part of the current falling edge.At t=8 μs,the remaining current of the pulse was almost 0;this indicated that the current on the falling edge of the pulse was mainly formed by the migration of streamers.
3.2.2.Formation and development of the negative ion sheath.When the moving direction of the streamer region turned back,the number of negative ions began to increase at the end of the streamer region.As depicted in the enlarged drawing of figure 9(a),the negative ions exhibited an obvious peak at the cross of the electrons and negative ions.As shown in figures 9(a)and(b),this small peak grew gradually and reached the same order of magnitude as the positive ions did at the end of the streamer region.The negative ions formed a stable sheath near the streamer region,which was similar to the so-called glow layer discussed by much literature[2,3,9,34].This meant that the negative ions also played an important role in the primary burst pulse.After the formation of the negative ion sheath,the negative ions migrated to and disappeared at the anode after the streamer region.It was shown in figures 9(c)and(d).
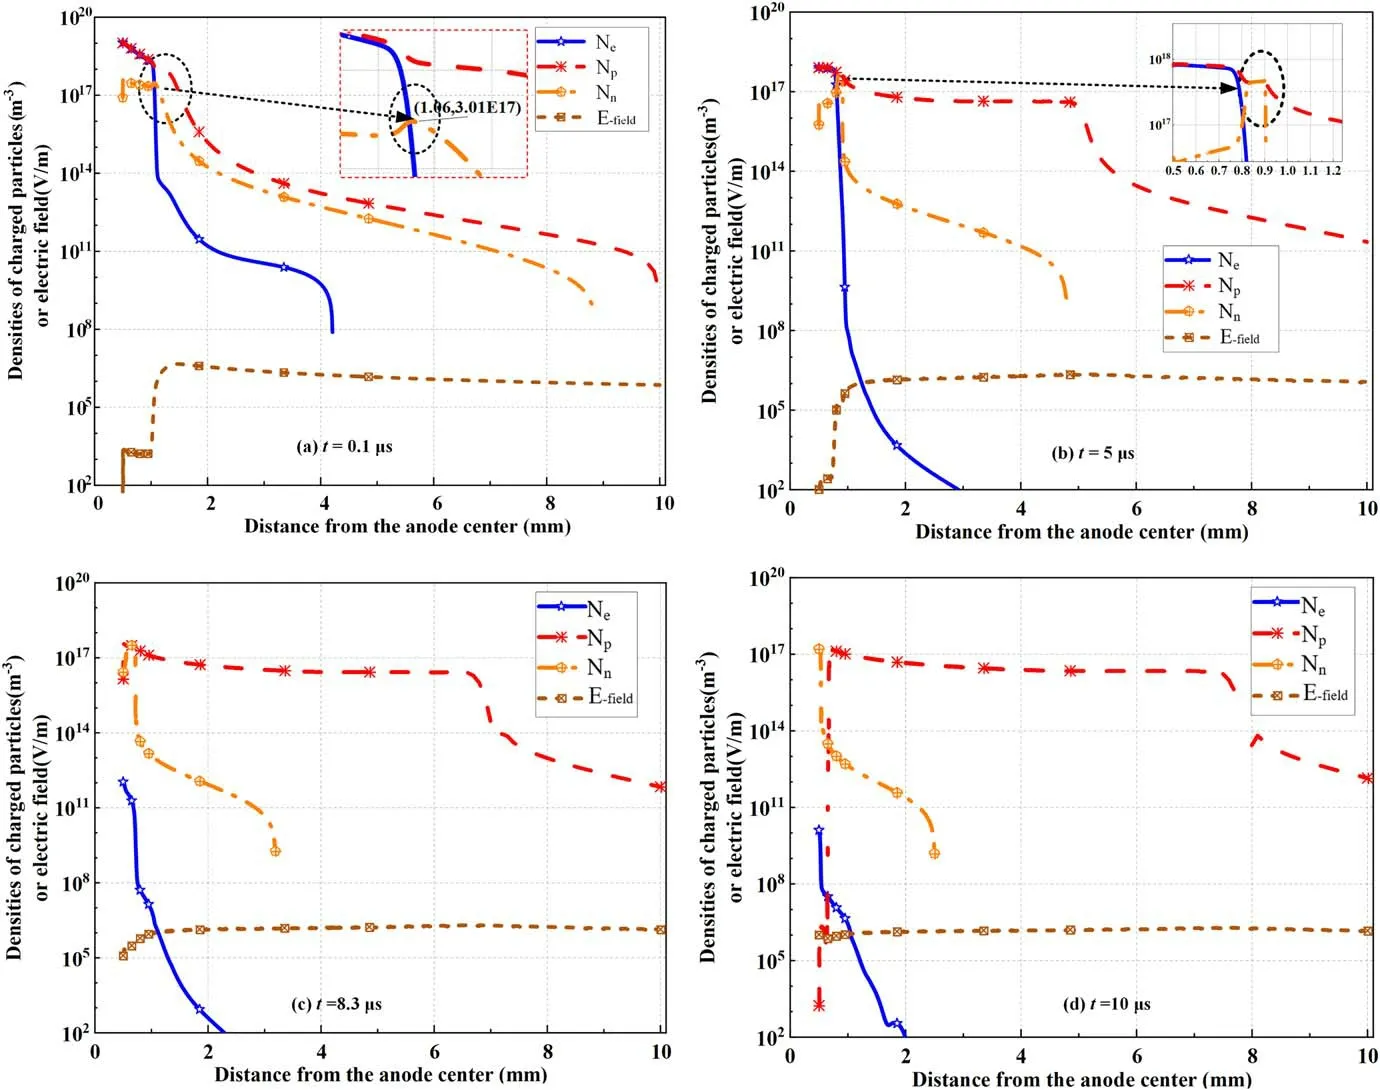
Figure 9.Densities of charged particles and electric field in the discharge gap.
The migrated track of the negative ion sheath is presented by the shadow between the two curves in figure 10.We define that the negative ion sheath is where the difference between positive ions and negative ions was less than 10% of the density of positive ions.The distance between the left and right edges is the length of the negative ion sheath.When the streamer region began to shrink back to the anode,the length of the negative ion sheath was extending,and moving toward the anode.
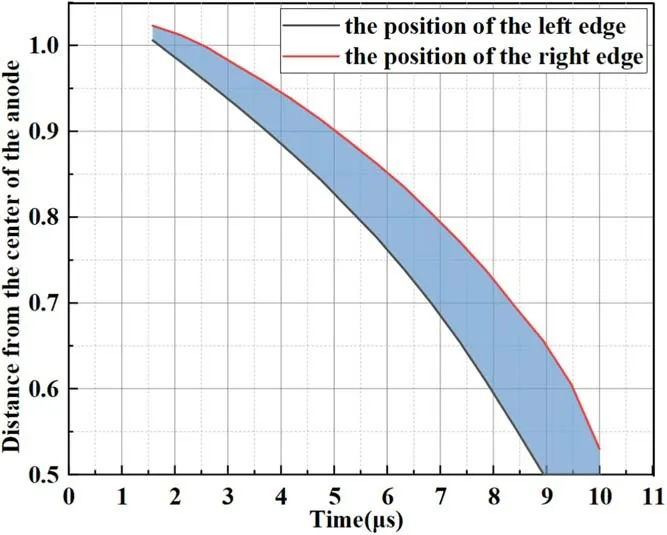
Figure 10.Position of the negative ion sheath.
3.3.Dead time
As shown in figure 4,the time from tcto tdis the dead time between the first two pulses,and the time from tfto tgis the dead time between the second and third pulses.During the first dead time,the current was maintained at a low level of<5 μA(15% of the secondary pulse).The dead time is characterized by the migration of positive ions,recovery of the electric field,and tentative growth of electrons.
The migration of positive ions could be divided into two stages.The first stage did not belong to the dead time,and it occurred after the formation of the streamer region(at t=0.1–10 μs).As indicated by the red dotted line of figure 9,the high-density region of positive ions gradually extended from the end of the streamer region to the cathode in this first stage.The second stage constituted the main part of the dead time,as indicated in figures 9(d)and 11.The peak density of positive ions near the anode migrated to the cathode,which led to the electric field recovering gradually;this migration determines the dead time length.
With the recovery of the electric field,electrons began to develop tentatively.Initially,density of electrons rises up at random positions in the ionization region of the discharging channel owing to the photoionization and the initial avalanche.The electrons then rapidly developed and formed more electron avalanches,which adhered to the anode and absorbed by the anode.The density of electrons rises up and declines in the channel as the avalanches formed and subsided.The accompanying positive ions stayed and moved to the cathode under the force of the electric field.
As noted in figure 11,several positive ion waves of different sizes were scattered in the migration area,these waves were the residual effect of the electron avalanches at the same location dozens of ns or several hundred ns before.The scales of these tentative electron avalanches increased as this process repeated itself.
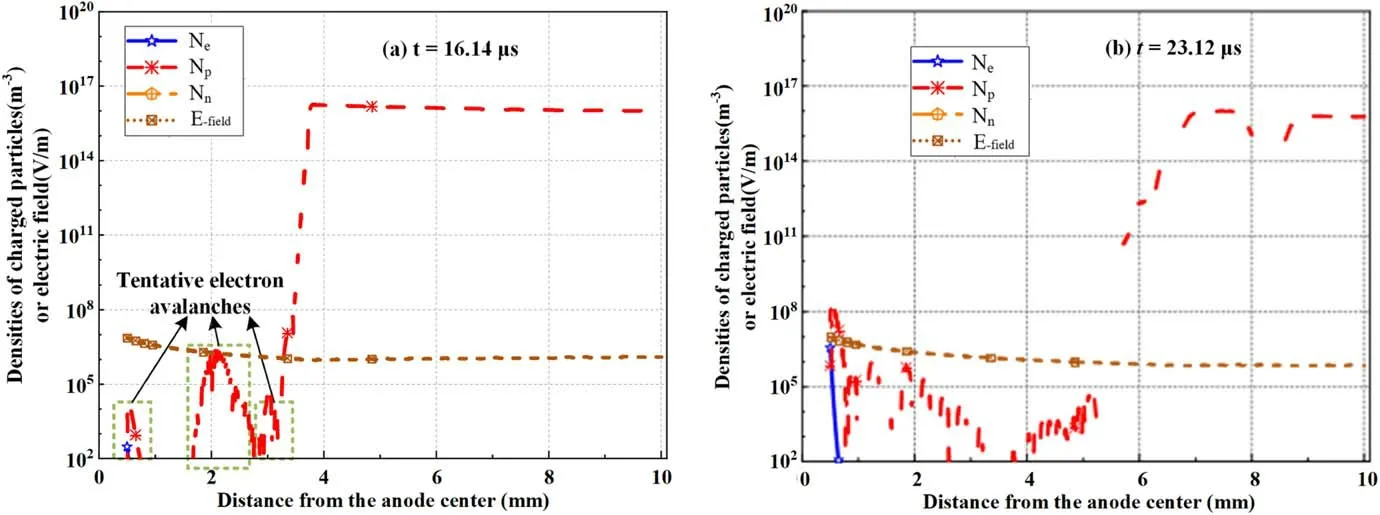
Figure 11.Tentative electron avalanches in corona dead times before current pulses of different versions.
During this period,despite the low current,the movement of positive ions and the recovery of the electric field were creating the conditions for the ignition of the next pulse.The tentative electron avalanches were probing if the conditions for ionization were prepared.
3.4.Rapid re-growth of the species
When the electric field and species conditions were prepared,the pulses began to emerge.The rapid re-growth of the charged species had two variants.The first had no obvious streamer region and was created by one of the tentative electron avalanches.Different from the conventional rise of tentative avalanches,this mutant rise drives the simultaneous growth of both positive and negative ions.A fragment of its life circle development is displayed in figure 12.
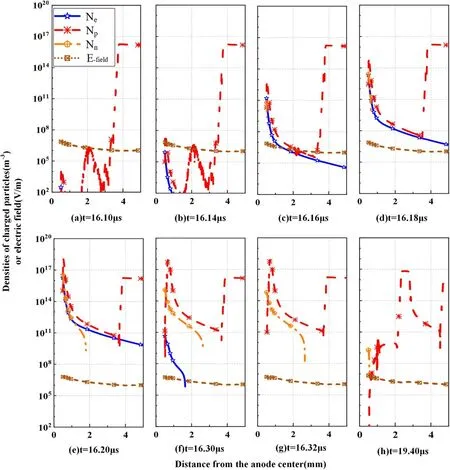
Figure 12.Development of life cycle of a small-particle pulse.
The avalanche emerged at td=16.10 μs,as shown in figure 12(a).The negative ions emerged at t=16.16 μs.The species reached their peak values at te=16.2 μs.Subsequently,the densities of electrons and negative ions began to decrease rapidly,and the positive ions slowly drifted toward the cathode.The electrons density reduced to a low level which cannot be seen in the figure 12(g)at tf=16.32 μs,and the negative ions became unobservable after t=19.40 μs.The life of the first secondary pulse ended at t=3.30 μs;the pulse grew in the first 0.1 μs and decayed thereafter.
The rising edge of the first secondary pulse was from tdto te(figure 4).Similar to the first primary pulse,the rising edge of the first secondary steamer pulse matched the rise of the species.Conversely,owing to the absence of a streamer region,the falling edge of the secondary pulse matched the falling of electrons from teto tf.After the electrons of the first secondary pulse disappeared,the pulse current entered the second dead time at tfto tg.
Similar to the first primary pulse,the second variant of the re-growth of the species was able to trigger a streamer.It emerged at tg=23 μs(figure 4).Its streamer region at the peak time is illustrated in figure 13.From a comparison of figures 13 with 11(b),it is evident that the densities of electrons and positive ions rapidly increased.At t=23.14 μs,both densities reached a 1019m−3order of magnitude at the same time,and the density of negative ions reached 1017m−3;this behavior of the charged species was identical to the behaviors described in section 3.1.
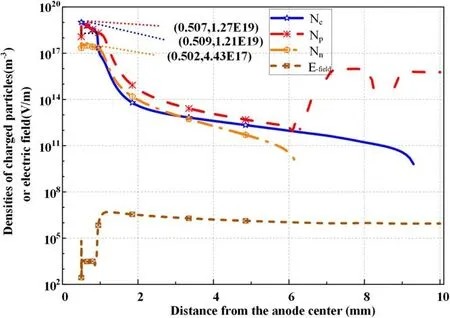
Figure 13.Rapid growth of the second primary streamer region at t=23.14 μs.
Owing to the artificial initial distribution of the species,the first primary pulse skipped over a part of the accumulated progress of the species,doing so while this process had been completed in the second primary pulse from tg=23 μs to t=23.12 μs;this phenomenon was studied in our former research[31].Although the current rise was slight during this period,species growth had already commenced.Such growth is necessary for the last jump of the rising edge of the primary pulse current.
4.Summary and conclusion
The collective migration of electrons,positive ions,and negative ions in positive corona discharges in the air was analyzed in this paper.Our findings yielded the following.
(1)The rapid growth of the species for the first pulse is from tato tb.This growth matches the rising edge of the pulse current.When the positive ions peak at tb,the current peaks at the same time.
(2)The streamer region formed rapidly at t=0.725 ns in the present study.The region extends to the direction of the cathode from 0.725 ns to 60 ns and shrinks back to the anode from 60 ns to 8 μs.The extending stage of the streamer matches the first 90%of the current fade of the pulse current falling edge in 59.275 ns,and the shrinking stage matches the remaining 10% current drops at approximately 7.4 μs.
(3)The negative ion sheath migrates to the anode and shrinks to the anode on the heel of the streamer region;it appears in the second stage of the pulse current falling edge.
(4)In the present model,the current in dead time was <5 μA.The main species activities in dead time are the migration of positive ions and the tentative growth of electrons.The tentative growth of electrons is probed,and thus we can inspect whether the electric field has recovered to a level sufficient for ionization.
(5)The rapid re-growth of the charged species has two variants.The first has no streamer region,grows in the first 0.1 μs,decays in the following 3.2 μs,and matches the first secondary pulse.The second behaves similarly to the first primary pulse,and it replaces the artificial initial distribution of the species with a longer rising edge.
Acknowledgments
This work was supported by National Natural Science Foundation of China(No.51907145).
猜你喜欢
杂志排行

Plasma Science and Technology的其它文章
- Special issue on selected papers from HVDP 2020
- Microwave transmittance characteristics in different uniquely designed one-dimensional plasma photonic crystals
- Effect of plasma step gradient modification on surface electrical properties of epoxy resin
- Reconstruction of energy spectrum of runaway electrons in nanosecond-pulse discharges in atmospheric air
- The enhanced aerosol deposition by bipolar corona discharge arrays
- Effect of dilution gas composition on the evolution of graphite electrode characteristics in the spark gap switch