Construction of the first high-density genetic map for growth related QTL analysis in Ancherythroculter nigrocauda*
2021-06-15YanhongSUNPeiLIGuiyingWANGRenliSUNJianCHENQiZHOUJingouTONGQingLI
Yanhong SUN , Pei LI, Guiying WANG, Renli SUN, Jian CHEN , Qi ZHOU,Jingou TONG , Qing LI ,**
1 Fisheries Research Institute, Wuhan Academy of Agricultural Sciences, Wuhan 430207, China
2 Wuhan Xianfeng Aquaculture Technology Co. Ltd., Wuhan 430207, China
3 Wuhan Academy of Agricultural Sciences, Wuhan 430207, China 4 State Key Laboratory of Freshwater Ecology and Biotechnology, Institute of Hydrobiology, Chinese Academy of Sciences,Wuhan 430072, China
Abstract Ancherythroculter nigrocauda is a fish endemic to the upper areas of the Changjiang (Yangtze)River in China. Quantitative trait locus (QTL) mapping is a powerful tool to identify potential genes aff ecting traits of economic importance in domestic animals. In this study, a high-density genetic map was constructed with 5 901 single nucleotide polymorphism (SNP) makers by sequencing 92 individual fish from a F1 family using the specific-locus amplified fragment sequencing approach. Initially, 48 QTLs for total length,body length, body height, and body weight were identified according to the high density of the genetic map with 24 LGs, a total length of 3 839.4 cM, and marker spacing of about 0.82 cM. These QTLs explained 27.1%–49.9% of phenotypic variance. The results of this study suggest that major QTLs are responsible for the growth of A. nigrocauda, and these are potentially useful in comparative genomics research, genome assembly, and marker-assisted breeding programs for this species.
Keyword: Ancherythroculter nigrocauda; specific-locus amplified fragment; high-density genetic map;quantitative trait locus
1 INTRODUCTION
In aquaculture species, many important traits such as growth, disease resistance, and feed conversion rate have major eff ects on the productivity and profitability of a species. These traits are generally influenced by a number of quantitative trait loci(QTLs), and most of them have minor eff ects.However, a few QTLs harbor genes may have major eff ects that are useful for molecular breeding (Yue,2014; Tong and Sun, 2015). Traditional strategies of genetic improvement of production traits are based mainly on phenotype and pedigree information, but these strategies require considerable time (Gjedrem,2000). Genetic linkage maps are considered essential tools for QTL mapping, positional cloning of candidate genes, and anchoring of whole-genome scaff old sequences, which can speed up the genetic improvement of production traits and improve breeding effi ciency. A high-density linkage map is essential for fine QTL mapping, which involves mapping the QTLs in small chromosomal regions and identifying candidate genes in the QTLs. A suffi cient number of molecular markers are crucial for constructing the high-density map and fine QTL mapping.
Compared with the use oflow-throughput markers such as microsatellites amplified fragment length polymorphic (AFLP), next-generation sequencing(NGS) provides the capacity oflarge single nucleotide polymorphism (SNP) markers rapid and cost-eff ective development and genotyping (Davey et al., 2011).Genotyping-by-sequencing (GBS) methods such as restriction-site-association DNA sequencing (RADseq) (Baird et al., 2008), 2b-RAD (Wang et al., 2012),double-digest RAD-seq (Peterson et al., 2012), and specific length amplified fragment sequencing(SLAF-seq) (Sun et al., 2013), have accelerated for SNP discovery and genotyping. SLAF-seq has been successfully used for high-density mapping and QTL fine mapping in several aquaculture species, including common carp (Sun et al., 2013), Pacific white shrimp(Yu et al., 2015), Chinese mitten crab (Qiu et al.,2017), triangle sail mussel (Bai et al., 2016) and pikeperch (Guo et al., 2018). Compared with traditional genetic maps, these high-density maps and QTL fine mapping confirm that SLAF-seq is a powerful high-throughput technology for the fast and effi cient development of a large number of polymorphic markers and is an eff ective approach for constructing genetic maps.
Ancherythroculternigrocaudais a fish endemic to the upper areas of the Changjiang (Yangtze) River in China that can be easily kept alive and fresh. However,the natural resource of this species has suff ered heavy reduction largely because habitat has been adversely aff ected by pollution from agriculture, chemical industry, overfishing, and damming (Liu and Cao,1992). As a result, the population structure ofA.nigrocaudahas been miniaturized and low-aged(Liu, 2013). For the protection and sustainable utilization ofA.nigrocauda, it is necessary to understand its genetics. The production ofA.nigrocaudahas increased substantially in recent decades because ofits characteristics of fast growth,strong tolerance to stress conditions, and low cultivation cost. However, genetic and genomic research in this species is limited and there has been no advancement in breeding improvement. A number of microsatellites and SNPs (Sun et al., 2014, 2015, 2018) have been developed and used in genetic studies ofA.nigrocauda,but the information from these studies is not enough for the development of molecular breeding.
The aim of the study was to construct a highdensity map ofA.nigrocaudaand to map QTLs associated with growth-related traits. We identified genetic markers and candidate genes associated with growth-related traits that might be useful for further marker-assisted selection (MAS) programs inA.nigrocauda.
2 MATERIAL AND METHOD
2.1 Mapping family and sampling
A F1 full-sib family ofA.nigrocaudawas maintained at the Institute of Fisheries, Wuhan Academy of Agricultural Science, Wuhan, Hubei Province, China. Approximate 1 000 off spring were raised in a 1 000-m2pond and were fed twice a day under a standard feeding regime. The oxygen level in the pond was maintained at 3 mg/L or above. Ninetytwo progenies were randomly collected to construct a linkage map. Four growth-related traits, including total length (TL), body length (BL), body height(BH), and body weight (BW), were measured in all off spring at 18 months after hatching. Fin clips obtained from all samples were preserved in alcohol at room temperature for DNA extraction. Genomic DNA was extracted according to the standard phenolchloroform protocol (Sambrook and Russell, 2001).
2.2 SLAF library construction and highthroughput sequencing
An improved SLAF-seq strategy was adopted.Initially, the genome ofErythroculterilishaeformiswas used as a reference to design marker discovery experiments by simulating in silico the number of markers produced by diff erent enzymes. Then, the genomic DNA was digested using the enzymeRsaI(New England Biolabs, Ipswich, MA, USA). A single nucleotide (A) overhang was added subsequently to the digested fragments using the Klenow fragment(3′→5′ exo-) (New England Biolabs) and dATP at 37 °C. In addition, duplex tag-labeled sequencing adapters (PAGE-purified, Life Technologies,Carlsbad, CA, USA) were then added to the A-tailed fragments with T4 DNA ligase. Polymerase chain reaction (PCR) was carried out using diluted restriction-ligation DNA samples, dNTP, Q5®High-Fidelity DNA polymerase, and PCR primers. The PCR products were purified and were pooled. Pooled samples were separated by 2% agarose gel electrophoresis. Fragments of 414–494 bp (with indexes and adaptors) were selected and purified for pair-end sequencing (each end 125 bp) with the IlluminaHiSeq 2500 system (Illumina, Inc., San Diego, CA, USA).
2.3 SLAF-seq data analysis and genotyping
SLAF-seq marker identification and genotyping were carried out according to the procedures described by Sun et al. (2013). After filtering out low quality reads (quality score <20e) and trimming the barcodes and terminal 5-bp positions from each high quality read, clean reads from the same sample were mappedonto theE.ilishaeformisgenome sequence by the SOAP software (Li et al., 2008). Sequences mapping to the same position were defined as one SLAF locus(Zhang et al., 2015). The SNP loci of each SLAF locus were detected between parents, and SLAFs with more than three SNPs were filtered out initially. The alleles of each SLAF locus were then defined according to parental reads with a sequence depth >20 fold. On the other hand, for each off spring, reads with a sequence depth >10 fold were used to define alleles.In diploid species, one SLAF locus could contain at the most four genotypes; thus, SLAF loci with more than four alleles were considered repetitive and subsequently discarded. Only SLAFs with 2–4 alleles were identified as polymorphic and considered potential markers. The marker codes of the polymorphic SLAFs were analyzed according to the F1 population, and there were seven segregation types(ab×cd, ef×eg, hk×hk, lm×ll, nn×np, ab×cc, and cc×ab).

Table 1 Statistics of SLAF sequencing data and high-quality marker depths
Genotype scoring was performed using a Bayesian approach to ensure genotyping quality (Sun et al.,2013). High-quality SLAF markers for constructing map were filtered according to specific criteria. First,average sequence depths >10 fold were considered.Second, markers with more than 25% missing data were filtered. Third, the chi-square test was performed to examine segregation distortion. Initially markers with significant segregation distortion (P<0.01) were excluded from the map and then added later as accessory markers.
2.4 Linkage map construction
Marker loci were partitioned primarily into linkage groups (LGs) according to their locations onE.ilishaeformisgenome. The modified logarithm of odds (MLOD) scores between markers was then calculated to confirm the robustness of markers for each LG. Markers with MLOD scores <5 were filtered prior to ordering. A newly developed HighMap strategy was used to order the SLAF markers and correct genotyping errors within LGs (Liu et al.,2014). Initially, the recombinant frequencies and logarithm of odds (LOD) scores were applied to infer linkage phases. Then, enhanced Gibbs sampling,spatial sampling and simulated annealing algorithms were combined for an iterative process of marker ordering (Jansen et al., 2001; Van Ooijen, 2011). The mapping algorithm was repeated until all markers were appropriately mapped. Then, the error correction strategy of SMOOTH was used according to the parental contribution of genotypes (Van Os et al.,2005), and the k-nearest neighbor algorithm was used to impute missing genotypes (Huang et al., 2011).Skewed markers were subsequently added into this map by applying a multipoint method of maximum likelihood. The Kosambi mapping function was used to estimate map distances (Kosambi, 1943). A genetic linkage map was then drawn using MapChart 2.2(Voorrips, 2002). The estimated genome length was the average oflengths calculated using two previously described methods (Chakravarti et al., 1991; Fishman et al., 2001). The recombination ratio between female and male was the average of the ration of all LGs,which were calculated according to the lengths of intervals of shared markers between female and male.The genetic map was evaluated using haplotype and heat maps constructed using two scripts designed by Beijing Biomarker Technologies Corporation(China).
2.5 QTL mapping for growth traits
The QTLs for the four growth-related traits were identified using R/QTL with the composite internal mapping (CIM) method. The LOD significance threshold levels were determined using the permutation test based on 1 000 permutations at a significance level ofP<0.01.
3 RESULT
3.1 Discovery of SLAF markers and genotyping

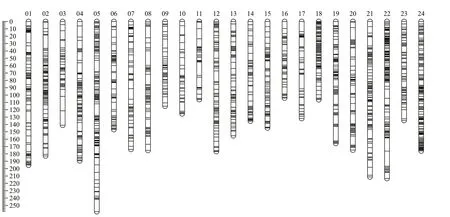
Fig.1 Genetic lengths and marker distribution in 24 linkage groups of the high-density linkage map

Table 2 Statistics of the segregation patterns for SNP markers
SLAF libraries were established for highthroughput sequencing with the IlluminaHiSeq 2500 platform (Illumina, Inc.), and 287 183 501 pair-end reads were generated (Table 1). The high-quality base(Q score>30) was 92.66% and GC content was 38.84%. After filtering low quality reads, 835 721 SLAF markers were detected; 186 362 of them were in the male parent and 235 815 were in the female parent. The read numbers for SLAFs had mean coverage of 48.86 fold and 33.94 fold in the male and female parents, respectively. After removing SLAFs with no parental information, 45 766 markers were successfully genotyped (Supplementary Fig.S1).After filtering out the unsegregated markers in the parents (aa×bb), 38 838 polymorphic loci that conformed to the F1 population segregation codes were identified. These loci were used in map construction (with at least 70% of progenies presented).
3.2 High-resolution linkage map construction
After discarding markers with segregation distortion, 8 650 high-quality markers were remained for linkage map construction (Table 2). The final linkage map included 24 LGs with an LOD of 6.0.There were 3 889, 2 435, and 5 901 markers in the female, male, and sex-averaged maps, respectively(Fig.1; Supplementary Tables S1 & S2). The total map distances were 3 612.60 cM, 3 260.35 cM, and 3 839.4 cM for the female, male, and sex-averaged maps, respectively. The mean distance between two markers was 1.29 cM, 1.79 cM, and 0.82 cM with 96.78% gap <5 cM were 95.37%, 92.95%, and 96.78% in the female, male, and ex-averaged maps,respectively. The lengths of the sex-averaged map LGs ranged from 106.10 cM to 258.42 cM, and the largest gap was 20.55 cM (Table 3).
The estimated total genome map lengths were 3 658.39 cM, 3 321.68 cM, and 3 878.82 cM for the female, male, and sex-averaged maps, respectively,so the genome coverage of the female, male, and sexaverage linkage maps were 98.75%, 98.15%, and 98.98%, respectively.
3.3 Segregation distortion markers in the maps
Areas that contained skewed markers were defined as segregation distortion regions. A total of 1 414 segregation distortion markers were mapped in the sex-averaged map (P<0.01). These markers accounted for 23.96% of all mapped markers. The distribution of distortion markers varied greatly between and within LGs, and their number ranged from 4 to 622(Supplementary Table S3). The frequency of distortion markers was much higher in LG22 (69.7%) than in the other LGs.

Table 3 Summary statistics of 24 linkage map for the A. nigrocauda
3.4 Diff erences in recombination rates between sexes
Diff erences in recombination rates between the sexes were determined by dividing the female map length by the male length between the common markers. A total of 423 shared markers were detected,and the map length for each LG was calculated. The female/male recombination ratio in the sex-specific maps was an average of 1.03 and ranged from 0 to 3.89 among the 24 LGs. In 14 of the 24 LGs, the recombination rate was highest in the female map.The female and male map lengths between the common markers were 2 089.639 cM and 2 022.076 cM, respectively (Table 4).
3.5 Genetic map evaluation
The quality of the genetic map was evaluated based on haplotype and heat maps. Haplotype maps can directly reflect each individual recombination(Supplementary Fig.S2). Heat maps can indicate recombination between markers within a single LG,and can be used to identify potential ordering errors(Supplementary Fig.S3). Most LGs were perform well. The percentage of missing markers on each LG ranged from 0% to 0.02%, which indicated they had no significant eff ect on genetic map quality(Supplementary Table S3).
3.6 QTL mapping of growth-related traits
Pairwise comparisons among the four growthrelated traits (TL, BL, BH, and BW) using Pearson’s correlation revealed that all four traits were all highly correlated (P<0.01) with correlation coeffi cients between 0.896 and 0.997. The correlation was highestbetween TL and BL (0.997) and lowest between TL and BH (0.896) (Table 5).

Table 4 Recombination rates in female and male maps using shared markers
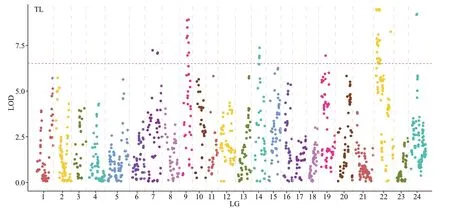
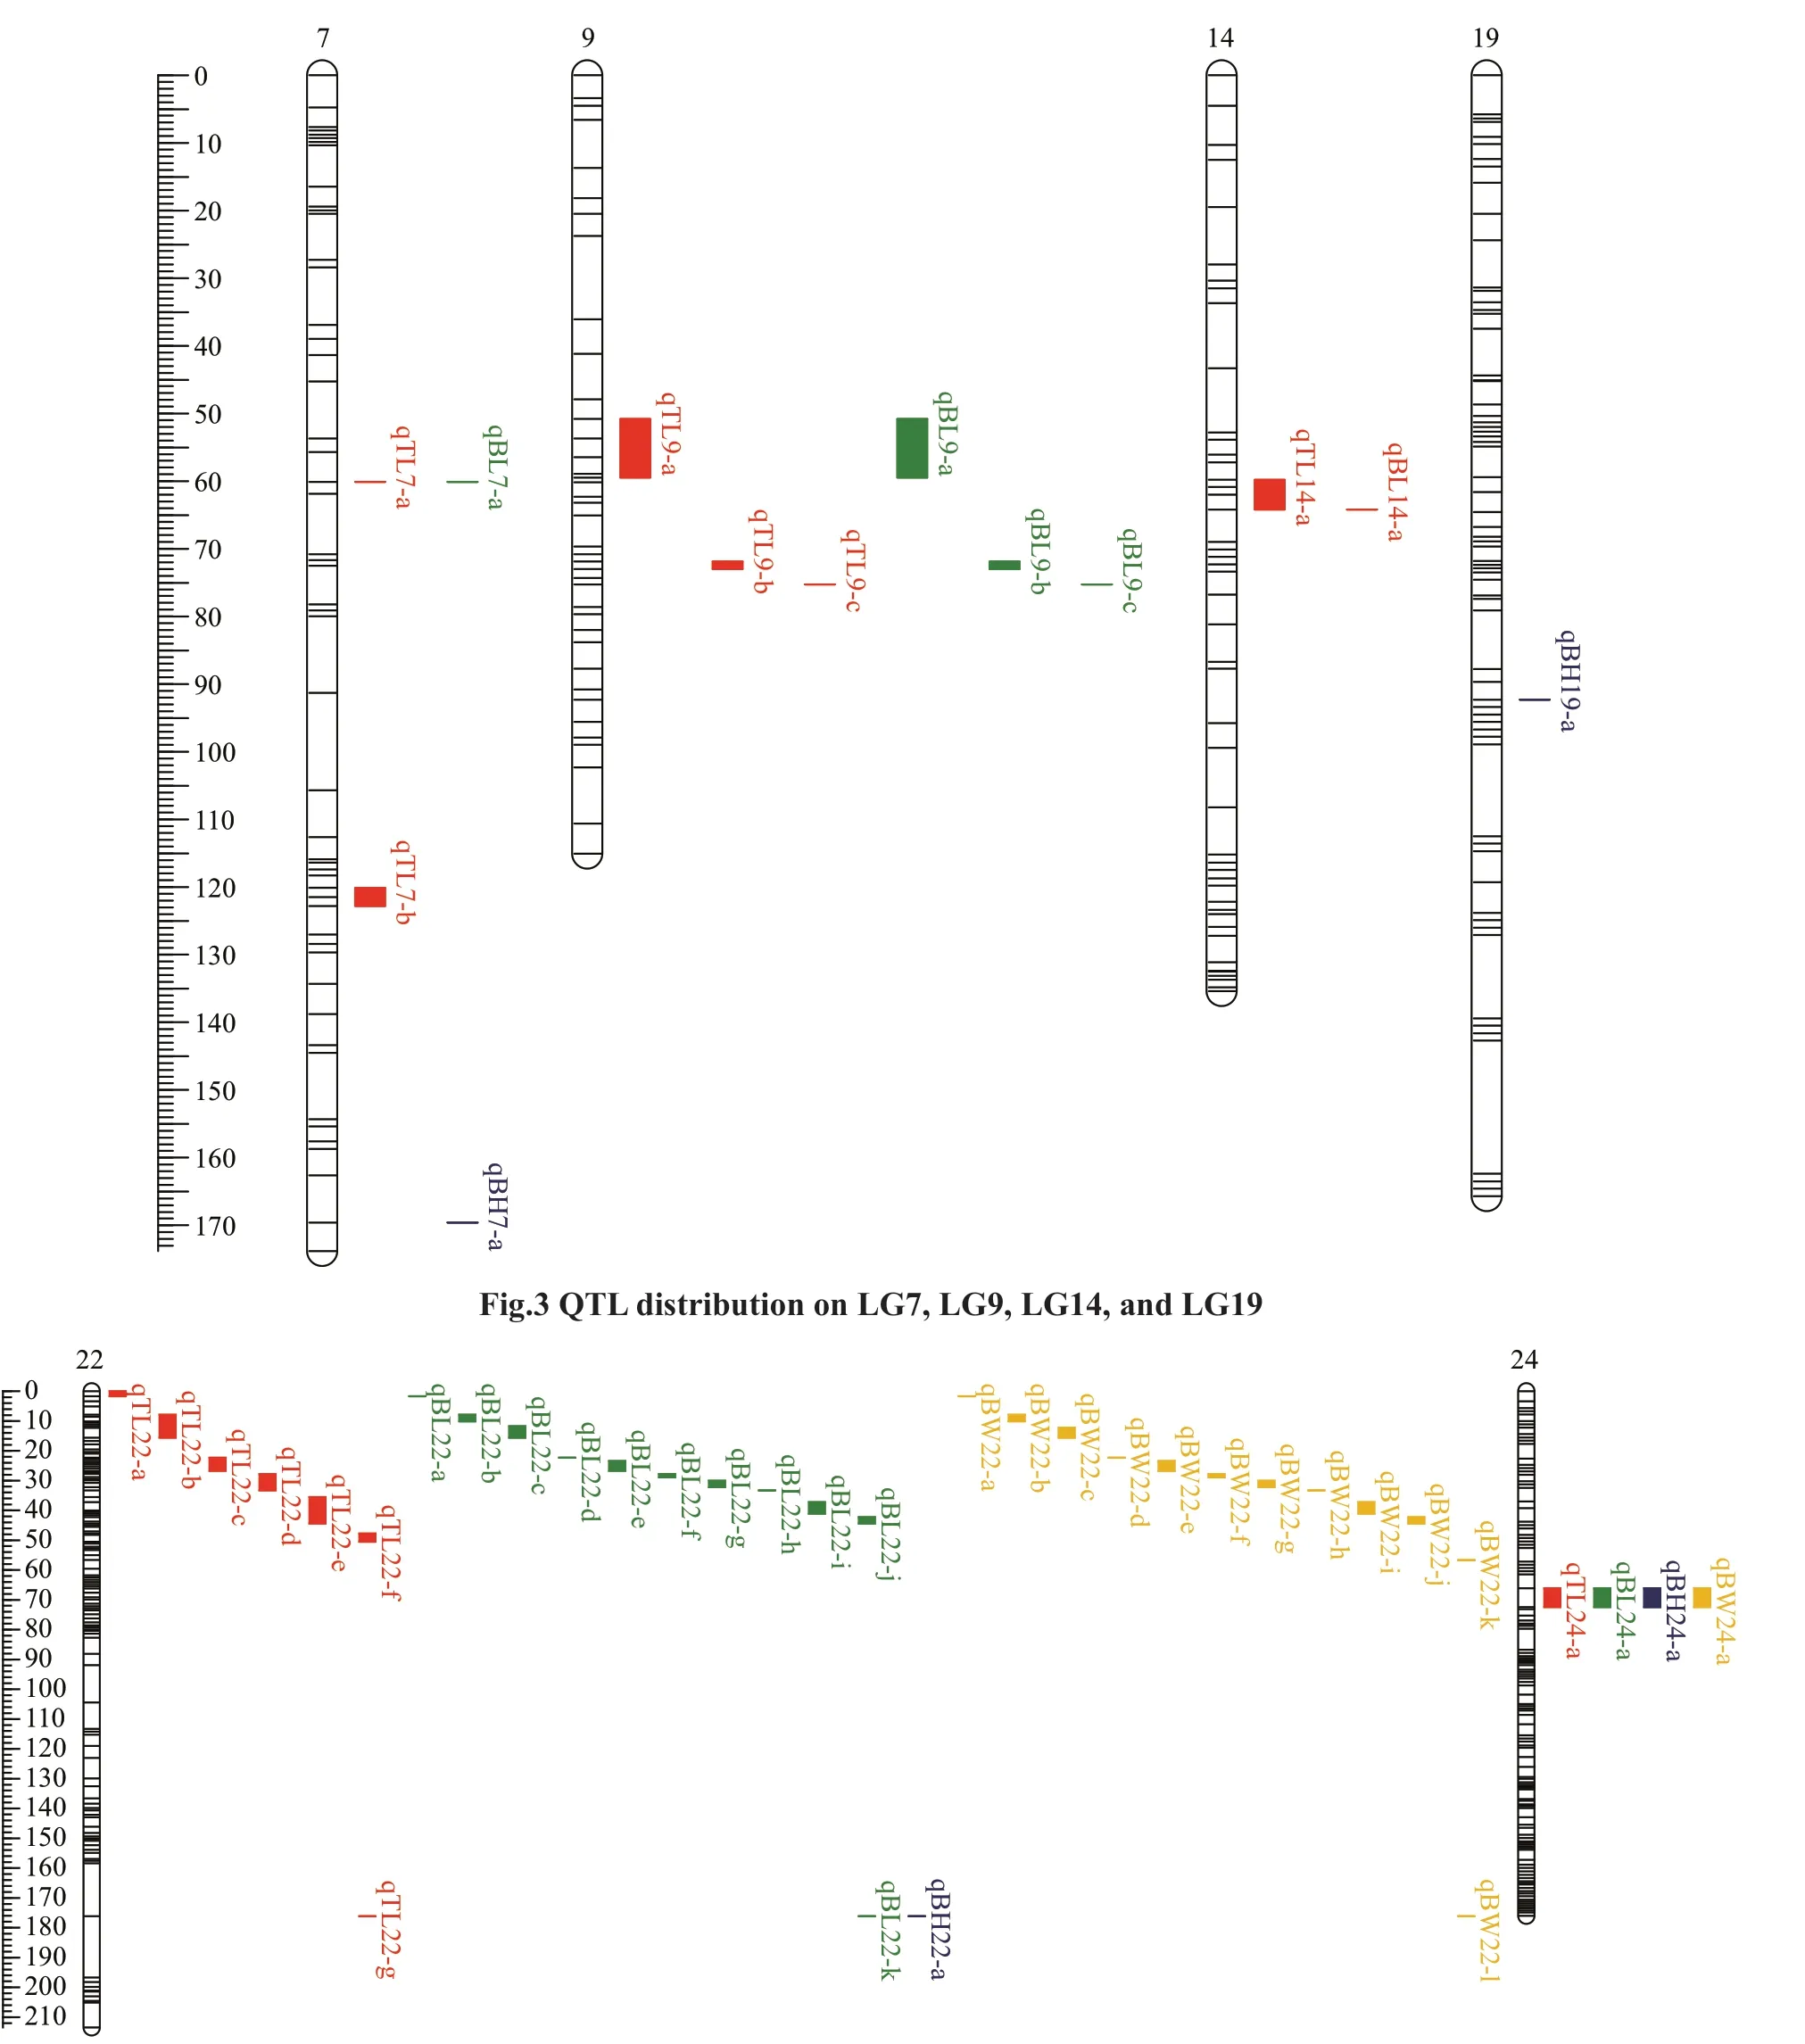
Using the CIM method, 48 QTLs associated with growth were identified in the genome-wide scale(Table 6; Figs.2–4). TL had 14 QTLs, among which TL-9a on LG9 was the most prominent, accounting for 49.9% of the phenotypic variance explained(PVE). BL had 17 QTLs with PVE values that ranged from 29.9% to 47.9%. BH had 4 QTLs, and the largest eff ect was on LG24, representing 40.1% of the PVE.BW had 13 QTLs, and the largest eff ect was on LG22,representing 38.5% of the PVE.
On assessing the frequencies of the QTLs for the four traits, we found that two co-localization QTLs onLG22 and LG24 were common to all four traits, four co-localization QTLs on LG7 and LG9 were common to TL and BL, and nine co-localization QTLs on LG22 were common to BL and BW.

Table 5 Pearson’s correlation between growth-related phenotypic traits TL, BL, BH, and BW in the mapping family of A. nigrocauda

Fig.2 Detection of four growth-related locus in A. nigrocauda

Fig.2 Continued

Table 6 All QTL for four growth-related traits

Fig.4 QTL distribution on LG22 and LG24
4 DISCUSSION
The massively parallel sequencing technology and GBS methods have allowed well-defined genetic linkage maps to be constructed using thousands of SNP markers in many non-model organisms (Wang et al., 2015; Liu et al., 2017; Feng et al., 2018). Highdensity SNP linkage maps have been constructed previously using SLAF sequencing in several aquaculture organisms, including common carp (Sun et al., 2013), triangle sail mussel (Bai et al., 2016),and pikeperch (Guo et al., 2018). The number of markers in a linkage map is usually determined by the choice of restriction enzymes, number of restriction enzymes, total number of enzyme cut sites, and rate of polymorphism across the genome (Andrews et al.,2016). We used SLAF technology and constructed a high-density linkage map forA.nigrocaudathat contained 5 901 SNP markers and had a resolution of 0.82 cM. To our knowledge, this is the first highdensity genetic linkage map reported for this species.Compared with other linkage maps for aquaculture species that were constructed using next-generation sequencing, the map forA.nigrocaudahas longer inter-maker distances, likely because of the large number of repeat sequences that are present inA.nigrocaudagenome. A genome survey was conducted and a preliminaryA.nigrocaudareference genome was assembled with a high percentage of repetitive sequences (58.17%) in this species (data unpublished). Despite these findings, the haplotype and heat maps both indicated that the quality of the map was relatively high. Compared with genetic map based on the low-throughput molecular markers,96.78% marker interval spaces were <5 cm and the density of the map already satisfied the demand of QTL mapping.
A total of 835 721 SLAF tags with a length of 100 bp were generated in this study. Because every marker was a 100-bp genome sequence, they can be transferred between diff erent linkage maps, making them valuable for comparative genomic analysis and genome assembly. The total length of theA.nigrocaudagenome was estimated to be approximately 1.15 Gb (data unpublished), so the SLAF tag sequences account for approximately 0.73% of the total genome sequences. With the SLAF-seq approach, only regions near enzyme sites are sequenced resulting in low coverage. Both these features of SLAF-seq can result in an uneven distribution of markers along the linkage map (Yu et al., 2015).
In a previous report, the genotyping error rate decreased when the read depth was increased. The read numbers for SLAFs had mean coverage of 48.86 fold, 33.94 fold, and 14.06 fold in the male and female parents, and in individuals, respectively. It has been suggested that the error rate can almost be ignored when the read depth is 12 or more (Sun et al., 2013).We removed low read depth markers prior to mapping,and the mean read depths of markers in the map were 65.58 fold for parents and 14.75 fold for individuals.The high read depths of these markers ensured high accuracy of the maker genotyping.
Segregation distortion is a common phenomenon in plants and animals. It is defined as deviation of the genotypic frequency from Mendelian segregation ratios. The deviation can result from biological factors such as gametic selection and environmental factors(Faris et al., 1998; Xu, 2008). It has been shown that segregation distortion markers do not have a large eff ect on QTL mapping, rather they can increase the genome coverage of maps and help in the detection of QTLs (Niu et al., 2017). Segregation distorted markers were found to preferentially cluster in specific LGs and in small segments of LGs (Li et al.,2005; Lallias et al., 2007) in species such as Eastern oyster (Yu and Guo, 2003) and rainbow trout (Young et al., 1998), which is consistent with our finding inA.nigrocauda. In our study, the segregation distorted markers also gathered in some LGs, especially in LG22, the frequency of distortion markers was 69.7%.Meanwhile in LG22, we identified the most QTLs,and all makers in QTL intervals were segregation distortion. Unfortunately, we have not detected any functional genes in these regions. Furthermore, the mapping population size and the number of markers should be increased to locate potential candidate genes for the MAS breeding ofA.nigrocauda.
Diff erent recombination rates between sexes have been reported in many species (Dib et al., 1996;Singer et al., 2002; Ihara et al., 2004), possibly because of meiosis suppression in one of the sexes.Generally, the heterogametic sex (XY or ZW) has a low recombination rate. We found that there were more markers in the female map than in the male map, and the female map was longer. Although no significant diff erence in recombination rate was observed between the sex-specific maps (average female: male=1.03:1), the highest recombination rate ratios (>3.0) were found in LG3 (3.89:1), LG9(3.70:1), and LG23 (3.12:1), and the lowest were found in LG15 (0.44:1) and LG20 (no detection owing to a shared maker). These results may be associated with the diff erences in total lengths and marker numbers between sex-specific maps. Similar findings have been reported in pikeperch (Guo et al.,2018), Japanese flounder (Shao et al., 2015), and common carp (Peng et al., 2016). The mapping population size and the number of markers should be increased to explore whether the recombination rates are diff erent between sexes inA.nigrocauda.
In this study, 48 QTLs (LOD >6) related to the four growth traits were identified. The PVE of these QTLs were 26.9%–49.9%, which is higher than that for many species, such as pikeperch (8.8%–18.5%) (Guo et al., 2018), Asian seabass (10.5%–16%) (Wang et al., 2015), and mandarin fish (12.4%–17.2%) (Sun et al., 2017), but is lower than that for mitten crab(78.5%–95.5%) (Qiu et al., 2017). Additionally, the QTLs for a single growth trait were distributed on diff erent LGs, indicating that genes from diff erent LGs might contribute to the same trait. QTLs for TL and BL were detected on five LGs (LG7, LG9, LG14,LG22, and LG24) and QTLs for BW were only detected on two LGs (LG22 and LG24), reflecting the complexity of these traits. Some QTLs for diff erent traits were located at the same position on the map.For example, QTLs on LG22 and LG24 were common to all four traits, possibly because of the high correlation coeffi cients among the four growth traits or because the four traits are controlled by a few major QTLs in theA.nigrocaudagenome.Overlapping QTLs have been found in species such as bighead carp (Fu et al., 2016) and Asian seabass(Xia et al., 2014). These findings indicate that several genes associated with growth traits are present in the overlapping QTL regions. These regions should be investigated further to identify candidate genes associated with growth traits.
5 CONCLUSION
We constructed the first high-density genetic map ofA.nigrocaudaand identified 48 QTLs for growthrelated traits in this aquaculture species. The next step will be the validation of the linked QTLs across families and populations. This QTL information will be useful in molecular breeding programs to obtainA.nigrocaudawith improved quantitative growth traits.
6 DATA AVAILABILITY STATEMENT
All data generated and/or analyzed during the study are available from the corresponding author on reasonable request.
杂志排行
Journal of Oceanology and Limnology的其它文章
- Using statolith shape analysis to identify five commercial Loliginidae squid species in Chinese waters*
- On microbial community of Pyropia haitanensis by metagenomic analysis*
- Paragnomoxyala papillifera sp. nov. (Nematoda:Monhysterida) from the Bohai Sea, China*
- Affi nities of freshwater “Chantransia” stage algae(Rhodophyta) from China based on molecular and morphological analyses*
- Morphology and molecular phylogeny of three species of Coolia (Dinophyceae) from Hainan Island, South China Sea*
- Eff ect of polystyrene microplastics and temperature on growth, intestinal histology and immune responses of brine shrimp Artemia franciscana*
