Using statolith shape analysis to identify five commercial Loliginidae squid species in Chinese waters*
2021-06-15JianzhongGUODanLIUChiZHANGYongjunTIANZhixinLI
Jianzhong GUO, Dan LIU , Chi ZHANG, Yongjun TIAN,2,3,**, Zhixin LI
1 Fisheries College, Ocean University of China, Qingdao 266003, China
2 Frontiers Science Center for Deep Ocean Multispheres and Earth System(FDOMES), Ocean University of China, Qingdao 266100, China
3 Laboratory for Marine Fisheries Science and Food Production Processes, Qingdao National Laboratory for Marine Science and Technology, Qingdao 266071, China
Abstract Identification of squids in the family Loliginidae is a time-consuming exercise because of the highly overlapping distributions of species and their overall similarity (fin shape and size, sucker ring dentition, and color). Identifying squid based on statolith morphology is considered more accurate than identifying species based on beaks or gladius morphology. We report and compare the statolith shape of five commercially Loliginidae squid ( Uroteuthis ( Photololigo) duvaucelii, U. edulis, U. chinensis, Loliolus beka,L. japonica) to determine how well these structures discriminate species. Based on statolith morphology,variation in the lateral and dorsal domes enables an 84.8% success rate at classifying species. Environmental factors correlate with statolith shape, and for vertically migrating squid, statolith relative size decreases with increased depth of habitation. Statolith morphology can be used to eff ectively and accurately identify species of Loliginidae squid occurring in Chinese waters, and may prove valuable for identifying and managing squid resources.
Key word: statolith shape analysis; Loliginidae squid; fishery management; Chinese waters
1 INTRODUCTION
Species identification is a prerequisite for analyzing fishery resources; the process aims to identify individuals which are completely or partially discrete from congeners in space or time (Cadrin et al., 2014);it can eff ectively control overfishing and improve sustainable fisheries development—both of which are important for scientific assessment and management of fishery resources (Crandall et al., 2000; Cadrin and Silva, 2005). Species identification is also important to understand biological relationships and plays an important role in the protection of biodiversity and maintenance of global ecosystem stability. Species identification methods mainly include morphological and molecular markers (Ren et al., 2015). Cephalopods are characterized by rapid growth, short lifespans,high turnover rates, and strong phenotypic plasticity(Anderson and Rodhouse, 2001; Pecl et al., 2004;Pecl and Jackson, 2008); they are recognized as major components of many marine ecosystems (de la Chesnais et al., 2019). Cephalopod identification traditionally relies on examination of soft and hard tissues (such as fin shape and size, sucker ring dentition, tentacle and club morphology, and statolith morphology) (Dong, 1993). However, some morphological characters commonly used in identification are lost or damaged during fishing, and are aff ected by specimen freshness and life history characteristics, thereby complicating species identification (Chapela et al., 2003; Goud and De Heij, 2012). Cephalopod hard tissues (such as statoliths, gladius, and beaks) are more suitable andeff ective for species identification than soft tissues(such as fins and tentacles) due to their relative stability (Borges, 1995; Hu et al., 2017). Characters that enable accurate identification are of value for managing cephalopod populations.

Table 1 Sampling information of the five commercial Loliginidae squid species
China’s coastal seas and ecosystems are overexploited, and its waters are warming rapidly(Belkin, 2009). Local catches of coastal cephalopods,especially squid, have increased since the 1990s(Pang et al., 2018). Squids of the family Loliginidae are the main commercial targets of cephalopod fisheries (Díaz-Santana-Iturrios et al., 2019); they are typically caught by bottom trawl, squid jig, trap net,or purse seine net (Jereb and Roper, 2010; Arkhipkin et al., 2015). The population dynamics of these species and their dominance vary (Pang et al., 2018).Accurate species identification will contribute to improved understanding of the population dynamics of species, and facilitate sustainable development and fishery management.
Loliginid squid identification is traditionally based on the characteristics of horny rings encircling arm suckers (Dong, 1988). However, these rings are easily lost, and other traditional discriminating features(such as shape and size of fins, mantle, color, etc.)often overlap among species, making identification diffi cult and time-consuming (Jereb and Roper, 2006).The potential of hard tissues, particularly the beaks(Yang et al., 2012; Jin et al., 2017, 2018) and statoliths(Lombarte et al., 2006) to assist in identification has been examined. Because the taxonomy and distribution of main loliginid taxa in China’s seas are not well known, a survey ofloliginid statoliths would determine if these structures are of systematic value.
Statoliths, paired calcareous structures composed of aragonite and calcite, are located in the cartilaginous cranium of cephalopods (Arkhipkin, 2005). Their morphology is of taxonomic value, and they have been used to identify squid more accurately than the gladius and beaks (Clarke, 1978). The shape of the statolith is also physiologically informative, which makes it possible to reconstruct aspects of a squid’s behavior and movement (Arkhipkin, 2005). Their shape is also phylogenetically informative and is thought to be related to adaptive capacity in connection with mechanoreception (Lombarte et al., 2006).Advanced image processing techniques (Fourier analysis, wavelet transformation, and curvature scalespace analysis) enable quantitative comparison of shape contours (Lombarte et al., 1997; Parisi-Baradad et al., 2010; Reig-Bolaño et al., 2010). Fourier analysis is suitable for capturing information on statolith shape to compare between individuals (Smith et al., 2002; Green et al., 2015; Zhao et al., 2017).Analysis of statolith shape could is of great significance for cephalopods study and provide an alternative character for large-scale rapid identification, which will be routine work in studies of cephalopod biology.
Eight loliginid species occur in China’s coastal waters, of which five (Uroteuthis(Photololigo)duvaucelii,U.edulis,U.chinensis,Loliolusbeka, andL.japonica) with tropical and temperate distributions are commercially exploited (Chen et al., 2013). The high overlap in habitat distribution and morphological characteristics similarity of these species complicates their identification (Sin et al., 2009; Jin et al., 2017),which in turn hampers resource management and development. In this study, the five commercial Loliginidae squid species were identified using statolith shape analysis, the aim was to provide an eff ective identification method for Loliginidae squid species by comprehensive statolith comparison of these five species from the Chinese waters, covering their distribution range. In addition, the possible influence of genetic and environmental variables on statilith morphology was appraised preliminarily.
2 MATERIAL AND METHOD
2.1 Sample collection
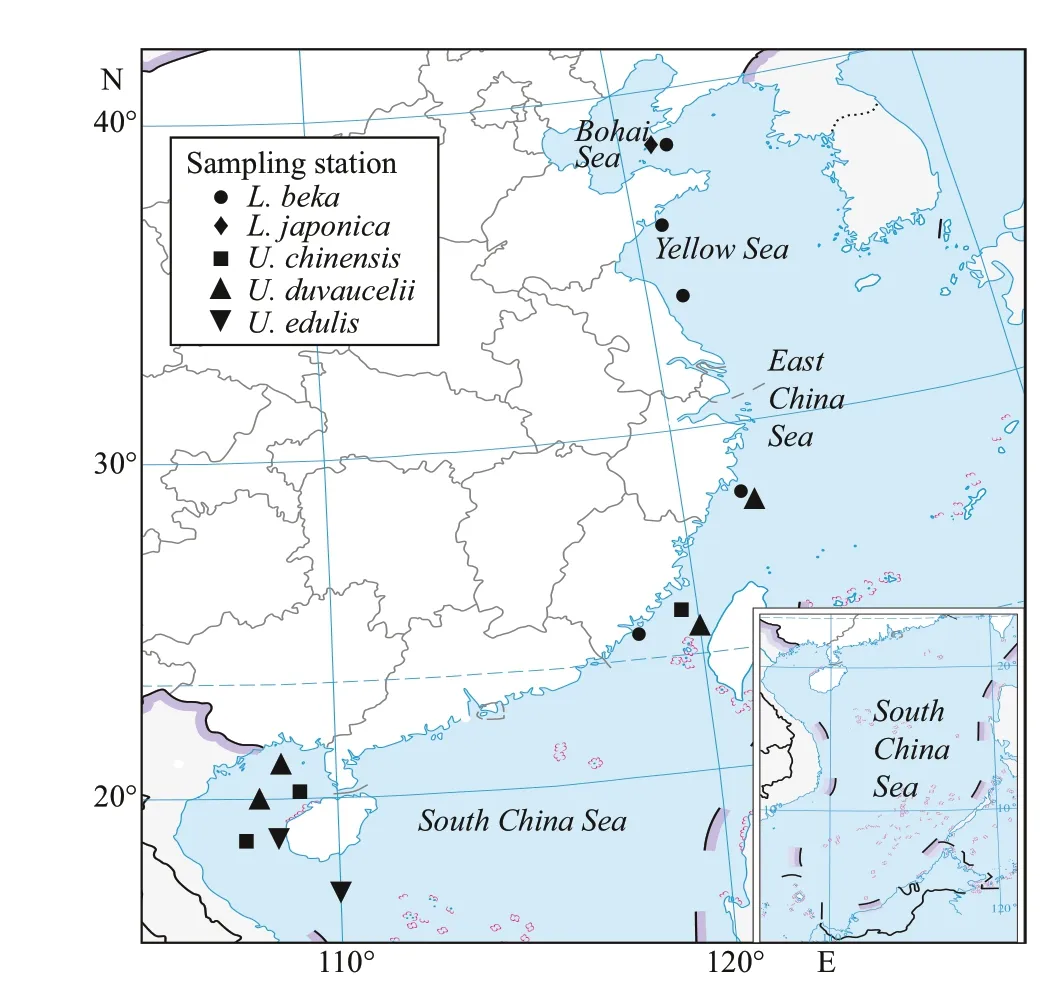
Fig.1 Sampling station of Loliginidae squid species in Chinese waters
Squids collected from April to August 2019 off the coast of China (Fig.1; Table 1) were randomly selected from the survey samples or local commercial landings,caught by bottom trawl, light luring or squid jig vessel. All of the samples were stored ice-frozen and transported to the laboratory for biological experiments. Species identification was based on anatomical characters, such as sucker ring dentition,following Dong (1988) and Okutani (2015). Dorsal mantle length (DML, mm) and weight (0.1 g) were measured for each individual, and the developmental stage of the gonad was visually appraised. Statoliths were extracted, cleaned with ultrasonic cleaner, and preserved in 75% ethanol.
2.2 Statolith imaging and shape analysis
To exclude allometric eff ects, only maturing individuals (gonad stages Ⅲ and Ⅳ) were selected for statolith shape analysis. DML range was also restricted to an appropriate range for each species, to minimize statolith variability caused by size eff ects.Because the shape and position of statoliths in loliginids does not diff er significantly between males and females, and morphological parameters ofleft and right statoliths are very similar in microstructural appearance, one statolith from each pair was randomly chosen for photography and image analysis (Natsukari et al., 1988; Moustahfid, 2002). Intact statoliths were placed with their posterior side facing up and their rostrum oriented horizontally (Fig.2). A stereo microscope fitted with a video camera (Nikon SMZ18) took statolith images under reflected light on a black background.
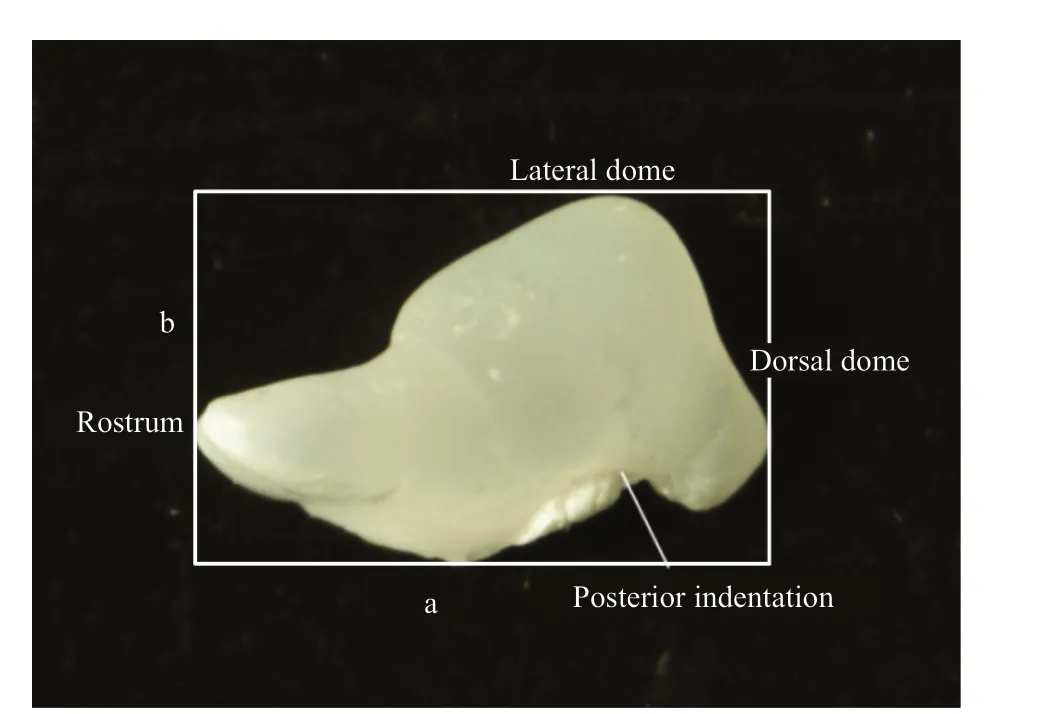
Fig.2 Statolith photomicrograph and morphometric measurements of Loliginidae squid
Images were analyzed using an R package “shapeR”designed specifically for otolith/statolith shape analysis (Libungan and Pálsson, 2015). The package“shapeR” has built-in functions enabling users to extract statolith outlines from images, visualize and generate shape data, and transform outlines into independent Normalized Elliptic Fourier or Discrete Wavelet coeffi cients. In this study, 45 Normalized Elliptic Fourier coeffi cients were generated for shape analysis. Statolith length, width, and area were also measured by “shapeR,” and thenSw/Sl(statolith width/length) and standard statolith area (Ssa=1 000×(statolith area/DML2)) were calculated.
2.3 Statistical analysis
A one-way ANOVA detected diff erences among species inSw/SlandSsa; significant results were subjected to a Tukey’s Honest Significant Diff erence(HSD) test. Random forest (RF) was used to classify species because it: 1) outperforms other classifiers; 2)does not require any distributional assumption and is independent of predictor variables; and 3) does not overfit (Pérez-del-Olmo et al., 2010; Zhang et al.,2016). The RF algorithm selects bootstrap samples from the data, each of which contain 63% of original observations, to generate a classification (Strobl et al.,2009). The remainder are referred to as OOB (out-ofbag) observations; these represent an independent bootstrap data sample to fit each tree and unselected data set in the bootstrap sample as a test set for providing a cross-validation estimate of generalization errors to determine their unbiased classification rate(Breiman, 2001). RF also provides a global measure of the contribution of each variable by calculating thedecrease in a Gini index (GI), which ranges from 0(all variables contribute equally to the RF classifier)to 100 (a single variable contributes 100% to the RF classifier). Two thousand trees were built to ensure that each individual was predicted several times. The mean decrease in GI was calculated to measure the contribution of these variables to the optimal classifier.A visual shape similarity among species was plotted by graphical analysis of models using multidimensional scaling (MDS). The RF package R.5.03 was used for model development.

Table 2 Number of statoliths for the analyzed five Loliginidae species and Tukey test comparisons
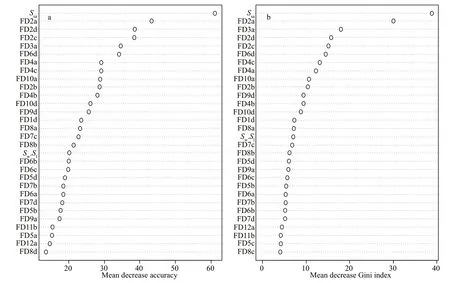
Fig.3 The mean decrease in Gini index of the first 30 variables contributing to the optimal classification
3 RESULT
TheSw/Slratio varied significantly across species(Table 2), with the highest values observed forU.edulisandU.chinensis, and the lowest forL.beka.Ssaalso diff ered significantly among species (Table 2),being highest inL.japonica, and lowest inU.chinensisandU.duvaucelii. An intermediate value was observed inU.edulis.
The RF model constructed bySw/Sl,Ssa, and Fourier coeffi cients correctly classified 84.8% ofindividuals(Table 3) to species, withSsamost accurately classifying species (Fig.3). The highest classification success was recorded forL.beka, and the lowest forU.chinensisandL. japonica. The MDS plot depicts relationships between taxa, with three apparent‘branches’ (Fig.4). Of the five species,L.bekaandL.japonicaeach represent a single branch, and the threeUroteuthisspecies a third;U.duvauceliiwas the most variable of the threeUroteuthisspecies.Reconstructed average outlines reveal shape diff erences among these five species (Fig.5), for which the main diff erences occur in the lateral and dorsal dome areas:U.chinensisandU.edulishave a raised lateral dome,L.bekaandL.japonicahave apointed dorsal dome, and an intermediate morphotype occurs inU.duvaucelii.

Table 3 Out-of-Bag (OOB) estimation matrix of the random forest among the five Loliginidae species
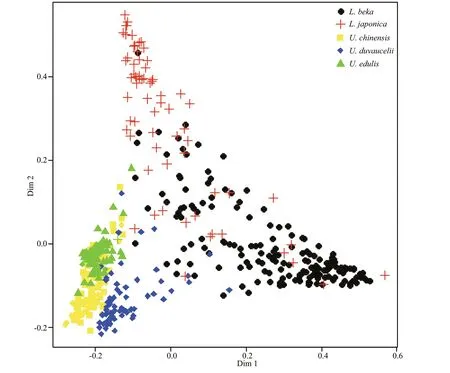
Fig.4 MDS plot of statolith morphology for the five Loliginidae species
4 DISCUSSION
Statolith morphology is regarded as more reliable for recent and fossil species identification than the beaks or gladius (Clarke, 1978). By introducing shape variables (Sw/SlandSsa) and applying a more effi cient classification method (random forest), we achieve a higher classification success rate than Jin et al. (2017)and higher classification rate forL.bekaandU.duvaucelii. This suggests that statoliths have considerable value for species and population identification. Many reasons aff ect classification success rate, such as sample size, measurement errors,and data processing methods. Because of diff erences in studied species, sea areas, and measurement methods, comparing results between studies is diffi cult. More basic statolith data should be accumulated, statolith measurements and descriptions should be standardized, and new technologies (and software) capable of analyzing statolith shape should be exploited to better understand the merits of statolith morphology for species identification. Statolith shape diff ers within a species and can be used for stock identification (Fang et al., 2014; Green et al., 2015).Because our samples were collected throughout the distribution of these species in coastal China, our data also include population-level variation. Loliginid squid can be rapidly and reliably identified using statolith shape, and this technique can be used for more eff ective fishery management.
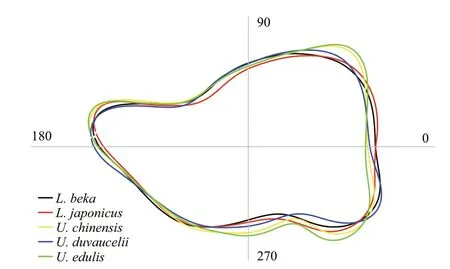
Fig.5 Reconstructed statolith outlines for the five Loliginidae species
The shape of statoliths, like those of fish otoliths, is related to phylogeny (Clarke, 1978; Dommergues et al., 2000); these structures may be adapted for mechanoreception purposes (Arkhipkin and Bizikov,2000; Arkhipkin, 2003). Statoliths of near-bottom species are larger than those of pelagic species of the same body size (Arkhipkin and Bizikov, 2000;Arkhipkin, 2003)—a trend reported also for fishes(Lombarte and Cruz, 2007). For vertically migrating squid, relative statolith size decreases with increased habitat depth, consistent with the expectation that inactive species need larger statoliths than active species to detect movement accelerations (Hanlon and Messenger, 1996). The two deeper-dwellingU.chinensisandU.edulismigrate further through the water column than the three other taxa. Of the three inshore species,U.duvauceliilives in warmer waters and has a smallerSsathanL.bekaandL.japonica,whileL.japonica, a cold water species, has the highestSsa. Further study on relationships between statolith size and mantle length is needed to understand species ecology, considering the extensive distribution of cephalopod species globally.
Discrimination of these five Loliginidae species reveals a likely genetic basis to statolith shape, as the taxa clustered into two groups, namely the generaUroteuthisandLoliolus, consistent with phylogenetic relationships revealed by COI gene sequences (Ho,2005; Du, 2016). Genetic studies also clearly demonstrateU.chinensisandU.edulisare diff erent species (Sin et al., 2009). Of the threeUroteuthistaxa,U.duvauceliisdiff ers more from the other twoUroteuthisspecies than they diff er from each other,which is also consistent with phylogenetic relationships whereU.duvauceliidiverges from a clade comprisingLoliolusand otherUroteuthisspecies (Jiang et al., 2018).
Statolith shape in five Loliginidae species demonstrated consistent determinants compared with fish otoliths, namely environment induces an overall change in shape, and genetically induced changes locally (Vignon and Morat, 2010). The good performance of shape variables (Sw/SlandSsa)associated with ecological characteristics suggests these variables would be valuable for species and population identification. Because of the rapid response of cephalopods to changing environmental conditions, studies on the relationship between statolith shape and species life histories would improve understanding of population structure,especially for species with wide distributions or multiple ecotypes.
5 CONCLUSION
Five commercially Loliginidae squid species(Uroteuthis(Photololigo)duvaucelii,U.edulis,U.chinensis,Loliolusbeka, andL.japonica)inhabiting the coastal waters of Chinese waters can be diff erentiated by comprehensively comparing their statoliths using a statolith shape analysis. A higher classification success rate of 84.8% was obtained.Statolith relative size decreases with increased habitat depth for vertically migrating squids, and environment induces an overall change in shape and genetically induced changes locally. We report statolith shape to be of value in species identification when assessing impact of single species management systems or development of multi-species fisheries. Identification of squids by statolith shape analysis is also fast and accurate, and may assist with future development and management of Loliginidae squid fisheries in Chinese waters.
6 DATA AVAILABILITY STATEMENT
The data generated or analyzed during the current study are available from the corresponding author on reasonable request.
7 ACKNOWLEDGMENT
We thank Yanyu CHEN (Beijing Normal University-Hong Kong Baptist University United International College) and Haozhan WANG (Sansha Marine Environment Monitoring Center Station,State Oceanic Administration) for their great assistance in sample collection.
杂志排行
Journal of Oceanology and Limnology的其它文章
- Steady increase in water clarity in Jiaozhou Bay in the Yellow Sea from 2000 to 2018: Observations from MODIS*
- Phylogenetic diversity and bioactivity of culturable deepsea-derived fungi from Okinawa Trough*
- Allelopathic eff ects of mixotrophic dinoflagellate Akashiwo sanguinea on co-occurring phytoplankton: the significance of nutritional ecology*
- Investigation of the decline of Ulva prolifera in the Subei Shoal and Qingdao based on physiological changes*
- Effi ciency of phosphorus accumulation by plankton,periphyton developed on submerged artificial substrata and metaphyton: in-situ observation in two shallow ponds*
- Petroleum exploitation enriches the sulfonamide resistance gene sul2 in off shore sediments
