Dissipative Kerr solitons in optical microresonators with Raman effect and third-order dispersion*
2021-05-24ChaohuaWu吴超华ZhiweiFang方致伟JintaoFan樊景涛GangChen陈刚andYaCheng程亚
Chaohua Wu(吴超华), Zhiwei Fang(方致伟), Jintao Fan(樊景涛),‡, Gang Chen(陈刚),4, and Ya Cheng(程亚)
1State Key Laboratory of Quantum Optics and Quantum Optics Devices,Institute of Laser Spectroscopy,Shanxi University,Taiyuan 030006,China
2Collaborative Innovation Center of Extreme Optics,Shanxi University,Taiyuan 030006,China
3The Extreme Optoelectromechanics Laboratory(XXL),School of Physics and Materials Science,East China Normal University,Shanghai 200241,China
4Collaborative Innovation Center of Light Manipulations and Applications,Shandong Normal University,Jinan 250358,China
Keywords: dissipative Kerr soliton,frequency comb,Raman effect,dispersive wave
1. Introduction
Dissipative Kerr cavity solitons (DKS) are selflocalized optical pulses that can be generated in nonlinear microresonators.[1–3]They come from a double balance between nonlinearity and dispersion as well as the parametric gain and cavity losses, which result in a stable pulse circulating within the cavity.[4]Recently, DKS have attracted significant research interest in the context of microresonatorbased frequency comb generation, which have been demonstrated as a promising candidate for numerous applications,such as telecommunications,[5,6]frequency synthesis,[7]dualcomb spectroscopy,[8,9]astro-spectrometer calibration,[10,11]and optical atomic clocks.[12]These DKS-based frequency combs have been demonstrated in microresonators made of silica,[13–15]magnesium fluoride,[3,16]lithium niobate,[17]and silicon nitride.[18–20]In addition, such driven nonlinear microresonators are attractive platform for exploring spatiotemporal light localization and the dynamics of nonlinear systems.[21,22]
Typical description of the dynamics of cavity solitons is the mean-field Lugiato–Lefever equation(LLE)which usually excludes higher-order dispersion and nonlinear terms.[23,24]However in realistic system,higher-order effects are inevitable and can alter soliton properties significantly under certain conditions. Specifically, in the presence of higher-order dispersion, optical solitons can emit dispersive waves (soliton Cherenkov radiation), which provides a path to generate coherent broadband frequency combs.[25–29]This radiation process induces soliton recoil which causes a frequency shift in the spectral centre of the soliton. Furthermore, femtosecond solitons in microresonators have intense peak power and ultrashort duration such that, in principle, higher-order nonlinear effects like the self-steeping effect and intrapulse Raman scattering[30–32]can be excited. It has been demonstrated that soliton interaction with the Raman effect can induce soliton self-frequency redshift for a microresonator DKS(frequencylocked Raman soliton).[33–36]Thus, it is interesting to study the dynamics of cavity soliton and comb generation in the presence of both higher-order dispersion effects and Raman effect.
Here,we theoretically investigate the influence of Raman effect and the third-order dispersion on the dynamics of DKS.Specifically,we obtain approximated analytical expression of the temporal soliton drift and frequency shift based on the moment analysis method,which agrees with the numerical results according to directly solving the modified LLE.Furthermore,we predict the compensation and enhancement of the temporal and frequency shift in the presence of both the Raman effect and the third-order dispersion.
This work is organized as follows. Section 2 gives the mean-field normalized LLE. Section 3 describes the moment analysis method used in this work.Section 4 discusses the cavity soliton temporal drift and frequency shift under the Raman and the third-order dispersion effects.
2. Mean-field model
We describe the comb generation dynamics (schematically represented in Fig. 1) using the modified LLE, which incorporates terms of higher-order dispersion and the Raman effect. The equation can be written as[30,34,36,37]
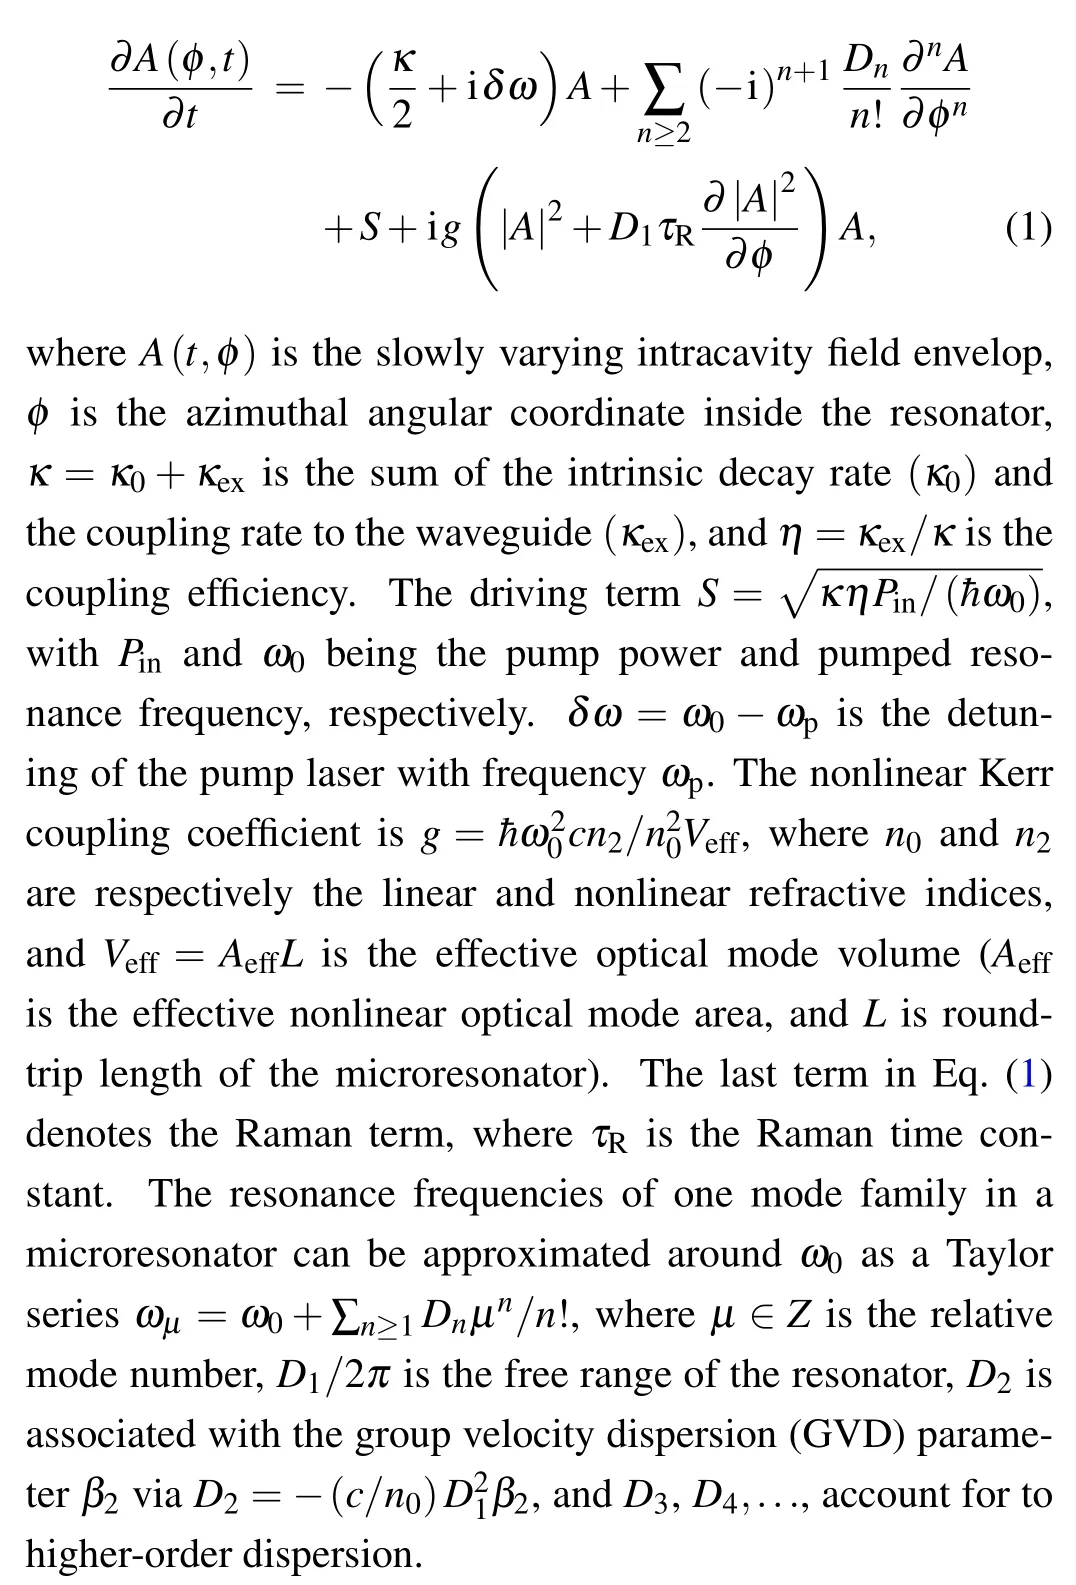

Fig.1. Schematic diagram of Kerr optical frequency comb generation using nonlinear microresonator with χ(3)–Kerr nonlinearity.
For simplicity, we employ the following dimensionless form of Eq.(1):

3. Moment analysis
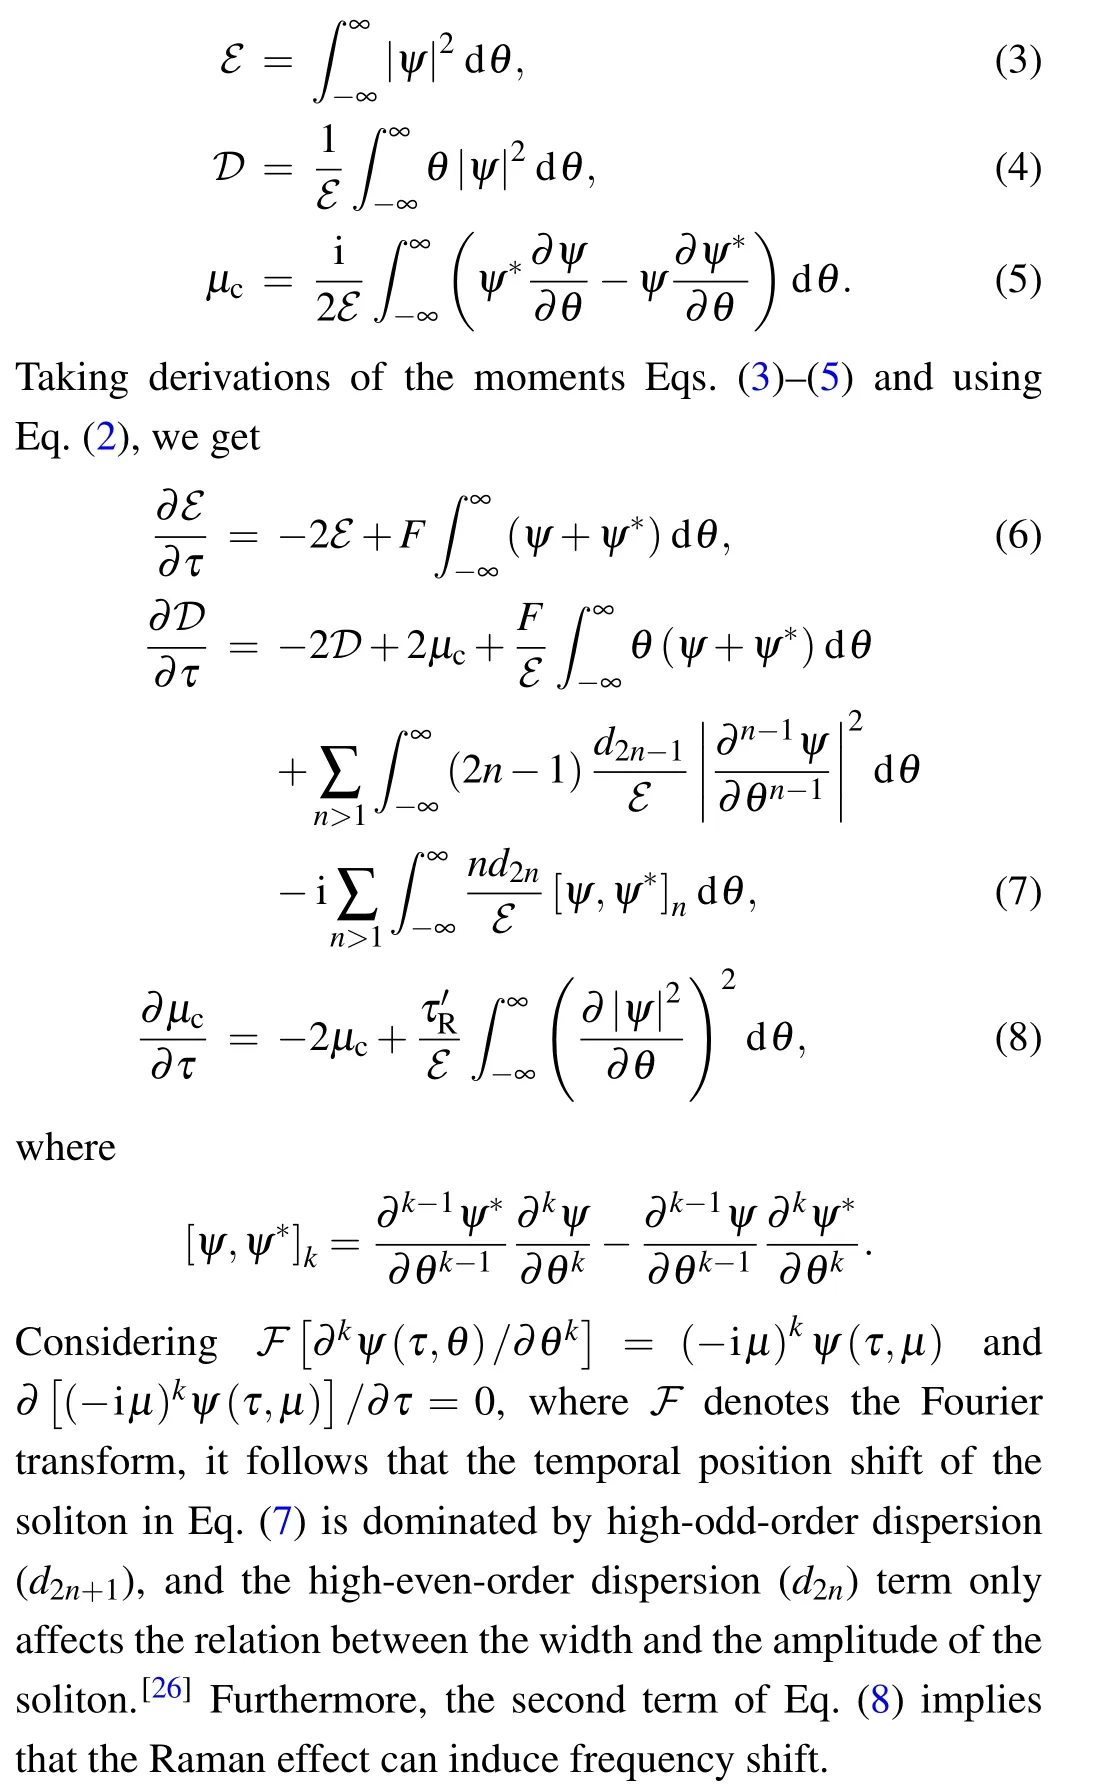
To quantitatively understand the dynamics of the DKS described by Eq. (2), we first use the method of moments to search the approximate soliton solutions. The moment analysis method treats the pulse as a particle,under which the energy ℰ, position D, and the spectral centre mode number µcare given by[34,36]
4. Raman and third-order dispersion perturbation


Fig. 2. (a) Temporal evolution of the cavity soliton for ζ =3, F =2, and d3 =τ′R =0. (b) Temporal and (c) spectral envelopes of the final stable soliton.

and the temporal shift of the soliton is

Here we have assumed sech(πµcτs/2)cosϕ ≈1. In Figs.3(a)and 3(b),by numerically solving Eq.(2),we plot the temporal and spectral evolutions of cavity soliton versus slow time τ,respectively,and the final steady state temporal and spectral envelops are shown in Figs.3(c)and 3(d). It is clear that Raman effect induces a temporal deceleration and spectral redshift to the soliton. Moreover, equation(14) shows that the temporal shift DR(τ)induced by the Raman effect varies linearly with τ [see Fig.3(e)]. In Fig.3(f)we plot µc,Rversus τ′R. The analytical results agree well with the numerical calculation for small τ′R. As τ′Ris increased,the deviation will increase.

Fig. 3. Temporal (a) and spectral (b) evolutions of the cavity soliton for τ′R =0.04. Panels (c) and (d) show the temporal and spectral envelopes.The blue curves in panels(c)and(d)correspond to Figs.2(b)and 2(c),respectively. Panel (e) shows the temporal delay of the soliton versus slow time τ with τ′R =0.04 and panel (f) shows the frequency shift versus τ′R with τ =30. The red dashed lines correspond to numerical results by solving Eq.(2)and the black solid lines are the solutions of Eqs.(13)and(14),respectively. The other parameters are the same as those in Fig.2.
We then study the impacts of the third-order dispersion(d3/=0,τ′R=0). Equation(11)shows that the third-order dispersion influences the temporal position of the soliton and the position shift is

This is clarified in Fig.4(a1),which plots the temporal evolution dynamics of soliton with d3=0.1. Furthermore,we plot the position shift DTversus time τ (with d3=0.1)and d3(at time τ=50),respectively.It is found that results from Eq.(15)(black solid lines)agrees with the numerical data(red dashed lines). Compared with the unperturbed case [Figs. 2(b) and 2(c)],the third-order dispersion induces soliton tail oscillation,as shown on the top of Fig.4(a1).This originates from the dispersive wave excitation via Cherenkov radiation process. The corresponding spectrum of such a perturbed soliton exhibits an additional local maximum (dispersive wave), as shown in Fig.4(a2). In addition,the sign of d3determines the direction of soliton movement and the side of dispersive wave,as shown in Figs.4(b1)and 4(b2)with d3=−0.1.

Fig. 4. Panels (a1) and (a2) [(b1) and (b2)] are the temporal and spectral evolutions of the cavity soliton for d3=0.1[d3=−0.1],respectively. The upper graph in panels(a1)and(b1)show the corresponding temporal profile of the stable evolution soliton. Panels(c)and(d)show the temporal delay of the soliton versus time τ with d3=0.1 and Raman constant d3 with τ=50,respectively. The red dashed lines correspond to numerical results by solving Eq.(2)and the black solid lines are the solutions of Eq.(15). The other parameters are the same as those in Fig.2.

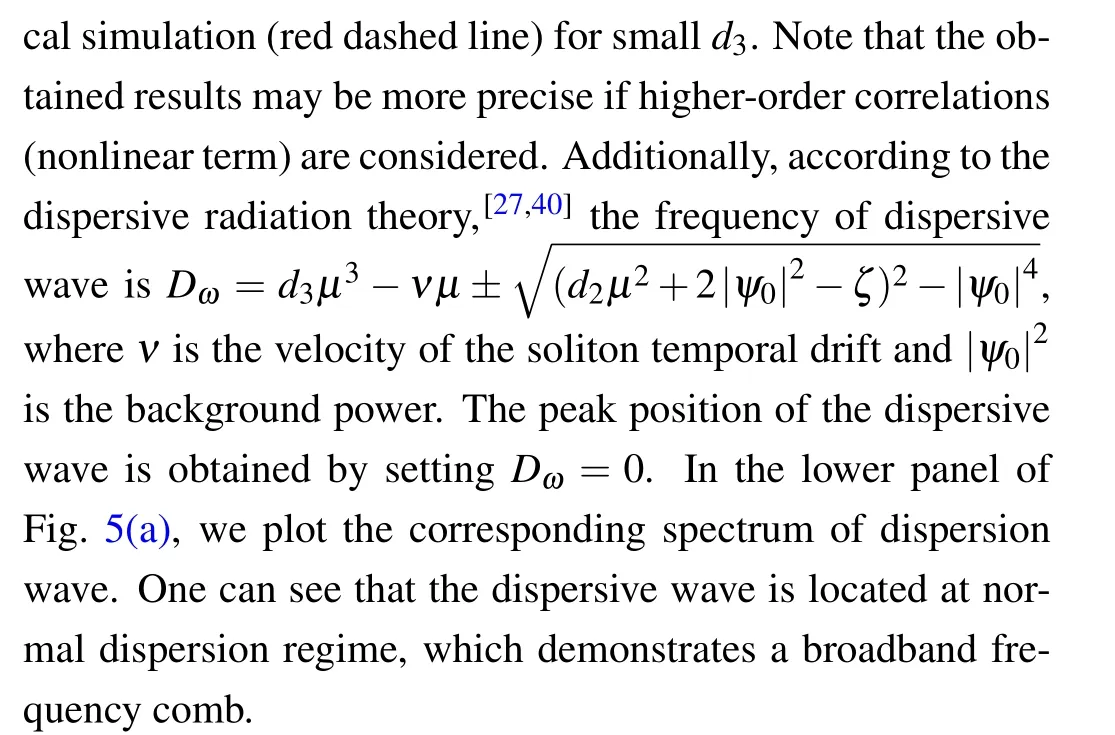

Fig. 5. (a) The spectral envelop (upper panel) and dispersive wave curve(lower panel) with d3 =0.15. The red dashed line corresponds to the envelop in Fig. 2(c). In the dispersive wave curve, regions with positive curvature have anomalous group velocity dispersion (GVD) and regions with negative curvature have normal GVD.Panel(b)shows the soliton recoil versus d3 based on Eq.(17)(black solid line)and numerical results(red dashed line). The other parameters are the same as those in Fig.2.
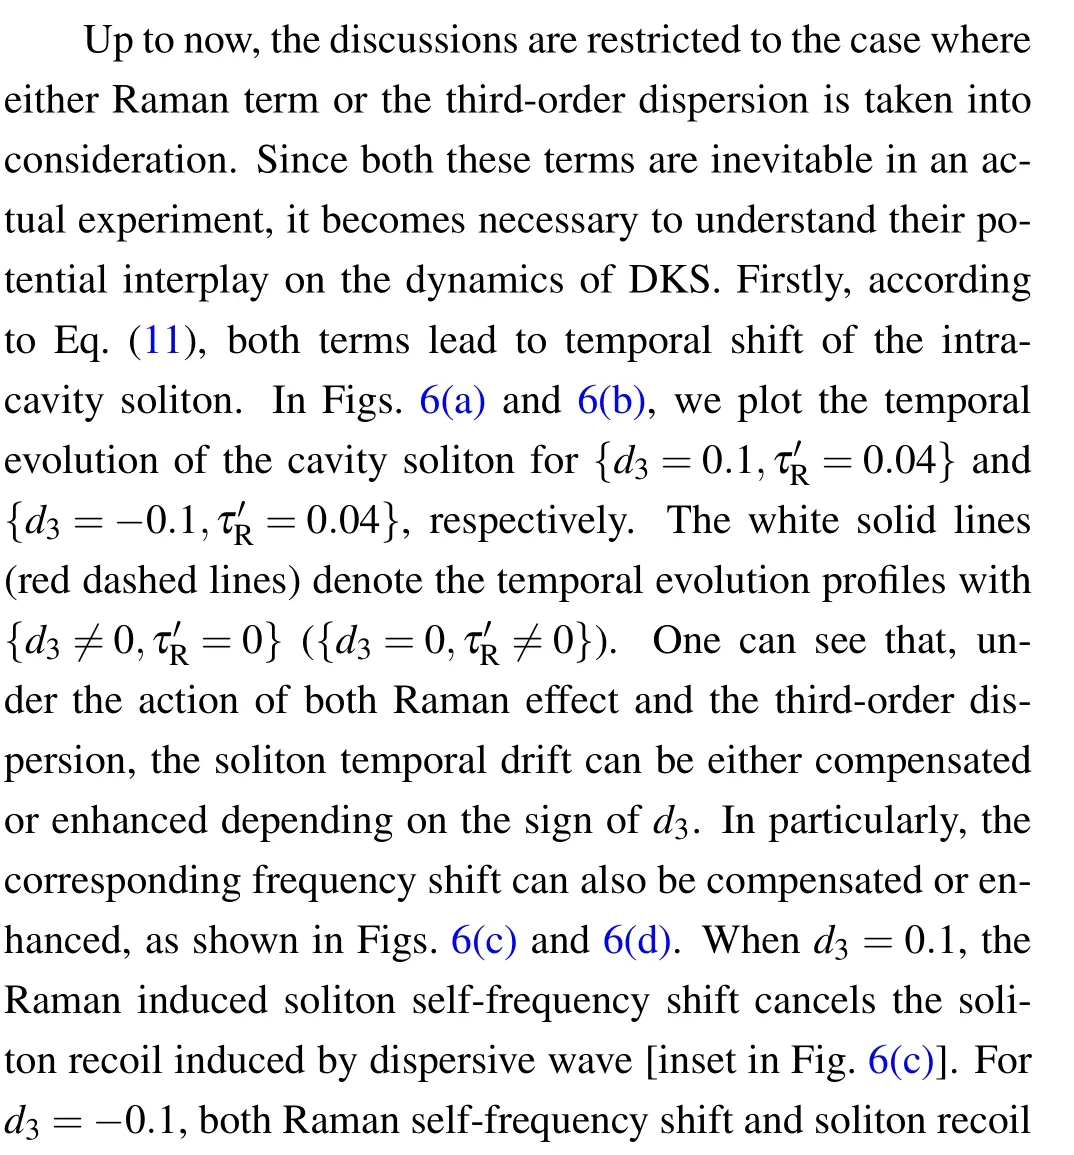


Fig.6. Panels(a)and(b)show the temporal evolution of the cavity soliton for {d3=0.1,τ′R=0.04} and {d3=−0.1,τ′R=0.04}, respectively. The white solid(red dashed)lines represent the temporal evolution profiles with only d3 (τ′R). Panels(c)and(d)are the corresponding spectra in panels(a)and (b), respectively, and the red dotted–dashed lines denote the spectral profiles with{d3/=0,τ′R=0}. The other parameters are the same as those in Fig.2.
5. Conclusion
In summary,we have studied the role of the Raman effect and the third-order dispersion in cavity soliton and frequency comb generation. Based on the mean-field LLE,we used the moment analysis method to describe the dynamics of cavity soliton. Particularly,we obtained approximated analytical expression for the temporal soliton drift and frequency shift under the Raman effect or the third-order dispersion. The analytical results for small Raman shock time and the third-order dispersion coefficient agree with full simulation by solving LLE numerically using the split-step Fourier method. Finally, we predict the cancellation and enhancement of the temporal drift and frequency shift in the presence of both the Raman effect and the third-order dispersion.
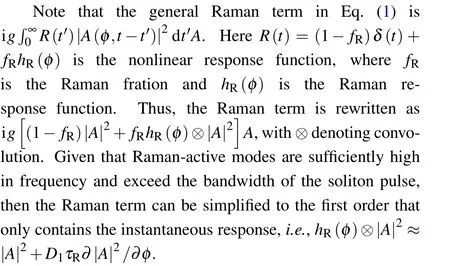
Appendix A:Raman effect
猜你喜欢
——读《用生命践行诺言》有感
杂志排行
Chinese Physics B的其它文章
- Corrosion behavior of high-level waste container materials Ti and Ti–Pd alloy under long-term gamma irradiation in Beishan groundwater*
- Degradation of β-Ga2O3 Schottky barrier diode under swift heavy ion irradiation*
- Influence of temperature and alloying elements on the threshold displacement energies in concentrated Ni–Fe–Cr alloys*
- Cathodic shift of onset potential on TiO2 nanorod arrays with significantly enhanced visible light photoactivity via nitrogen/cobalt co-implantation*
- Review on ionization and quenching mechanisms of Trichel pulse*
- Thermally induced band hybridization in bilayer-bilayer MoS2/WS2 heterostructure∗
