Transition parameters of Li-like ions(Z=7–11)in dense plasmas*
2021-05-24XiangFuLi李向富LiPingJia贾利平HongBinWang王宏斌andGangJiang蒋刚
Xiang-Fu Li(李向富), Li-Ping Jia(贾利平), Hong-Bin Wang(王宏斌), and Gang Jiang(蒋刚)
1College of Electrical Engineering,Longdong University,Qingyang 745000,China
2College of Science,Xi’an University of Posts&Telecommunications,Xi’an 710121,China
3Institute of Atomic and Molecular Physics,Sichuan University,Chengdu 610065,China
Keywords: Li-like ions,energy levels,transition energies,transition probabilities
1. Introduction
In dense plasma environments, the interaction between the electrons with atomic nucleus is screened, as well as that between electrons.Electronic structures of atomic systems immersed in dense plasma environment may be remarkably different from their corresponding isolated candidates.[1]Many interesting phenomena have been observed in dense plasmas,such as spectral line shift, broadening of spectral lines, line merging,and so on.[2]Apart from its fundamental importance,the study of atomic structure in plasma environments has practical implications in many fields of science, such as atomic physics in dense plasmas including the famous ionization potential depression(IPD),inertial confinement fusion research,laser produced plasmas,astrophysics,plasma equation of state(EOS),plasma fluid,particle simulations and opacity.[3–5]
Although several dense plasma experiments[6–10]have been performed recently by intense short-pulse laser irradiation, the results of these experiments are controversial. The measured IPDs of experiment[6]are in line with the description of Stewart and Pyatt model,[11]but that of experiments[7–9]show that Stewart and Pyatt model[11]underestimates the IPD,and are more consistent with Ecker–Kr¨oell model.[12]The proof-of-principle experiment[10]performed at LCLS shows that it is still need highly precise measurements of the ionization potential to end of the controversy. This experimentally controversy have motivated several more advanced theoretical model approaches,[13–20]but so far,no final convergence has been reached.[21]
Lithium-like ions in plasma are a few of the most abundant ionic species for specific temperature and density attainable in the laboratory.[22]Various spectroscopic properties of Li-like ions have significant importance in astrophysics due to evidence of high abundances of these ions in different astronomical systems like active galactic nuclei, x-ray binaries,quasars, and hot plasmas.[23,24]For such small-sized atoms,allowed and forbidden transitions with sufficient intensity are used as diagnostic tools of tokamak plasmas.[25–27]For example, there is long literature on the applications of the isolated resonance lines having wavelength 1238.82 ˚A and 1242.80 ˚A for N4+,and 1031.91 ˚A and 1037.61 ˚A for O5+.[28]
The situation mentioned in the previous paragraph clearly requires extensive and accurate theoretical study of atomic structures. Many interesting results about Li-like ions immersed in plasmas have been reported.[29–39]It was found that for Li-like C3+,N4+,and O5+ions immersed in Debye plasma environment, the oscillator strengths associated with 1s22s–1s22p transitions increase, the transition probabilities associated with 1s22s–1s23d E2 transitions decrease, as the screening strength increases.[33]Base on the code of steady K-shell model for collision radiative balance, Yu et al.[34]found that Li-like satellite intensity ratio is density sensitive and temperature unsensitive. The spectral lines corresponding to Δn=0 transitions (Here n is the principal quantum number of an atomic state, and Δn = 0 means that the principal quantum numbers of the two atomic states for one transiton are equal to each other.) for Li-like C3+and Al10+ions show blueshift,whereas the lines associated to Δn/=0 show red-shift.[35]These atomic properties reported in the references mentioned above are general in both weakly and strongly coupled plasmas.
However, Das et al.[40]found that Δn=0 transitions of Li atom and Li-like Ca17+and Ti19+ions in Debye plasmas,show blue shifts at higher screening lengths and red shifts at lower screening lengths due to the presence of the screenings in the electron–electron interactions. As far as we known,this interesting phenomenon for Debye plasmas was rarely reported, and no cases reported for dense plasmas. The transition properties of Li-like ions(Z=7–11)in dense plasmas are systematically investigated in this work, and it is found that the spectra about 1s23s–1s23p transitons show first blue-shift and then red-shift with increasing free electron densities.
2. Theoretical method
The transition parameters of Li-like ions (Z =7–11) in dense plasmas are investigated by using the MCDHF method combined with the ion sphere model (ISM). The feasibility of the ISM for describing the dense plasmas screening on atomic structures have been tested by many theoretical research works.[41–50]The MCDHF method and the underlying theories have also been detailly described in many papers.[51–54]Here, only a brief description of the MCDHF and ISM theories is presented.
The wave functions are optimized using the extended optimal level (EOL) version of the MCDHF method. The optimization is on the weighted energy average of the states in EOL scheme. The significant interactions between neighboring levels can be accurately determined by simultaneous optimizing multiple levels with a selected J. A configuration state function (CSF) expansion is generated by the restricted active space method, and excitations from the reference configuration to the active set of orbitals to obtain the j j-coupled CSFs of a given symmetry J and parity P. The active set is defined as a set of orbitals with all orbitals except those common to all CSFs included in the atomic state function(ASF).Single and double substitutions from the multireference set to an active set of orbitals to built the configuration expansions.Electrons from the active space are excited from the occupied orbitals to unoccupied orbitals. Because the orbitals with the same principal quantum number n possess similar energies,to obtain the convergence and stability of atomic parameters,we systematically increase the number of orbitals and expand the size of the active space in layers of principal quantum number n. Only the newly added orbitals are optimized to increase the convergence speed and reduce the processing time.For Li-like ions,the calculated atomic stats are 1s22s,1s22p,1s23s,1s23p,and 1s23d,respectively. Initially,the active set(AS)for these atomic stats is

Then,the active set is increased in the following way:

The generated orbitals are used to calculate energy eigenvalues and transition parameters. As we separately optimize set of orbitals for the 1s22s, 1s22p, 1s23s, 1s23p, and 1s23d states respectively, we use biorthogonal transformation[55]of the ASFs to calculate transition parameters.
The ISM is based on the following principles: the ion is represented by a point-like nucleus with nuclear charge Z embedded at the center of a spherical cavity containing enough electrons to ensure global neutrality. The spherical cavity is called as an ion sphere or Wigner–Seitz sphere.The ion sphere radius R is determined by the formula

where neis the free electron density, and N is the number of bound electrons. The plasma is assumed to produce an electrically neutral background beyond the ion sphere radius R. For an N-electron atom,the Dirac–Coulomb Hamiltonian containing all of the dominant interactions can be written as

where the first term is the contribution from one-body,and the second term in the sum is the interaction between bound electrons. Hiis defined as

where the first and the second terms in Eq.(3)are the relativistic kinetic energy of a bound electron. The last term VIS(ri)is effective nuclear potential as“seen”by one bound electron within the ion sphere,and is given by the formula


The ISM mentioned above means that the tested ion is trapped in the center of a hard sphere cavity of radius R, and free electrons are uniformly distributed inside and outside the spherical cavity. That is,if the dense plasma screening effect is described by the ISM,the tested ion will experience both the hard sphere confinement and free electron screening effect.
If a tested ion is trapped in the center of a hard sphere cavity of radius R,and there is nothing in the cavity except the tested ion. The effective nuclear potential as “seen” by one bound electron is given by the formula

If the surface of the sphere cavity is no longer hard in the ISM,the hard sphere confinement does not exist. That is,a tested ion only experiences free electron screening effect,and the bound electrons can move outside the ion sphere. The boundary conditions and normalization condition of the radial wavefunctions Pnk(r)and Qnk(r)are

The other theory for the calculated atomic structures under the hard sphere confinement or free electron screening is the same as that of the ISM mentioned above. All calculations are carried out by using the modified GRASP2K code.[57,58]
3. Results and discussion
3.1. Transition energies and transition probabilities of free Li-like ions
The variations of energy eigenvalues for all Li-like ions(Z =7–11) with the active space are the same as each other,so just take the Na8+ion as an example to display the energy eigenvalues change with the active space. It can be seen from Table 1 that the energy eigenvalues of all states become more negative with increasing the active space,and the calculated energy eigenvalues of all states in AS5 space are almost the same as that calculated in AS4 space, namely the energy eigenvalues of all states have converged when the active space is enlarged to the orbital n=7.

Table 1. The energy eigenvalues (in unit a.u.) of 1s22s and excited 1s22p, 1s23l (l =0–2) configurations of Na8+ ion as a function of active space.Here,AS1=3s,3p,3d,AS2=AS1+{4s,4p,4d,4f},AS3=AS2+{5s,5p,5d,5f},AS4=AS3+{6s,6p,6d,6f},AS5=AS4+{7s,7p,7d,7f}.
The transition energies and transition probabilities among n ≤3 transitions of free Li-like ions(Z=7–11)are displayed in Table 2. It can be seen from the table that the maximum relative differences between the present calculated transition energies,transition probabilities and those recommended from NIST[59]are 0.78%and 3.46%,respectively. Therefore,it can be concluded that our calculated transition energies and transition probabilities among n ≤3 for free Li-like ions(Z=7–11)ions are very accurate, thus the active space of bound electrons of Li-like ions enlarged to the orbital n=7 is enough to describe the correlations effect between bound electrons.
3.2. Critical free electron density of 1s23d state
In plasma environment, the number of excited states decreases with the increase of free electron densities due to the effects of IPD. The maximum free electron density that one excited state is effectively bound is called as critical free electron density. The critical free electron density of one state can be obtaiend by the SP model[11]or EK model.[12]When the excitation energy is less than the ionization energy of the lower level state,the upper level state is stable,or else,the upper level state have become quasibound state or disappeared.When the excitation energy is equal to the ionization energy at some free electron density, this free electron density is the critical free electron density that the upper level is effectively bound. In the high-density limit,the formulas of the SP model[11]and EK model[12]used for the IPD of an ion with net charge z are as follows:[60]
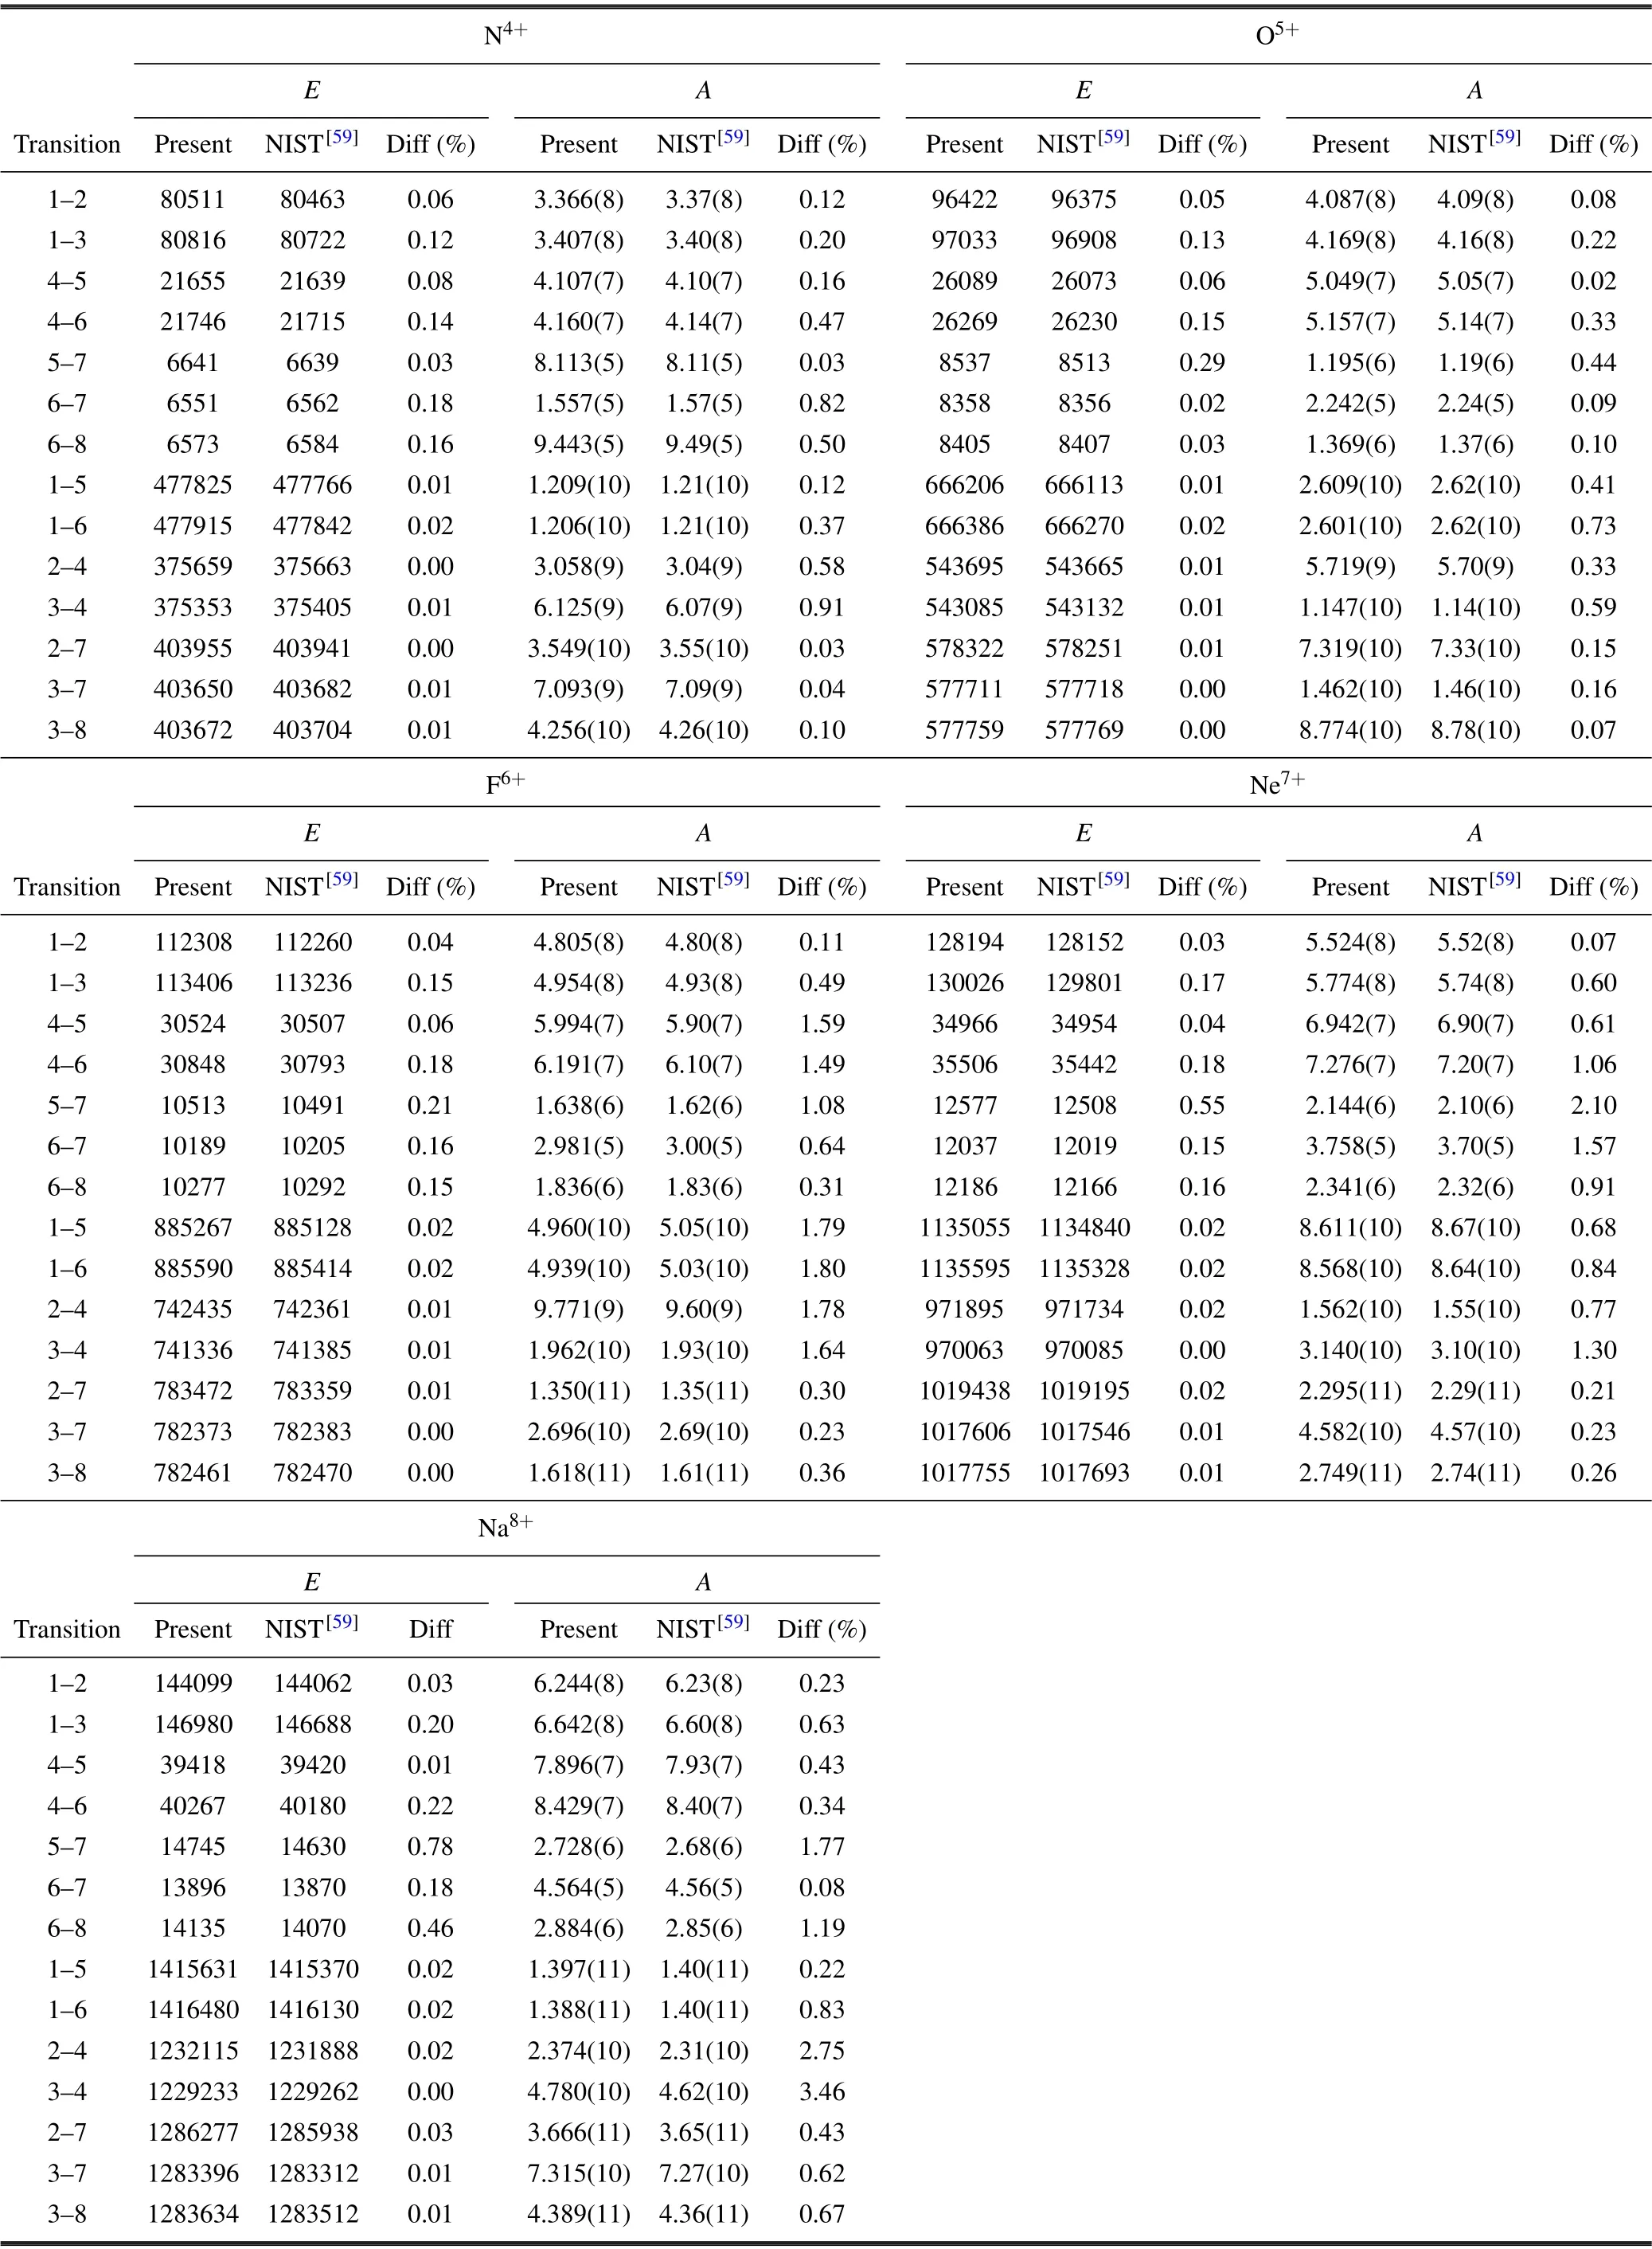
Table 2. Transition energies E (in unit cm−1)and transition probabilities A(in unit s−1)of free Li-like ions(Z=7–11). The numbers 1,2,3,...,8 represent states,which are the same as expressed in Table 1. Diff(%)denotes the relative difference between the present calculated value and that of NIST.[59] The values x(y)signify x×10y.
The relevant radii are defined by
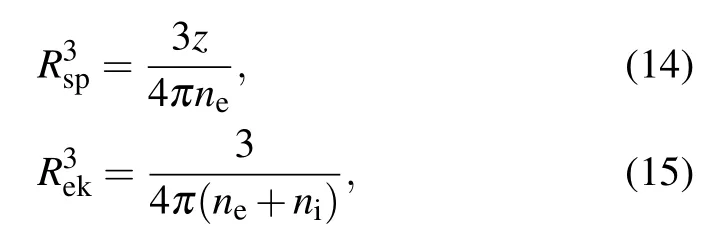
with nethe free electron number density and nithe the ion number density. The atomic unit is used for ΔIsp, ΔIek, Rsp,Rek, ne, and niin formulas (12)–(15). The conversion factor for number density between atomic unit and cubic centimeter is 1.0×1024/(0.529)3.
In our previous work,[61]we also proposed a new method of estimating the critical free electron density of one state.That is,a bound electron will become a quasibound electron,if the classical turning point radius Rctpof the bound electron is larger than the ion sphere radius R.When Rctpof a bound electron in the highest orbital of one atomic state is equal to R,the corresponding free electron density is the critical free electron density for which the atomic state can be effectively bound.In this work, the selected maximum free electron density for one Li-like ion is equal to the critical free electron density estimated by comparing the classical turning point radius Rctpof 3d electron in 1s23d state and the ion sphere radius R.
The critical free electron densities of 1s23d states for the Li-like ions(Z=7–11)are displayed in Table 3.It can be seen from Table 3 that the critical free electron densities nctpestimated by the classical turning point radius Rctpalways greater than those geted by the EK model and SP model, and nctpis more consistent with nspwhich is obtained by the SP model.The critical free electron densities estimated by the classical turning point radius may be little greater, this is caused by the dynamical effects such as the collisions among electrons that are not included in the ISM. If another potential term is added in the ISM to describe the dynamical effects among the electrons, the calculated atomic structure data will be more accurate and will be able to evaluate the IPD effects more effectively.

Table 3. Critical free electron densities(in unit cm−3)of 1s23d states for the Li-like ions (Z =7–11). nek, nsp, and nctp are the critical free electron densities obtained by the EK model, SP model, and the classical turning point radius, respectively. ΔI is the value of IPD (in unit a.u.) at the critical free electron densities obtained by the EK model or SP model.
3.3. Energy levels of Li-like ions in dense plasmas
The variation of the energy levels for all states(n ≤3)of Li-like ions(Z=7–11)with free electron densities is similar to that of the Na8+ion,thus here only take the Na8+ion as an example to illustrate the variation of the energy levels with free electron densities. It can be seen from Fig. 1 that the energy levels of 1s22p(2P1/2,3/2)states of the Na8+ion almost linear increase as free electron densities increase, but as shown in Fig.2 that the energy levels of 1s23s,1s23p,and 1s23d states of the Na8+ion decrease with increasing free electron densities.The inner levels which are close to the nucleus experience comparably higher free electron screening effects than those lying near the boundary region[62][or see Eq. (4)], and the higher angular momentum (l) energy levels having the same principal number (n) experience greater free electron screening effects (see Fig. 4 of Ref. [62]). That is, the greater free electron screening effect is, the higher increase in the energy eigenvalue. The energy eigenvalue that of the ground state 1s22s(2S1/2)is raised by free electron screening,is lower than that of 1s22p(2P1/2,3/2)states, but greater than that of 1s23s,1s23p, and 1s23d states. The energy level is the difference between both the energy eigenvalue of excited states and that of ground state. Therefore,as free electron density increases,the energy levels of 1s22p (2P1/2,3/2) states increase, but the energy levels of 1s23s,1s23p,1s23d states decrease.
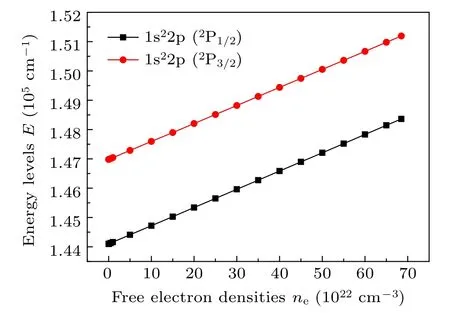
Fig. 1. The variation of the energy levels of 1s22p states of the Na8+ ion with free electron densities.

Fig.2. The variation of the energy levels of 1s23s,1s23p,and 1s23d states of the Na8+ ion with free electron densities.
3.4. Transition parameters of Li-like ions in dense plasmas
Our calculated transition energies, transition probabilities, weighted oscillator strengths, and line strengths, etc.,transition parameters among n ≤3 transitions for Li-like ions(Z =7–11) in dense plasmas are listed in Tables 1–30 of the Supplementary file. These data are important in the feild of plasma diagnosis, astrophysics, and so on. The variation of transition parameters among n ≤3 states of Li-like ions(Z = 7–11) with free electron densities are similar to each other. Here only take Na8+ion as an example,to illustrate the transition energies change with free electron densities. The variations of transition energies between all states (n ≤3)of the Na8+ion with free electron densities are displayed in Fig.3.It can be seen from Fig.3 that except for 1s23s(2S1/2)–1s23p(2P1/2,3/2), the spectra corresponding to Δn=0 transitions show blue shifts and Δn/=0 transitions exhibit red shifts with increasing free electron densities, and this is similar to that reported in Ref.[35].

Fig.3. The variations of the transition energies between all states(n ≤3)of the Na8+ ion with free electron densities.
The intensity of plasma screening effect on the atomic structures can also be evaluated by using the transition energy shift, transition probability shift, weighted oscillator strength shift,line strength shift,and so on. The formula of transition energy shift ΔE, transition probability shift ΔA, weighted oscillator strength shift Δgf, and line strength shift ΔS, respectively, are ΔE =EP−EV, ΔA=AP−AV, Δgf =g fP−g fV,ΔS=SP−SV, where EP, AP, gfP, SPare values of transition energy,transition probability,weighted oscillator strength,and line strength in plasmas, and EV, AV, gfV, SVare values of transition energy, transition probability, weighted oscillator strength, and line strength in vacuum, respectively. The calculated transition energy shifts, transition probability shifts,weighted oscillator strength shifts, and line strength shifts of different transitions for Li-like ions(Z=7–11)at free electron density 5.0×1022cm−3are listed in Table 31 of the Supplementary file. Figure 4 shows the variation of transition energy shifts versus nuclear charge Z at free electron density 5.0×1022cm−3. It can be seen from the figure that the transiton energy shifts of all transitons decrease with increasing nuclear charge Z. This is because in the same free electron density environment, the larger the nuclear charge Z is, the more attractive force the bound electrons experience, which makes the less shift of transiton energy.

Fig. 4. The variation of transition energy shifts versus nuclear charge Z of different transitions for Li-like ions (Z =7–11) at free electron density 5.0×1022 cm−3.
It also shows from Fig. 4 that the transiton energy shifts for Δn=0 transitions are greater than zero (except for Na4+ion)and those for Δn/=0 transitions are less than zero,this is corresponding to the blue shifts and red shifts of the spectra respectively, which has been mentioned in the previous paragraph. In addition, figure 4 shows that the transition energy shift of 1s23s(2S1/2)–1s23p(2P1/2) for the Na4+ion is negative,becasue this transiton has transformed from blue-shift to red-shift, the reason will be discussed in the third paragraph below. The variations of transition probability shift,weighted oscillator strength shifts, and line strength shift change with nuclear charge Z are similar to that of transition energy shift,thus they are not discussed again.
However,it is shown in Fig.5 that for Li-like ions(Z=7–11), the transition energies of 1s23s(2S1/2)–1s23p(2P1/2,3/2)transitions first increase and then decrease with increasing free electron densities,the corresponding spectra show blue shifts at lower free electron densities and red shifts at higher free electron densities. This interesting phenomenon is similar to the reported spectra[40]about Δn=0 transitions of Li atom,Ca XVIII and Ti XX ions in Debye screening potential including the electron–electron screening.
It also can be seen from Fig.5 that the energy level crossings occurs between the 1s23p(2P1/2)and 1s23p(2P3/2)states of Li-like ions(Z=7–11)as free electron density increase.As can be seen from Fig.5 that the both free electron densities of spectra changing from blue-shift to red-shift and energy level crossings occuring,increase with increasing nuclear charge Z,and the two free electron densities for the Na8+ion are very close to the critical free electron density of 1s23d state.
In dense plasmas, the atomic structures and transition properties of ions are influenced by both the hard sphere confinement and free electron screening, if the dense plasma screening effect is described by the ion sphere model which includes both the hard sphere confinement and free electron screening effect. Take N4+ions as an example, to illustrate the effect of hard sphere confinement and free electron screening on the transition energies of 1s23s–1s23p, respectively. It can be seen from Fig. 6 that the transition energies of 1s23s(2S1/2)–1s23p (2P1/2) of the N4+ion decrease with the decrease of hard sphere radius,but increase with increasing free electron density. That is to say, the direction in transition energy changes caused by the hard sphere confinement and free electron screening is opposite. When the N4+ion is immersed in dense plasmas, the transition energies of 1s23s (2S1/2)–1s23p(2P1/2)are influenced by both the hard sphere confinement and free electron screening.At lower free electron densities,as the hard sphere radii are relatively larger[see Eq.(1)],the red-shift of transition energy due to hard sphere confinement is less than the blue-shift of transition energy due to free electron screening, thus the transition energies of 1s23s(2S1/2)–1s23p (2P1/2) increase with increasing free electron densities. Namely,the spectra of 1s23s(2S1/2)–1s23p(2P1/2)show blue shifts at lower free electron densities. However,at higher free electron densities,because the hard sphere radii are relative smaller[see Eq.(1)],the red-shift of transition energy due to hard sphere confinement is greater than the blue-shift of transition energy due to free electron screening, therefore,the transition energies of 1s23s(2S1/2)–1s23p(2P1/2)decrease with increasing free electron densities. That is,the spectra of 1s23s(2S1/2)–1s23p(2P1/2)show red shifts at higher free electron densities. The reasons about the spectra of 1s23s(2S1/2)–1s23p(2P1/2,3/2)transitions for the other Li-like ions(Z=7–11)are similar to that of the N4+ion,thus not repeated again.In addition, it is shown from Fig. 7 that the transition energies of 1s23p(2P1/2)–1s23d(2D3/2)of the N4+ion always increase with the decrease of hard sphere radius and increase of free electron density, respectively. Therefore, in dense plasmas,the hard sphere confinement and free electron screening together cause the transition energies of 1s23p (2P1/2)–1s23d(2D3/2) of the N4+ion always increase with increasing free electron densities.
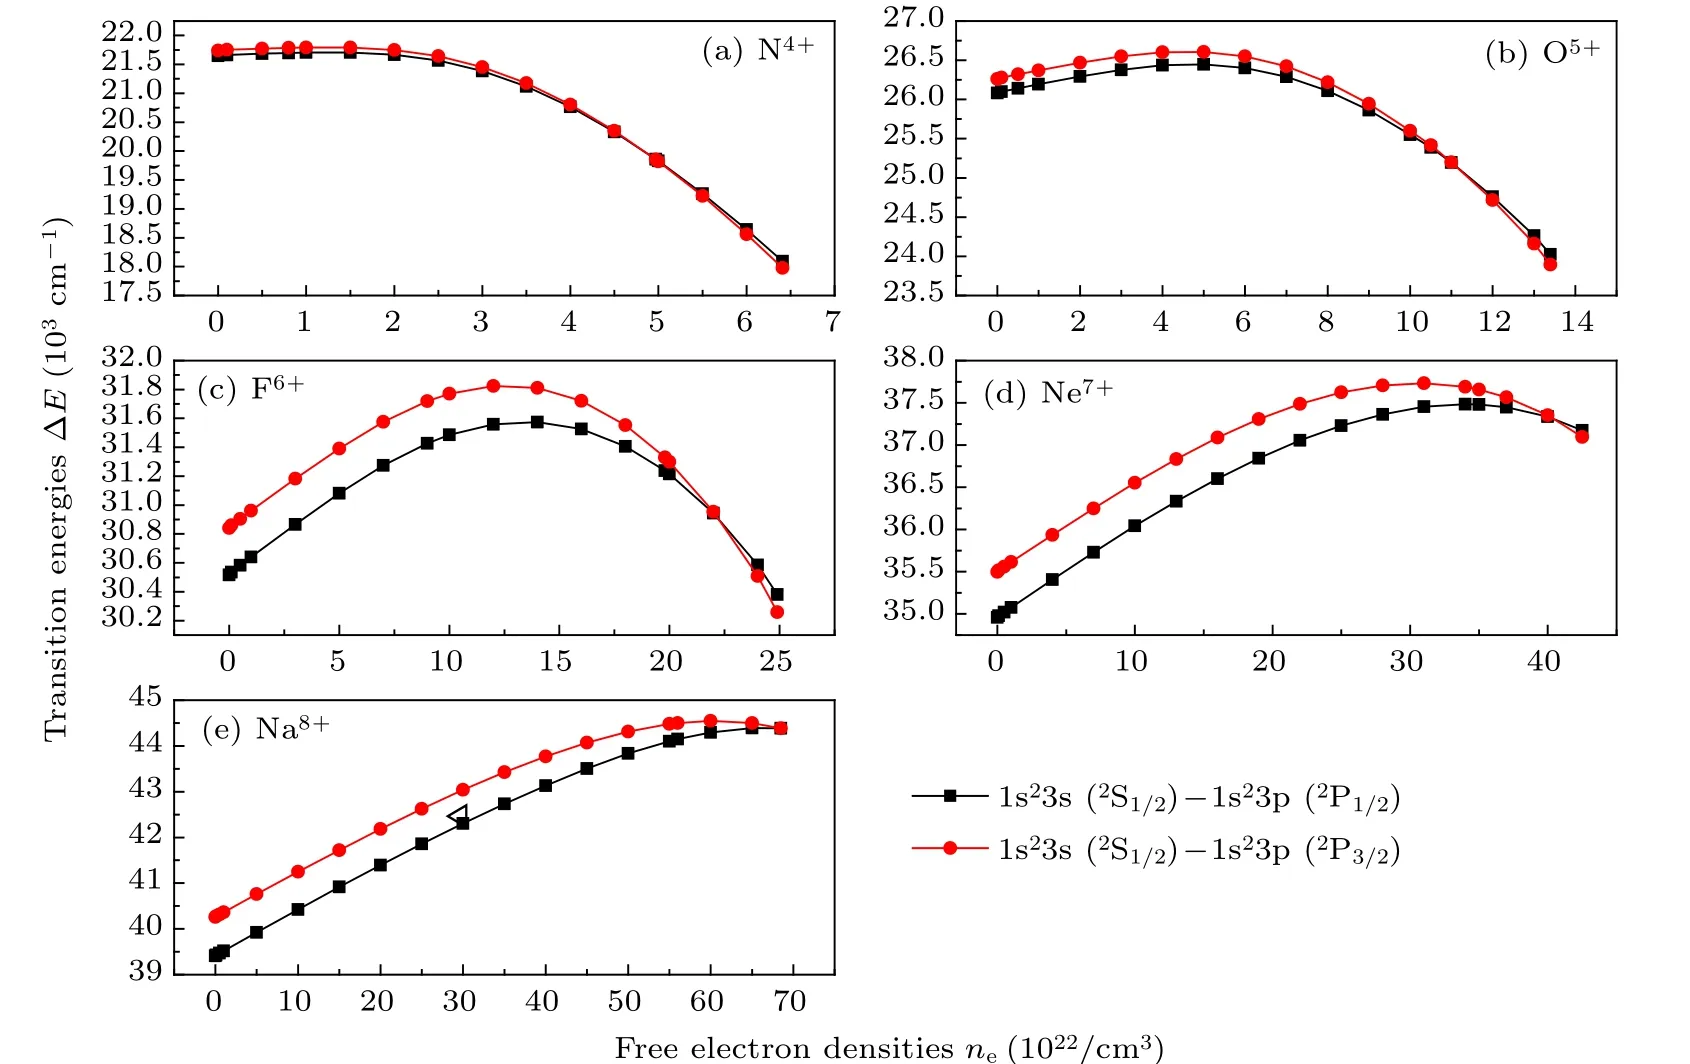
Fig.5. The variations of 1s23s–1s23p transition energies of Li-like ions(Z=7–11)with free electron densities.

Fig.6. The variations of 1s23s(2S1/2)–1s23p(2P1/2)transition energies of N4+ ions with hard sphere radius and free electron density.
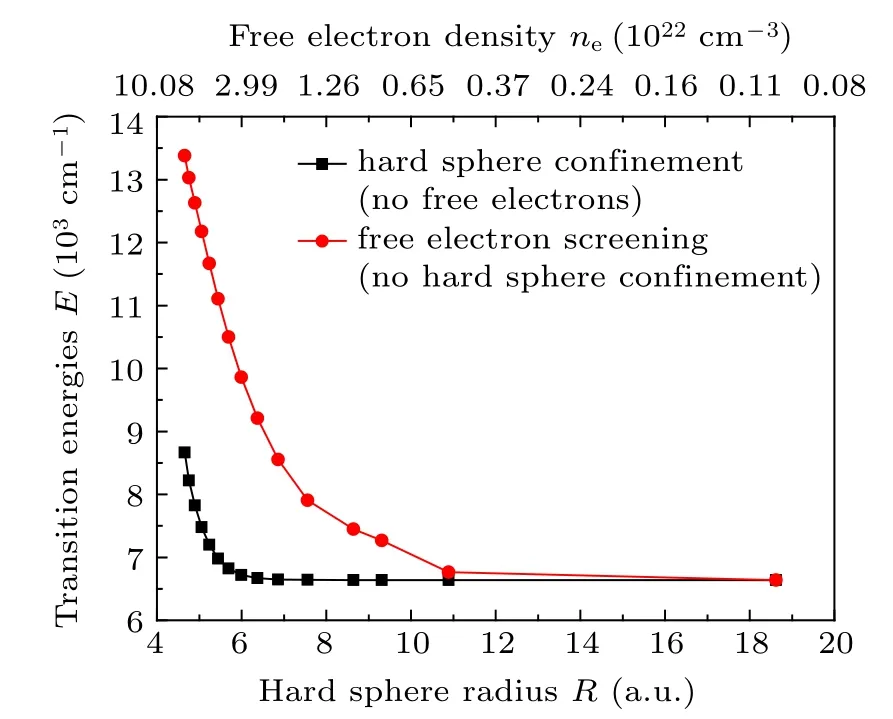
Fig.7. The variations of 1s23p(2P1/2)–1s23d(2D3/2)transition energies of N4+ ions with hard sphere radius and free electron density.
The phenomenon that the spectra of 1s23s(2S1/2)–1s23p(2P1/2,3/2)for Li-like ions(Z=7–11)show blue shifts at lower free electron densities and red shifts at higher free electron densities, can be observed in the laboratory. The experimental scheme is as follows. Firstly, all bound electrons in the outer layer of 1s22s specific energy state are ionized by means of laser resonance ionization, so the plasma that mainly contains the ground state 1s22s are obtained. Plasmas with different densities can be obtained by adjusting laser parameters,the initial state of ion-source, and the cavity size. Secondly,the ground state of 1s22s is resonantly excited to the high excited state 1s23p by the method of laser-resonant-transition combined with tuning laser wavelength and power density.Thirdly,the fluorescence wavelengths of 1s23p →1s23s spontaneous radiation transition are measured by the measurement technology of laser emission spectroscopy,thus the spectra of transition between the two energy states are obtained. Lastly,the red shift or the blue shift of the spectra for 1s23p–1s23s transitions at a certain plasma density can be determined, by comparing the matching relationship between the plasma density parameters and the central wavelength parameters of the fluorescence spectrum. The wavelengths of 1s23s −1s23p transitions for Li-like ions (Z =7–11) in dense plasmas are listed in Table 4,and these data have important reference value for future plasma experiments to verify the predicted phenomena that the spectra of 1s23s(2S1/2)–1s23p(2P1/2,3/2)for Lilike ions (Z =7–11) show blue shifts at lower free electron densities and red shifts at higher free electron densities.

Table 4. Wavelengths (in unit ˚A) of 1s23s–1s23p transitions for Li-like ions (Z =7–11) in dense plasmas. λ1 and λ2 indicate the wavelengths of 1s23s(2S1/2)–1s23p(2P1/2)and 1s23s(2S1/2)–1s23p(2P3/2)transitions,respectively. The values x(y)indicate x×10y.
4. Conclusion
In this work, the energy levels, transition energies, transition probabilities, weighted oscillator strengths, and line strengths of Li-like ions(Z=7–11)in dense plasmas are calculated by the MCDHF method combined with the ion sphere model. We find that the active space of bound electrons of Li-like ions is enlarged to the orbital n=7, which is enough to describe the correlations effect between bound electrons.Our calculated transition energies and transition probabilities of free Li-like ions (Z = 7–11) agree well with the recommended value of NIST.[59]The critical free electron densities for 1s23d states estimated by comparing the classical turning point radius of 3d electrons and the ion sphere radius may be a little greater, this is caused by the dynamical effects such as the collisions among electrons that are not included in the ISM. The energy levels of 1s22p states increase, and that of 1s23s,1s23p,and 1s23d states of all Li-like ions decrease with increasing free electron densities. Except for 1s23s (2S1/2)–1s23p(2P1/2,3/2)transitions,the transition energies of Δn=0 transitions increase, and for Δn/=0 transitions decrease with increasing free electron densities.
An interesting phenomenon that the spectra of 1s23s–1s23p transitions for Li-like ions(Z=7–11)show blue shifts at lower free electron densities and red shifts at higher free electron densities, is predicted at the present work. The reasons are as follows. The dense plasma screening effect is described by the ion sphere model which includes both the hard sphere confinement and free electron screening effect.At lower free electron densities, as the hard sphere radii are relative larger, the red-shift of transition energy due to hard sphere confinement is less than the blue-shift of transition energy due to free electron screening,thus the spectra of 1s23s–1s23p show blue shifts. However,at higher free electron densities, because the hard sphere radii are relative smaller, the red-shift of transition energy due to hard sphere confinement is greater than the blue-shift of transition energy due to free electron screening,therefore,the spectra of 1s23s–1s23p show red shifts. This phenomenon can be observed in the laboratory,and the experimental scheme is also given. We hope the phenomenon to be verified by experiment as soon as possible.
Acknowledgment
The authors express sincere gratitude to professor J¨onsson P for free providing the GRASP2K program.
杂志排行
Chinese Physics B的其它文章
- Corrosion behavior of high-level waste container materials Ti and Ti–Pd alloy under long-term gamma irradiation in Beishan groundwater*
- Degradation of β-Ga2O3 Schottky barrier diode under swift heavy ion irradiation*
- Influence of temperature and alloying elements on the threshold displacement energies in concentrated Ni–Fe–Cr alloys*
- Cathodic shift of onset potential on TiO2 nanorod arrays with significantly enhanced visible light photoactivity via nitrogen/cobalt co-implantation*
- Review on ionization and quenching mechanisms of Trichel pulse*
- Thermally induced band hybridization in bilayer-bilayer MoS2/WS2 heterostructure∗
