Phase transition of shocked water up to 6 GPa:Transmittance investigation∗
2021-05-24LangWu吴浪YueHongRen任月虹WenQiangLiao廖文强XiChenHuang黄曦晨FuShengLiu刘福生MingJianZhang张明建andYanYunSun孙燕云
Lang Wu(吴浪), Yue-Hong Ren(任月虹), Wen-Qiang Liao(廖文强), Xi-Chen Huang(黄曦晨),Fu-Sheng Liu(刘福生), Ming-Jian Zhang(张明建), and Yan-Yun Sun(孙燕云),†
1Key Laboratory of Advanced Technologies of Materials,Ministry of Education of China,School of Physical Science and Technology,Southwest Jiaotong University,Chengdu 610031,China
2Sichuan Provincial Key Laboratory(for Universities)of High Pressure Science and Technology,Southwest Jiaotong University,Chengdu 610031,China
Keywords: phase transition,shocked water,multiple compresses,transmittance,scattering
1. Introduction
Water is one of the most abundant condensed matter in the universe.[1]Under specific pressure and temperature conditions,it can be transformed into more than a dozen different phases.[2,3]The behavior of water under extreme pressure and temperature has profound implications for the study of detonation science,[4]astrophysics,[5]and earth science,[6]so the research on the phase transition of water under extreme condition is always a research hotspot.[7,8]
The light gas gun loading technology is one of the most suitable methods to study the kinetic process of the phase transition on a nanosecond scale.[9–11]Considering the phase transition kinetic mechanism, it can be divided into homogeneous and heterogeneous phase transition. The former proceeds uniformly in the whole process, while the phase interface is not obvious. The latter includes the classical uniform nucleation process and non-uniform nucleation process. The non-uniform nucleation is generally accomplished by nucleation and growth of new phases at the interface so that the required nucleation work is less than that needed by the uniform nucleation.[12]
Schardin studied the shock phase transition of water as early as 1941.[13]They found that when the bullet speed was faster than 800 m/s,the water around the bullet began to appear opaque. In 1957,Walsh and Rise employed a detonation loading method and light reflection camera detecting technology to investigate the liquid-solid phase transition of water,[14]but no evidence of the phase transition was obtained. In 2006,Baster et al. combined magnetic compression loading with VISAR measurement technology to study the kinetic characteristics of the crystalline transition of water.[15]Though the phase transition phenomena were observed,the microstructure information of the new phase still remains elusive. Dolan and Gupta studied the phase transition of shocked water by light gas gun and light transmission measurement technology.[16]They obtained direct information about the liquid–solid phase transition of water under high pressure for the first time. At the same time,they also found that the phase transition of water is influenced by the window material.[17]
In experimental studies,the laser light penetrated through the sample was denoted as sample light;the laser light detected by the pyrometer directly was denoted as reference light. In Dolan’s experiment,[16]the reference light was measured in advance. However, in the experiment, both of the instability of the laser source and the intensity transmission attenuation could interference the measurement results of the sample light. If the reference light had been measured before the experiment, it could not eliminate the above influences, which would make the experimental results inaccurate. The sample light and the reference light determined by the light transmission in-situ detection technology used in this experiment were measured simultaneously during the experiment. The twobeam remained highly consistent in time, ensuring the comparability between the reference light and the sample light.[18]
In this work,based on the light gas gun loading technology and the optical transmittance in-situ detection system,the dynamic mechanism of phase transition for shocked water is studied.The experimental principle is introduced in Section 2.In Section 3, based on the theory of light scattering and the theory of phase transition dynamics, the mechanism of transmittance change during the loading is analyzed. Summary and prospect are discussed in Section 4.
2. Experimental methods
The isentropic compression technology can not only load the sample to extremely high pressure on a nanosecond scale but also effectively control the temperature rise,[19]which is believed to be a suitable research platform to understand the dynamic process of the phase transition on a nanosecond time scale.
The experimental schematic diagram is shown in Fig. 1.Two electrical signals were generated by the collision between the flyer and the base plate. One triggered the laser source(650±10 nm), the other was recorded by the oscilloscope as the starting time of shock wave generation. The laser was divided into two beams by a semipermeable mirror. The incident beam which entered into the sample initially was recorded as Isample, then it was reflected by the highly polished reflective surface. The other beam denoted as Ireferencewas directly converted into an electrical signal by the pyrometer and then recorded by an oscilloscope. The sample cell was full of deionized water. To avoid bubbles, the water was gently injected into the sample cell in the manner of bottom-in and topout.
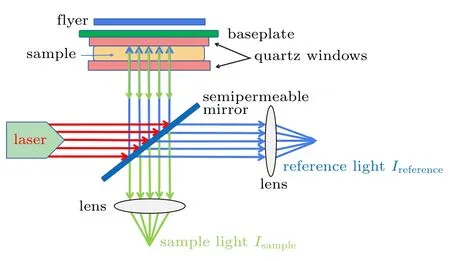
Fig.1. Diagrammatic illustration of setup for optical transmission measurement.
Due to the low shock impedance of water, it is difficult to obtain a relatively high pressure in the first shock. So the multiple shock technique was employed in this work. That quasi-isentropic loading method can compress the sample to high pressure while reduce the rising of temperature.The peak pressure of the sample is determined by the shock wave velocity,the material of the experimental target and the sample.[19]
If part of the sample undergoes a phase transition,due to the difference in refractive index between the new phase and the parent phase,a scattering effect(illustrated in Fig.2)will emerge.[20]If the geometric path of the incident light in the sample is dx,the intensity attenuation dI can be deduced from the following equation:

where h is the absorption coefficient,α is the scattering coefficient. The absorption of visible light by water occurs above 30 GPa,[21]which is far from the value in this work, so h is supposed to be 0 here. The change in transmittance is considered to be caused by the scattering of light.[22,23]

This will cause a drop in the optical signal Isampledetected in the experiment. The expression of transmittance is

It is believed that if the liquid water does not undergo a liquid–solid phase transition, the transmittance will not change.
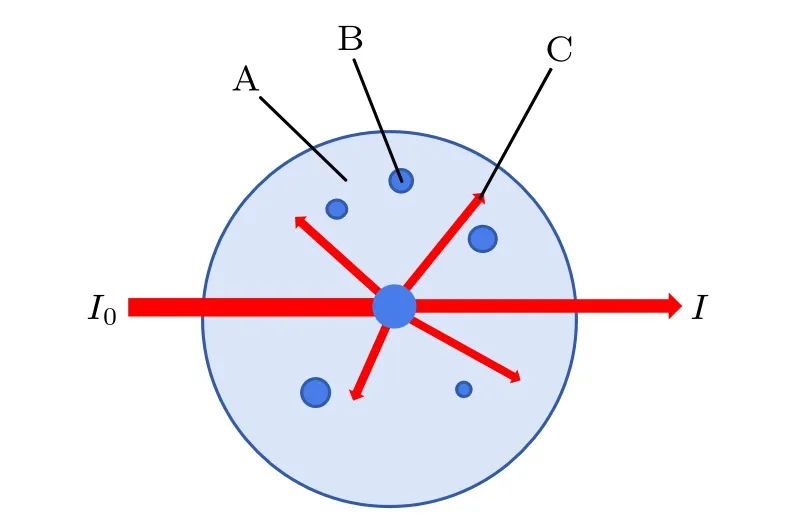
Fig. 2. Light scattering model. I0: incident light intensity, I: transmitted light intensity,A:sample(water),B:new phase particle,C:scatter light.
3. Experimental results and analysis
3.1. Experimental phenomena
For the convenience of analysis,all of the original experimental optical signals are normalized according to Eq.(4).
Figure 3 shows that from tA1to tA2, the sample is compressed by the shock wave first time, the sample maintains good transparency. Figure 4 shows the loading path over shocked water in Exp191113 and Exp190403. Then at the tA2point,the sample is compressed the second time by the shock wave. In the process of the subsequent shocks, the transmittance begins to decrease after a delay until it reaches a minimum value. In this process, the intensity of the transmitted light decreases drastically in the beginning and slowly then. It can be seen from Fig.3 that after the tA5, the intensity of the transmitted light is almost stable, but the transmittance does not recover back to 1, this phenomenon indicates that there exists a certain loss of light.

Fig.3. Time–transmittance curve of shocked water in Exp191113,with tA1 being arriving time of shock wave at sample/front-window interface, tA2,tA3, tA4 denoting the second, third, and fourth points of the shock arriving time,respectively. tA5 representing minimal point of the transmittance,and tA6 referring to the time when the unloading wave reaches the rear window.

Fig. 4. The phase diagram of H2O, where dashed line indicates Hugoniot curve,[38] thick solid line denotes equilibrium phase boundary of water,[39]triangles and solid dots respectively refer to the adiabatic loading path of the shocked water in Exp191113 and Exp190403(this work).
As shown in Fig. 5, the time–transmittance curve of Exp190403 signal presents the same decline and rebound trend to those of Exp191113. What lead to the difference are the start time and the span of the transmittance curve decreasing: the decreasing of the transmittance of Exp190403 starts in the first shock while that of Exp191113 starts in the second shock; in the whole process, the transmittance decreasing in Exp190403 takes less time than that in Exp191113, and the degree of decrease is greater.

Fig.5.Time–transmittance curve of shocked water in Exp190403,where tB1 is the arriving time of shock wave at the sample/front-window interface,tB2,tB3, tB4 are the second, third, and fourth points of the shock arriving time,respectively,tB5 is the time when transmittance touches the lowest point,tB6 is the time when unloading wave reached e rear window.
3.2. Analysis and discussion
In this subsection, based on the theory of light scattering and dynamic phase transition mechanism,the microscopic mechanism of optical transmittance decline in the process of the shock loading is discussed. In particular, the significant inflection point of the transmittance curve is explored.
The basic experimental parameters are shown in Table 1.The thermodynamic state of the sample under multiple compressions is calculated according to the experimental initial data in Table 1. The calculation results are shown in Table 2.

Table 1. Basic experimental parameters: ν0 (shock wave velocity)and d0 (thickness of the sample).

Table 2. Thermodynamic state of water during the multiple compress loading,with P denoting pressure and T temperature.
3.2.1. Relaxation stage
In Exp191113, the sample after the first shock(1.9 GPa,382 K) is still in the liquid phase region, and no evidence of phase transition of the shocked water is detected under this condition. After the second compress, the sample (3.6 GPa,405 K) enters into the ice VII phase region, which indicates that it can undergo a phase transition here.[24]However, the pressure at this time is lower than that in the condition of the uniform phase transition reported by Dolan.[19]Though still in the liquid region(2.5 GPa,409 K),the transmittance of the water sample in Exp190403 does change after the first shock,which seems that the water/ice phase boundary moves toward the liquid region in this work. This phenomenon may be induced by the quartz window. It is suggested that some of the water molecules close to the quartz/water interface can form an ice-like structure.[25,26]In the phase transformation, these ice-like particles can act as the nucleation seeds to reduce the potential barrier.[17,27,28]As a result, for the shocked-water that occurs in the liquid region near the phase boundary, it is understandable to form new phase particles at the quartz/water interface. By then,the phase transition occurs. The refractive index of the newly generated phase is supposed to be different from that of the liquid water without phase transition. As a result, when the light passes through the phase coexistence region,the transmittance will be reduced by scattering.[20,29]Figure 3 indicates that there is a relaxation time (about 180 ns) before the transmittance drops in Exp191113. Since the size of the newborn phase core is much smaller than the wavelength of the incident light, the sample light intensity does not change in the relaxation time.
3.2.2. Decreasing stage
According to the phase transition thermodynamic theory,the Gibbs free energy change in the system is expressed as[30]

where P0and T0are the pressure and temperature of the phase transition point, ΔV is the volume change during the phase transition, ΔS is the entropy increase of the system, and σ is the interface energy per unit area. The change of Gibbs free energy determines the speed of the phase transition.
The size of the new phase particles continued to grow under the external driving force in this stage. When it gradually grows bigger, part of the incident light will be scattered and the transmittance starts to decrease.It can be seen from Figs.3 and 5 that both the transmittance decreasing processes in the two experiments can be divided into the rapid descent process and the slow descent process. In the rapid descent process,the compression pressure and temperature increase dramatically. At this time,the particle size of the new phase increases rapidly. In the subsequent compression process, the temperature and pressure gradually converge. At this time, the new phase particle’s size is believed to increase more slowly,which leads the scattering light to grow sluggishly.
From the comparison of the two experimental signals, it can be seen that the transmittance reduction of Exp190403 took less time and makes a further drop. The reason for this is that the loading pressure and temperature in Exp190403 are higher than those in Exp191113.
3.2.3. Recovery stage
When the transmittance falls to the lowest point, which means that most of the new phase particles reach the critical size that approximately equals the incident light wavelength.[31]When the size of the scattering source grows greater than the critical size, the scattering effect begins to weaken. At this time, the transmittance is characterized by a certain rebounding.[32,33]However,the recovery is not obvious. On the one hand,under the driving force,the new phase particles cannot stop being generated,thus more and more particles are scattered;on the other hand,when the particle larger than the critical size, the scattering effect of the original particles begins to weaken. The two factors may weaken mutual influence so that the recovery does not look obvious in this stage. The phenomenon that the intensity of the transmitted light does not return to the intensity of the original incident light at the later stage of the phase transition, indicates that the water sample does not completely transform into the solid phase. Like what is indicated in Ref.[34],the state finally observed in this work is also a two-phase mixed state,i.e.,mixture of the liquid phase and the new phase, each accounting for a certain volume fraction.
3.3. Summary of experimental phenomena
According to Lambert–Beer law,[35]transmitted light and incident light can be expressed as

where α is the extinction coefficient, x is the time-dependent thickness of the sample, I is the transmitted light intensity, I0is the incident light intensity,and the factor 2 is because of the round trip behavior in the sample of the incident light.
The extinction coefficient is gradually increasing with the enhancement of the scattered effect. So it is influenced by the degree which the phase transition reaches to. As shown in Figs. 6 and 7, the extinction coefficient of the water sample gradually increases to a maximum value,corresponding to the lowest point of transmittance. After reaching a maximum value,the extinction coefficient has a downward trend again.
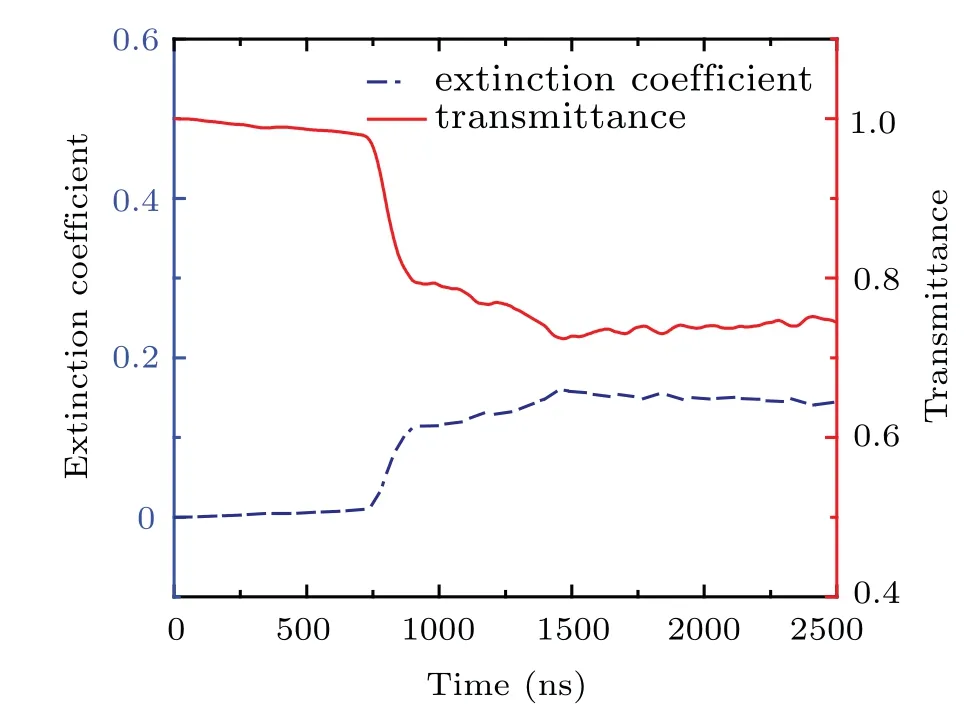
Fig.6. Extinction coefficient and transmittance versus time in Exp191113.
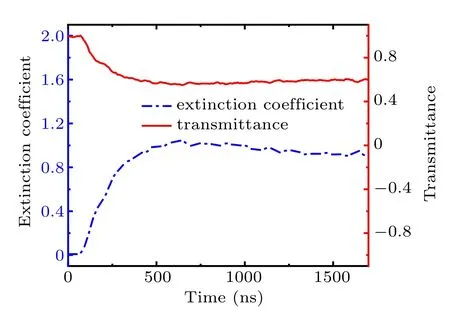
Fig. 7. The extinction coefficient and the transmittance versus time in Exp190403.
The transient nucleation rate of the sample under loading conditions satisfies the following relationship:[36]

where J0is the steady-state nucleation rate, ΔG∗is the Gibbs free energy change when the critical nucleus is formed,and K is the Boltzmann constant. As the pressure increases,ΔG∗decreases and the transient nucleation rate increases. Although the incident light scattering is quite complex,the total amount of scattered light is proportional to the total number of scattering units.[37]That is,the more the formed new phase particles,the stronger the cumulative scattering is and the more remarkable the transmittance drop.
Hence,the reason for the difference between final extinction degrees in Figs.6 and 7 is that the sample of Exp190403 is shocked to a higher pressure which can form more scattering units. Thus the phase transition degree of Exp190403 is greater due to the higher pressure.
4. Conclusions
Based on the theory of light scattering and the phase transition kinetics,the phase transition behaviors of shocked water are analyzed. The reason for the decrease of light transmittance of water sample during dynamic loading is investigated.The evolution of the transmittance of the shocked water can be generally divided into three stages: relaxation stage, decline stage,and recovery stage.
During the relaxation stage,the quartz window induces a new phase to be generated. At this time,since the new phase core is small,the scattering effect of light is not obvious,and the change in transmittance is not so large. Under the induction of the quartz window,the phase transition of shocked water can occur in the liquid phase region near the melting line of the equilibrium phase diagram.
During the decreasing stage, the particles of the new phase gradually grow up. In the early phase transition, the scattering effect increases rapidly with the particles size growing. When the transmittance is the lowest, the sizes of new phase particles approximately equal the wavelength of the incident light.
During the recovery stage of the transmittance,when the sizes of the new phase particles exceed the critical value, the scattering effect will be weakened, which can lead the transmittance to recover. At the end of the experiment, the transmittance of the shocked sample does not return to 1, which indicates that the system may be still in a liquid and solid coexistence state.
杂志排行
Chinese Physics B的其它文章
- Corrosion behavior of high-level waste container materials Ti and Ti–Pd alloy under long-term gamma irradiation in Beishan groundwater*
- Degradation of β-Ga2O3 Schottky barrier diode under swift heavy ion irradiation*
- Influence of temperature and alloying elements on the threshold displacement energies in concentrated Ni–Fe–Cr alloys*
- Cathodic shift of onset potential on TiO2 nanorod arrays with significantly enhanced visible light photoactivity via nitrogen/cobalt co-implantation*
- Review on ionization and quenching mechanisms of Trichel pulse*
- Thermally induced band hybridization in bilayer-bilayer MoS2/WS2 heterostructure∗
