Magnetic diagnostics for magnetohydrodynamic instability research and the detection of locked modes in J-TEXT
2021-05-22DongliangHAN韩东良ChengshuoSHEN沈呈硕NengchaoWANG王能超DaLI李达FeiyueMAO毛飞越ZhengkangREN任正康YonghuaDING丁永华andtheTEXTTeam
Dongliang HAN (韩东良), Chengshuo SHEN (沈呈硕),Nengchao WANG (王能超), Da LI (李达), Feiyue MAO (毛飞越),Zhengkang REN (任正康), Yonghua DING (丁永华) and the J-TEXT Team
International Joint Research Laboratory of Magnetic Confinement Fusion and Plasma Physics, State Key Laboratory of Advanced Electromagnetic Engineering and Technology,School of Electrical and Electronic Engineering, Huazhong University of Science and Technology, Wuhan 430074, People’s Republic of China
Abstract Magnetohydrodynamic (MHD) instabilities are widely observed during tokamak plasma operation.Magnetic diagnostics provide important information which supports the understanding and control of MHD instabilities.This paper presents the current status of the magnetic diagnostics dedicated to measuring MHD instabilities at the J-TEXT tokamak; the diagnostics consist of five Mirnov probe arrays for measuring high-frequency magnetic perturbations and two saddle-loop arrays for low-frequency magnetic perturbations, such as the locked mode.In recent years, several changes have been made to these arrays.The structure of the probes in the poloidal Mirnov arrays has been optimized to improve their mechanical strength, and the number of in-vessel saddle loops has also been improved to support better spatial resolution.Due to the installation of high-field-side(HFS)divertor targets in early 2019,some of the probes were removed,but an HFS Mirnov array was designed and installed behind the targets.Owing to its excellent toroidal symmetry,the HFS Mirnov array has,for the first time at J-TEXT,provided valuable new information about the locked mode and the quasi-static mode(QSM) in the HFS.Besides, various groups of magnetic diagnostics at different poloidal locations have been systematically used to measure the QSM, which confirmed the poloidal mode number m and the helical structure of the QSM.By including the HFS information,the 2/1 resonant magnetic perturbation(RMP)-induced locked mode was measured to have a poloidal mode number m of ~2.
Keywords: J-TEXT tokamak, locked mode, magnetic diagnostics, magnetohydrodynamic instabilities
1.Introduction
Magnetohydrodynamic (MHD) instabilities are widely observed during tokamak plasma operation.Tearing mode(TM)[1–3]is a kind of MHD instability present in most tokamak devices,which is one of the most harmful instabilities, and can even lead to disruption.The spatial distribution of the radial magnetic field induced by TM can be represented as
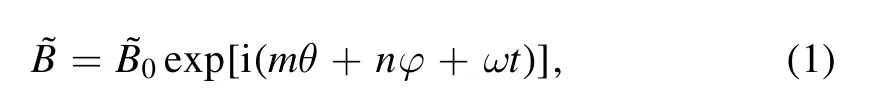

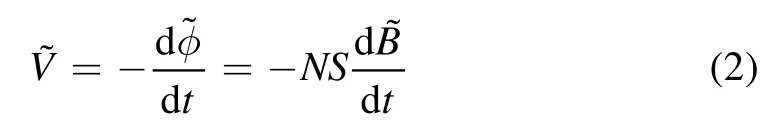
Figure 1.Overview of the MHD magnetic diagnostics at J-TEXT in 2020.The green, red, blue, and cyan rectangles represent poloidal Mirnov array 1, poloidal Mirnov array 2, the toroidal Mirnov array and the HFS Mirnov array, respectively; the magenta ellipses represent ex-vessel saddle loops.
wheremandndenote the poloidal and toroidal mode numbers,respectively, andωrepresents the angular frequency of the TM rotation.The magnetic topology generally has a helical structure,which is usually called a magnetic island.The low-mtearing modes,such as them/n=3/2 and 2/1 modes,often lead to the degradation of plasma confinement.The 2/1 mode can even stop rotation due to the locking effect of the vacuum vessel and the error field, which is called the locked mode (LM), and cause major disruptions[4–6].Therefore,measuring the mode number,frequency, amplitude, and spatial distribution of the TM is a crucial topic in MHD research.Mirnov probes and saddle loops for magnetic field measurement are fundamental diagnostics for studying magnetic confinement plasmas [7].These sensors provide simple, robust measurement of the static and fluctuating magnetic properties and span the full range of operational space.Faraday’s law of electromagnetic induction, which is the foundation of magnetic measurements, is described by
All tokamak operators around the world attach great importance to the construction of magnetic perturbation diagnostics and have upgraded their systems according to their own experimental requirements [8].At ASDEX-U,where the mode number ranges fromn= 1 ton= 10, the toroidal array has been upgraded to give accurate mode numbers and the phases of magnetic perturbations [9]; at DIII-D, about 250 magnetic probes have been installed,providing the ability to measure non-rotational and asymmetric magnetic fields [10].
At the J-TEXT tokamak, Mirnov probes were installed following its reconstruction in 2004 [11], while the saddle loops for locked-mode detection were installed in 2011 [12].In more recent years, an upgrade [13] was carried out in around 2017 to add a new poloidal Mirnov array and increase the spatial resolution of the toroidal Mirnov array.In addition,an ex-vessel saddle-loop array was built for locked-mode detection [14].Subsequently, several changes to these arrays emerged; in particular, a new HFS Mirnov array was installed.However, these modifications have not been described and summarized yet.In this work, we present the overall status of the J-TEXT magnetic diagnostics dedicated to the measurement of MHD instabilities in section 2, in particular,focusing on poloidal Mirnov array 2 and the in-vessel saddle loops.The newly developed HFS Mirnov array is described in detail in section 3.The QSMs and LMs are measured by these arrays, especially by the HFS Mirnov arrays.These arrays.located at various toroidal and poloidal locations,provide 3D information about QSMs and LMs, as shown in section 4.Finally, a brief summary is given in section 5.
2.Magnetic diagnostics for MHD instability research at J-TEXT
J-TEXT is a medium-sized limiter tokamak with a major radius (R0) of 1.05 m and a minor radius (a) of 0.25–0.3 m[11].Figure 1 displays an overview of the MHD magnetic diagnostics at J-TEXT in 2020,which consist of five Mirnov probe arrays for measuring high-frequency magnetic perturbations [13] and two saddle-loop arrays [14] for low-frequency magnetic perturbations,such as the locked mode.The Mirnov probe arrays include: (1) two poloidal Mirnov probe arrays for measuring the poloidal distribution of magnetic perturbations at two toroidal locations; (2) two toroidal Mirnov probe arrays [13] for measuring the toroidal distributionof magnetic perturbations at two poloidal locations; (3) an HFS Mirnov probe array for measuring the magnetic perturbation from the HFS.The poloidal and toroidal Mirnov arrays consist of Mirnov probe modules, which measure the time differentials of both radial and poloidal magnetic fields, dBr/dtand dθB/dt,while the HFS array consists of individual probes measuring either dBR/dtor dBZ/dt, which will be described in section 3.The saddle-loop arrays consist of 4 saddle loops mounted outside the vacuum vessel (ex-vessel saddle loops) [14] and 24 saddle loops wrapped around the RMP coils inside the vacuum vessel (in-vessel saddle loops).

Table 1.Summary of the J-TEXT MHD magnetic diagnostic sensors.
A new circuit board manufacturing process [15], i.e.the low-temperature co-fired ceramic (LTCC) process, was selected for the Mirnov magnetic probes.The application of LTCC technology to the fabrication of magnetic probes for tokamak vacuum vessels has the following obvious advantages.
(1) Its material, DuPont 951, can withstand high temperatures of up to 850°C and does not release impurities in the high vacuum environment of 10−5–10−6Pa in the J-TEXT vacuum vessel.
(2) The coil circuit is not affected by the skin effect,since it is a printed circuit with a thickness of only tens of microns, so its response to high-frequency signals is good.
(3) The single chip of the LTCC probe is light and thin,and the coil is compact, meeting the requirement for a sufficientNSvalue while requiring a smaller volume.
Since 2017, several changes to these arrays have emerged.The structure of the probes in the poloidal Mirnov array has been optimized to improve the mechanical strength,and the number of the in-vessel saddle loops has also been improved for higher spatial resolution.Table 1 summarizes the current status (as of 2020) of the MHD magnetic diagnostics at J-TEXT.
2.1.Poloidal and toroidal Mirnov probe arrays
The earliest Mirnov probe arrays at J-TEXT consisted of a poloidal Mirnov array (PMA1) with 24 2D Mirnov probes(poloidal and uniformly distributed) and a toroidal Mirnov array with 8 2D Mirnov probes (toroidal and uniformly distributed)[11].From 2016,another poloidal Mirnov array with 48 poloidal uniformly distributed 2D modules was installed at a toroidal angle of φ=56.25°,i.e.the poloidal Mirnov array 2 (PMA2), while the 8-probe toroidal array was replaced by two toroidal Mirnov arrays (TMA1 and 2).As described in[13],the initial PMA2 and toroidal Mirnov arrays consisted of LTCC probes withNSvalues of 846.5 cm2and 644.5 cm2for theBrprobes andBθprobes (figures 2(a) and (b)), respectively.By the end of 2017, the PMA2 had been optimized with a new probe size and geometric positions to improve the mechanical strength of the probes, while the toroidal Mirnov arrays remained unchanged.The new optimized probes(figure 2(c)) have 19 layers with a thickness of 1.7 mm, a length of 60 mm and a width of 17 mm,which leads to anNSvalue of 689 cm2for both theBrandBθprobes.The new supporting structure of PMA2 is designed to be further away from the plasma to avoid overheating and damage due to plasma bombardment.
Due to the installation of the HFS divertor targets in early 2019,12 and 7 probe modules were removed from PMA1 and PMA2,respectively.The remaining probes from those arrays are shown by red and green rectangles in figure 1.
2.2.In-vessel saddle-loop arrays

Figure 2.Photographs of the initial LTCC magnetic probes used to measure the(a)radial and(b)poloidal magnetic fields(2016–2017),(c) the optimized LTCC magnetic probes (since the end of 2017).
The number of in-vessel saddle-loop arrays has also been improved.The initial in-vessel saddle loops [14], with ten turns, were only placed at the low-field sides of ports 7 and 14, and therefore had poor toroidal resolution.Thus, following this upgrade,the spatial distribution was greatly improved from two loops to twenty-four loops.Each loop is wrapped around an in-vessel RMP coil [16] and dedicated to measuring the sign of the magnetic flux produced by the RMP coil,and hence, monitoring the RMP coils’ current direction.Also, the new in-vessel saddle loops have only a single turn;thus, the output voltage of the in-vessel saddle loops is reduced to less than 10 V.Since these sensors are installed inside the vacuum vessel and the high-frequency magnetic perturbations from MHD instabilities are not shielded by the vacuum vessel wall, it is possible for the in-vessel saddle loops to measure both high- and low-frequency magnetic perturbations.The results of measuring and calculating the amplitudes and phases of LMs using these loops are as expected.Since the signal measured by the in-vessel saddle loops is not integrated, a program has been designed to integrate the signal numerically and upload it to the data server automatically.
3.Design and installation of the HFS Mirnov probes
During the design of the HFS divertor target, a set of HFS Mirnov probe arrays was designed and integrated inside the supporting structure and behind the graphite target plates.Figure 3 displays the layout of these new HFS Mirnov probes in Φ andZcoordinates,while they are also shown by the cyan rectangles in figure 1 using θ and Φ coordinates.
3.1.BZ probes
Since the HFS parts of the two PMAs were removed after the installation of the targets,two vertical columns of probes were designed to measure the vertical magnetic fieldBZ, as a supplement to the poloidal arrays.One column with five probes is located exactly at the toroidal position of PMA2,i.e., between ports 2 and 3, and hence the full poloidal coverage of poloidal array 2 has been retained.However, the other five-probe column is located at the middle of port 10,i.e.toroidally 11.25° away from the toroidal location of PMA1.These five probes in a column are arranged vertically in theZdirection in the HFS.Among the five probes, one probe is placed in the midplane(Z=0 cm)and the other four are atZ=±4.6 and ±10.5 cm, as shown in figure 3.The poloidal angle between each probe is 7.5°,which is the same as that of PMA2.
3.2.BR probes
In addition to theBZprobes,three toroidal rows of probes are designed to measure the radial magnetic fieldBR, and hence detect locked modes from the HFS.The toroidal symmetries of theBZprobes are guaranteed by the symmetry of the divertor targets, which have a small inclined angle with the magnetic field lines[17]and all the leading edges are avoided due to the high installation accuracy.
The ex-vessel saddle loops, which are routinely used to measure the radial magnetic perturbation on the low-field side(LFS), have some inherent disadvantages:
(2) The radial magnetic field from the plasma is shielded by the vacuum vessel’s wall, and hence presents a phase shift for a rotating mode or a time delay for a growing locked mode.
(3) The ex-vessel saddle loops have a large poloidal coverage of Δθ~90°, so it is hard to measure the highermmodes, e.g.m>2, with sufficient resolution.
TheBRprobes were designed by taking comprehensive measures to overcome the above disadvantages.TheBRprobes are fairly small and hence have no limitation ofm,due to their poloidal coverage.The probe array is divided into two groups.One group arranged behind the divertor target plates near ports 2,6,9,and 13,i.e.90°apart from each other.Each port contains three probes,which are placed atZ=0,16,and−16 cm.The other group only contains two probes distributed in the midplanes of ports 4 and 11, 180° relative to each other in the toroidal direction.Both groups avoid the influence of magnetic perturbations produced by the RMP coils.
To reduce the eddy current effect, the 316 stainless steel supporting plates behind the Mirnov probes are engraved with three 1 mm slits,so as to interrupt the eddy current circuit and hence improve the high-frequency response.A 1 cm-thick nylon gasket is used between the Mirnov probe and stainless steel support plate to ensure a certain distance between them,which further reduces the influence of the eddy current effect[18].The probes are installed radially 31 cm away from the magnetic axis and 5.5 cm from the boundary of the plasma,and measure larger magnetic perturbations due to their reduced separation from the plasma.

Figure 3.The layout of the HFS Mirnov probe array designed and installed in February 2019.Red and blue rectangles represent BR and BZ probes, respectively.
Figure 3 shows a schematic map of the newly built HFS Mirnov probe array.The red and blue rectangles representBRandBZprobes,respectively.TheNSvalues of both theBRandBZprobes,as calibrated by Helmholtz coils[19],are 689 cm2,the same as that of PMA2.
4.Measurement of locked modes
The Mirnov probes installed in the HFS have a much smallerNSvalue compared to the big saddle-loop sensors, which are generally used for the detection of locked modes.However,owing to the excellent toroidal symmetry of the probe installation, the integrated signal of the HFSBRprobes,BR,also shows good toroidal symmetry among the probes located at the same poloidal angle but different toroidal angles.This symmetry permits the measurement of locked modes or QSMs via the HFSBRprobes, as will be shown in the following subsections.The HFSBRprobes located atZ=16 or−16 cm measure bothBrandBθ, so a subtler analysis is needed for the locked-mode measurement.In this work, we only discuss measurement via the HFS midplaneBRprobes,which measureBr.
In the analysis of non-rotating,or slowly rotating modes,four probes toroidally located 90° apart are required to calculate the amplitudes and phases of the modes.Signals from probes toroidally 180°apart are subtracted from each other to remove the influence of the equilibrium field and then integrated to provide then=odd component of the radial magnetic field,.Since the vectors corresponding to the two groups of signals are perpendicular to each other, then=1 radial magnetic field (due to the locked mode should be the vector sum of the two signals.
4.1.Quasi-static mode
Figure 4 displays a typical QSM detected by the HFS midplaneBRprobes in J-TEXT discharge #1065750.The four probes used in this session are located at the toroidal phases of φ=41.25°,131.25°,221.25°,and 311.25°(ports 2,6,9,and 13), which are 90° apart from each other.The basic plasma parameters in this shot are as follows:Ip=175 kA,Bt=2.0 T, safety factor at the plasma’s edgeqa=4.4, and the core line-averaged electron density as measured by polarimeter-interferometerne=2.0×10¹⁹m−3.As shown in figure 4(a), anm/n=2/1 high-frequency tearing mode slows down and locks at 0.12 s, leading to a QSM status.During the QSM phase, the amplitude and phase ofmeasured by the HFS midplaneBRprobes show the quasistatic features of the mode.The QSM rotates for 6 periods with an average frequency of ~20 Hz,i.e.TQSM=25–50 ms.During each period, the phase velocity of the QSM(dφn=1/dt) is variable, and the amplitude of the QSM decreases sharply when dφn=1/dtis large, e.g., at around 0.3 s.These features might be due to the interaction between the QSM and the error field (EF) [4], where the resonant component of the EF contributes an acceleration torque and a suppression effect to the QSM in a particular phase region [20, 21].
The Grimms offer a different ending in which a huntsman happens by and rescues the grandmother and Little Red Riding Hood by disemboweling the wolf. The two females escape from the wolf unharmed, like Jonah from the belly32 of the whale. The huntsman then sews rocks back into the wolf s stomach for punishment. The huntsman in this version represents patriarchal protection and physical superiority.
For most devices, QSMs or locked modes can only be measured at one poloidal location, and hence it is generally hard to identify the poloidal mode structure or the poloidal mode numbermof the mode.At J-TEXT, three toroidal arrays of Mirnov probes and four toroidal arrays of saddle loops are available, which makes it possible for QSMs or LMs to be measured at six poloidal locations.
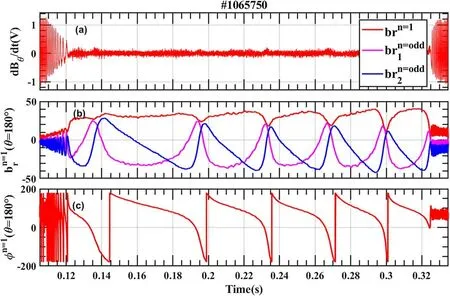
Figure 4.Detection of a slowly rotating magnetic island in discharge #1065750.(a)Mirnov signal dBθ/dt showing mode locking at 0.12 s and mode unlocking at 0.32 s.The amplitude(b)and phase(c)of the n=1 radial magnetic field(),as measured by the BR probes in the HFS midplane, show the slow rotation of the island.The two n=odd components (the blue and magenta lines) are also shown in (b).

Figure 5.Phases of the QSM measured by magnetic diagnostics at J-TEXT.(a) Toroidal phases of measured by the BR probes in the HFS midplane(red)and three rows of in-vessel saddle loops,i.e.,LFS(blue,dotted),bottom(magenta,dashed)and top(green,dash-dotted).(b)Toroidal phases of (cyan)and (purple,dashed)measured by the Br and Bθ probes in TMA1.(c)Poloidal phases of the O-points of the QSM measured by the Bθ probes in PMA1 (red) and PMA2 (green, dashed).
Figure 6.Contour plot of the distribution of =sin(2θ∗+φ+ξO),assuming the helical phase of the 2/1 island O-point at ξO=360°,versus the phases of (green squares)and bθn=1(green dots)measured by various magnetic diagnostic arrays at t=0.18 s.The locations of the Mirnov probes are indicated by gray rectangles.The helical dashed lines represent 2/1 magnetic field lines with a maximum(black)or minimum(grey)of and a maximum (red)or minimum (blue)of .The green rectangles and dots are the maximum values of the br and bθ signals at 0.18 s measured by each group of magnetic diagnostics.
Figure 5 displays the toroidal and poloidal phases of a QSM in discharge #1065750.The toroidal (or poloidal)phases represent the toroidal (or poloidal) locations of the maximal δbθor δbr, as measured by a toroidal (or poloidal)array.Figure 5(a)displays the toroidal phases of δbr,φn=1,br,measured by three rows of in-vessel saddle loops and the HFSBRMirnov probes, which are installed at θ=0°, 90°, 270°,and 180°, respectively.It is found that the values of φn=1,brmeasured by the top (green) and the bottom (magenta) invessel saddle loops are almost the same and have a difference of around 180° with respect to φn=1,br|θ=180°through the QSM phase from 0.12 s to 0.32 s.The φn=1,brmeasured in the LFS (blue) shows a similar trend to that of φn=1,br|θ=180°,except that it is slightly larger during the slow phase-variation duration, e.g.from 0.14 s to 0.18 s.The dependence of φn=1,bron θ indicates that the QSM has a dominant poloidal mode numbermof 2.Figure 5(b)shows the toroidal phases of δbr(φn=1,br|θ=315°, cyan) and δbθ(φn=1,bθ|θ=315°, purple)measured by the TMA1Brprobes and TMA1Bθprobes,respectively.Both phases shown in figure 5(b)have a similar trend to those of figure 5(a), and φn=1,br|θ=315°leads φn=1,bθ|θ=315°for around 90°, which is generally observed for a tearing mode.
When QSMs are present, the 3D perturbed magnetic fields, i.e.δbθm/nand δbrm/nvary with the slow rotation of the QSMs, and hence the δbθand δbrmeasured at fixed spatial positions undergo maximums and minimums over time.By tracing the appearance of these maximums of δbθand δbrat various probes in a poloidal Mirnov array, the excursions of the poloidal phases of δbθm/nand δbrm/ncan be obtained.Figure 5(c) displays the phase of δbθmeasured at φ=259°(red, PMA1) and φ=56.25° (green, PMA2), which also represent the poloidal positions of the O-point of the magnetic island (θO).The O-point rotates in the –θ direction, which is consistent with the decrease of φn=1,bθ|θ=315°in the –φ direction.The time evolution of θOalso reflects the features of QSM as measured by the toroidal arrays, i.e.the phase velocity dθO/dtis small for a large fraction ofTQSMwhen dφn=1/dtis also small,while dθO/dtand dφn=1/dtare larger in the rest period.
Two O-points are observed by PMA2 for a large fraction of the QSM’s rotational period,TQSM; the poloidal distance between these two O-points is around 180°.If one O-point rotates to the phase range from –150° to –210° (or 210° to 150°), e.g.from 0.188 s to 0.195 s, the remaining probes of PMA2 can no longer detect this O-point, meaning that only one O-point is observed by PMA2.The remaining probes of PMA1 only cover a poloidal range of 180°,hence it can only observe one O-point for almost all of the QSM period.At a toroidal separation of around 200°,θO|φ=259°from PMA1 has a poloidal separation of around 80°–100° with respect to θO|φ=56.25° from PMA2.This supports the statement that the QSM has a dominantmof 2.
To visualize the helical structure of the QSM, figure 6 displays the phases of δbθ(green dots)and δbr(green squares)measured by either the toroidal or poloidal arrays at 0.18 s in figure 5,together with the 2/1 magnetic field lines in the θ-φ panel.The background contour shows the distribution of δbθ2/1=sin(2θ∗+φ+ξO),where θ∗is the poloidal angle in straight field-line coordinates and ξO=360° is the helical phase of the O-point.For aq=2 surface, θ∗can be approximately calculated via θ∗=θ−0.3sin(θ) according to the equilibrium fitting (EFIT) equilibrium.The two red (or blue) dashed lines represent the maximum (or minimum) of,while the two black(or gray)dashed lines represent the maximum (or minimum) of.It can be seen that the measured O-points(green dots)lie near the helical red dashed lines, while the measured maximal δbrlies helically near the black dashed lines.This indicates that the helical 2/1 structure of the QSM in the θ-φ panel can be accurately captured by the spatially distributed magnetic diagnostics at J-TEXT.

Figure 7.The measurement of locked islands during RMP penetration with four different RMP phases in discharges #1061384,#1061386,#1061388, and #1061389.(a) RMP current, (b) amplitude and (c) phase of the n=1 radial magnetic field (), measured by the BRprobes in the HFS midplane.
4.2.Locked mode due to RMP penetration
Figure 7 shows a typical case where HFSBRMirnov probes are used to measure the plasma’s response to the RMP.In these four shots, the plasma parameters are kept the same, i.e.,Ip=180 kA,Bt=1.7 T,qa=3.5, electron densityne=1.1×10¹⁹m−3, while the RMP fields are applied using four different toroidal phases.The RMP phase,ξRMP,is defined for the dominant resonant component, the 2/1 RMP component,via its spatial distributionbr,RMP=×cos(mθ+nφ−ξRMP).ξRMPincreases by 90° successively from discharges #1061384,#1061388,and #1061389 to #1061386.The time evolution of the RMP current (IRMP) is shown in figure 7(a).IRMPramps up quickly to around 4 kA at 0.26 s and is maintained for around 30 ms to trigger the RMP penetration and the formation of a locked island.Once the locked island is excited,IRMPis reduced to a smaller value of 1–2 kA, so as to avoid disruption due to the large locked island but to retain the locked status of the excited island.From 0.3 s to 0.5 s,IRMPis increased with 3 flattops.It is found that the phase of the locked island (φn=1in figure 7(c)) increased at around 90° with the RMP phases ξRMPin these four discharges.Further analysis of the subtle changes of the island phase and amplitude evolution is ongoing to reveal the features of these locked islands and the EF.
Figure 8 displays a comparison of then=1 radial magnetic field measured by three probe arrays, i.e.the HFSBRprobes (black), the toroidal Mirnov array at −45°(magenta),and the LFS saddle loops(red).The amplitudes of then=1 field present similar evolutions.At 0.3–0.5 s, the measured locked island phases are different, and during the unlocking phase from 0.5 s to 0.55 s, the three phases decrease for around 360° and retain similar differences.This phase difference directly reflects the poloidal mode structure(or mode number) of the locked island.Assuming that the locked island produces ann=1 field with a distribution ofbr,island=br∗cos(mθ+nφ−ξn=1),then the measuredn=1 phase at a specific toroidal probe array will be φn=1=−mθArray/n+ξn=1/n.ξn=1is the helical phase of the 2/1 island, and it is the same for all toroidal arrays.Figure 9 displays the dependence of the measured φn=1on θArrayfor the three toroidal arrays.A linear fit to the data gives a poloidal mode numberm=1.83, which is around 2.The reason why there is a gap between the measured value and 2 may be correlated with the poloidal inhomogeneity of the LM, and multiple modes may also exist.
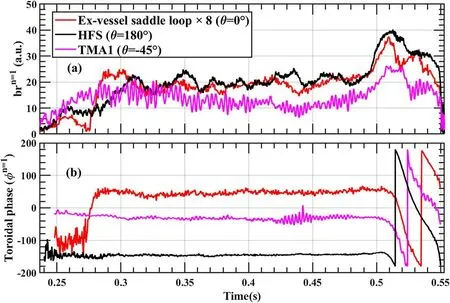
Figure 8.Detection of the locked mode in discharge #1061384 by three toroidal Mirnov arrays located at θ=0°, 180°, and −45°,respectively.The (a) amplitude and (b) toroidal phase of the LM.
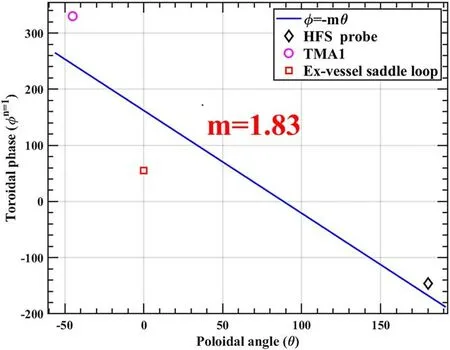
Figure 9.Poloidal mode number obtained by fitting the toroidal phase to the poloidal location of the measurements.
There are still some remaining features shown in figures 7 and 8 that need to be studied in the future.(1) At around 0.27 s in figure 8(b), there is a sharp φn=1change of~180° measured at θ=0°, which was previously explained as the plasma response transition from screening to amplification [5].However, this feature is absent in φn=1measured at θ=180° and −45°, which remained almost constant.(2)When the RMP is off at 0.5 s, the locked islands begin to rotate and finally unlock.However, then=1 amplitude(brn=1) increases significantly at first, as shown in figures 7 and 8.This goes against the general understanding that the locked island is destabilized and excited by the RMP field,so its amplitude should reduce once the RMP is switched off.Besides,this anomalous feature is not observed in #1061388(black lines in figure 7),which might link it to an RMP phasedependent phenomenon.
One possible cause for these two features is the presence of multiple plasma responses to the multiple poloidal harmonics of the applied RMP fields[22],e.g.the 1/1,2/1,and 3/1 fields.The combination of these responses leads to the above ‘anomalous’ features.Future research will concentrate on understanding these features.
4.3.Discussion
This work only provides a preliminary measurement of the locked mode, and cannot simultaneously resolve several locked islands with various helicities at different rational surfaces (RSs).Future analysis will be necessary that adopts modelling using helical currents flowing at several RSs, as described in [23].
In figure 8, the amplitude calculated by the HFSBrprobes is eight times larger compared with that of the exvessel saddle loops on the LFS.This difference is considered to be caused by spatial averaging of the ex-vessel saddle loops.The ex-vessel saddle loops at J-TEXT span 0.58 m in the poloidal direction and 0.32 m in the toroidal direction, or equivalently, approximately 0.58π radians and 0.074π radians, respectively.In the large aspect ratio, circular crosssection approximation, the attenuation factorαm n,of a measured harmonicm/ndue to spatial averaging [24]can be approximated as

The bounds of the integral are defined by the angular coverage of each of the saddle loops described above.Thus, the amplitude of them/n=2/1 component measured by the exvessel saddle loops should be multiplied by 1 /(1−α2,1)≈5.9.In addition,the distances from HFS Mirnov probes and ex-vessel saddle loops to them/n=2/1 rational surface are different,which may also lead to a difference in the amplitudes of the measured signals.In the circular cylinder, infinite aspect ratio,and vacuum approximation,the tearing field falls off outside the rational surface where it originates, according to
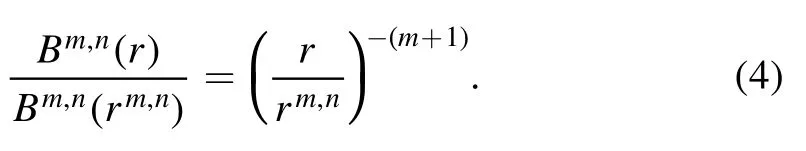
The width of the vacuum vessel wall at J-TEXT is about 20 mm, which means that the ex-vessel saddle loop is 20 mm further away from the 2/1 rational surface than the HFS Mirnov probe array.The position of the 2/1 rational surface inverted by the EFIT program, which is atR=1.259 m,in discharge #1066384 is 1.205.Thus,taking the two effects above into account, the amplitude of them/n=2/1 component measured by the HFS Mirnov probes is 7.11 times larger than that of ex-vessel saddle loops, which is close to 8.
Besides, recent studies have shown that the phase relationship between high-frequency 2/1 and 3/1 islands, which are phase locked, might be in the range between 0 and π [25].Relevant studies of this are also necessary for locked islands,to support an understanding of locked-mode-induced disruptions.
5.Summary
This paper presents the current status of the magnetic diagnostics dedicated to measuring MHD instabilities at the J-TEXT tokamak.During the past four years,several changes to these arrays have emerged.The formerBrandθBprobes of poloidal magnetic probe array 2 have been replaced by a new probe with a coincidentNSvalue of 689 cm2.The spatial distribution of the in-vessel saddle loops has been greatly expanded from two loops to twenty-four loops through this upgrade.Due to the installation of HFS divertor targets in early 2019, some of the probes were removed, but an HFS Mirnov array was designed and installed behind the targets.The HFS Mirnov array provides valuable new information on the locked mode or QSM from the HFS for the first time at J-TEXT.Besides, various groups of magnetic diagnostics at different poloidal locations are used to systematically measure the QSM,giving the poloidal mode numbermand the helical structure of the QSM.By including the HFS information, the 2/1 RMP-induced locked mode was measured to have a poloidal mode number m of ~2.
Acknowledgments
This work was supported by the National MCF Energy R&D Program of China (No.2018YFE0309100), National Natural Science Foundation of China (NSFC) (No.11905078) and‘the Fundamental Research Funds for the Central Universities’ (No.2020kfyXJJS003).
猜你喜欢
杂志排行

Plasma Science and Technology的其它文章
- UV and soft x-ray emission from gaseous and solid targets employing SiC detectors
- The acceleration mechanism of shock wave induced by millisecond-nanosecond combined-pulse laser on silicon
- Investigation of non-thermal atmospheric plasma for the degradation of avermectin solution
- Laser-induced breakdown spectroscopy for the classification of wood materials using machine learning methods combined with feature selection
- Colorimetric quantification of aqueous hydrogen peroxide in the DC plasma-liquid system
- Plasma-assisted Co/Zr-metal organic framework catalysis of CO2 hydrogenation:influence of Co precursors