Evaluation of tool wear and cutting performance considering effects of dynamic nodes movement based on FEM simulation
2021-05-14ZhenyuSHIXinLINingminDUANQibiaoYANG
Zhenyu SHI, Xin LI, Ningmin DUAN, Qibiao YANG,c
a Key Laboratory of High Efficiency and Clean Mechanical Manufacture, Ministry of Education, Shandong University, Jinan 250061, China
b School of Mechanical Engineering, Shandong University, Jinan 250061, China
c School of Mechanical Engineering, Hubei University of Technology, Wuhan 430000, China
KEYWORDS Finite element method;Friction model;Machining;Stress distribution;Wear
Abstract An accurate estimation of tool wear morphology can provide the opportunity to investigate the influence of tool wear on cutting performance as well as reduce the overall production cost. However, tool wear prediction is still a very challenging research issue. In this paper, a novel method for simulating the actual chip formation and wear evolution thorough the 3D finite element model has been carried out.In order to improve the accuracy of simulation results,the influence of worn tool,stress and temperature distribution on wear rate are considered.Then cutting experiment has been conducted by turning AISI1045 with uncoated carbide tools to validate the accuracy of the proposed model. The comparison between experimental and simulation results show good agreement which proves the ability of the proposed model in forecasting the tool wear. The validated finite element model has been further utilized studying how the worn tool affects the cutting performance including actual cutting rake, stress distribution, cutting force and temperature. The results of this paper not only provide a clear understanding of wear evolution between tool rake face and chip, but also are meaningful to optimize tool design and cutting parameters.
1. Introduction
Metal cutting is still one of the most important manufacturing processes in industry.Up to 15%of the value of all mechanical components manufactured worldwide is derived from metal cutting operations.During the machining process, tool wear affects the tool life,the tool substitution policy and the quality of final products in terms of roughness, geometrical accuracy and residual stress state. Researchers indicated that tool wear was affected by the material adhesion,abrasion,erosion,diffusive wear, corrosion and fracture.And wear mechanisms generally existed simultaneously, even if only one or few of them were dominant.
Many methods had been conducted to predict the tool wear morphology and wear amount. One of the methods was to establish wear model analytically. The wear rate was treated as a function of cutting parameters such as cutting velocity,feed, depth of cut. Pa´lmaisuggested the abrasive wear amount was estimated to be proportional to the sliding velocity and independent of temperature, whereas the rate of physical-chemical wear process depends largely on the interface temperature. Usui et al.established the wear rate mode by taking into account the effects of contact pressures, sliding velocity and interface temperature. However, those analytical models didn’t have high accuracy in predicting wear amount since they ignored the thermo-mechanical loads on the tool edges would vary with the cutting condition and wear evolution. Meanwhile, those analytical models still needed the contact information such as contact pressure and interface temperature to be input, which were difficult to be measured accurately during the machining process.
Another mothed to predict the tool wear morphology and wear amount was presented by combining finite element method (FEM) and wear rate model. Yen et al.developed a methodology for tool wear simulation by implementing the well-known Usui wear rate model into a two-dimensional cutting simulation. Similarly, Filice et al. simulated both flank and crater wear in a two-dimensional model with an innovating method that tool meshes were updated directly during cutting process in every 30 s.However, the shortcomings of simulations in two-dimensional models were that tool details such as the inclination angle and the nose arc were ignored and were only used in the orthogonal cutting condition.The 3D FEM software (DEFORM 3D, AdvantEdge, ABAQUS) allowed the simulation of tool wear progression in longitudinal turning operations. Many researchers predicted tool wear geometry and the influence of wear on cutting performance with the commercial wear rate codes inside the software.Attanasio et al.estimated tool wear development during turning operations by taking into account diffusive wear mechanism. The tool wear simulation results showed good accuracy in terms of crater extension, but problems in the correct identification of crater depth and position were noticed. Then the author used the coupled abrasive-diffusive model to present the tool wear for machining of AISI1045 with uncoated WC tools.A comparison between experimental and simulative results showed a general good agreement in crater wear parameters. However, the most simulation results mentioned above only focused on orthogonal cutting model and ignored the influence of the worn tool geometry on the wear rate.Meanwhile,the simulations combined with constant wear rate ignored stress and temperature distributions on the tool rake and would lower the accuracy of FEM results.
To overcome these limitations, in this paper an innovation method for simulating the actual chip formation and tool wear evolution by means of the 3D FEM simulation has been carried out. The wear rate model is implemented into the nodes movement subroutine for performing tool wear morphology.The wear rate is decided by considering the worn tool geometry,stress and temperature.The cutting tool is modelled in the 3D model by considering the nose arc and inclination angle.The dynamic nodes movement technology has the advantages of simulating tool wear in lower consumption time and better accuracy by comparing with Arbitrary Lagrange-Euler (ALE)or remeshing technology. Then cutting experiment is performed by turning AISI1045 with the uncoated carbide tool to validate the ability of the proposed model. The comparison between experimental and FEM results show a good agreement to prove the ability of the combined tool wear model in forecasting the tool wear.The validated finite element model has been further utilized studying how the worn tool affects the cutting performance including actual cutting rake,stress distribution and cutting force.
2. Workpiece material and procedures
Machining experiments were performed as shown in Fig.1 and the machined material was AISI1045. Cylindrical bars with 110 mm diameter and 50 mm length was used for the experiments. The cutting tool used (Grade: CNMG120404, Kennametal Inc.) was the uncoated tungsten carbide tool with the nose arc r=0.4 mm, initial rake angleγ=0°, clearance angle α=0°and inclination angle λ=5°.The material properties were summarized in Table 1.
The specific cutting parameters were selected at the cutting speed 70 m/min, the feed rate 0.2 mm/r, and the width of cut 1 mm.The dynamometer Kistler 9129AA was applied to measure the cutting forces. The K type thermocouple was used to measure the temperature on the cutting tool, which was combined with a multiple channel USB data acquisition module OM-DAQ-2401. Detailed tool wear in terms of tool rake face and flank face were measured using scanning electron microscope (SEM) ZEISS EVOMA 10 and the confocal laser scanning microscope (CLSM).

Fig. 1 Experimental setup.

Table 1 Material properties of AISI 1045 and cutting tool are input for finite element model.18,19
The machining experiments were performed in dry cutting environment and the temperature and wear amount were measured to determine the wear rate constants Cand Cas described in Section 3.3.1.Then the wear amount,cutting force and temperature were summarized in Section 4.2 to validate the simulation results.
3. Tool wear simulation

Fig. 2 Steps of tool wear simulation algorithm.
Fig. 2 illustrates the steps of the tool wear evolution. Firstly,the finite element model is set up to simulate the chip formation. When the error between simulated force and experimental force is less than the setting value, the variables including contact area, stress, sliding velocity and initial interface temperature are output to calculate heat flux and tool temperature during cutting process. Secondly, it is necessary to reach the thermo-mechanical steady-state. Once the simulated temperature meets the measured value at some positions on the rake face, the temperature distribution on the rake face is decided.Then those variables are input the selected wear model and the wear value of each tool node in the contact area is calculated individually.Thirdly,the tool wear subroutine is applied to perform the worn tool geometry. The nodes movement are decided by the selected wear model and Python subroutine.Then the tool geometry is updated and used to reach the next mechanical and thermal steady-state. This procedure continued iteratively until the total cutting time reached 600 s and all tools in experiment tests had serious wear or broke off before that time.
3.1. Finite element modelling
ABAQUS software is taken in this paper since it could perform machining process effectively and support user definition programs as input to define variables such as residual stress,constitutive model or friction model. In simulation, stress should be decided with strain and elasticity and the rigid tool model in the previous references is inappropriate.In this paper, the tool is treated with an elastic-plasticity model to present stress distribution and strain on tool rake face.
A three-dimensional model is carried out by considering the influence of the inclination angle and nose arc on cutting performance. In simulations, more meshes would be benefit to improve the accuracy of results but lead to huge computer time. To balance the accuracy of the simulation and the consumption time, the hexahedron mesh is taken and minimum mesh size around the cutting region is 0.005 mm, whereas the mesh in other parts enlarge slowly as shown in Fig.3.The tool model is meshed with 98525 prism or hexahedron elements,which performed better than in tetrahedral elements in previous simulations and the workpiece mesh are 199775 hexahedron elements. The workpiece is revolved with speed 200 r/min and tool is fixed following the actual cutting process.The cutting feed in the simulation was taken with 0.2 mm/r and width of cut 1 mm, which are same with the experimental parameters shown in Section 2.

Fig. 3 FE model and boundary conditions.
The constitutive model represents work material behavior under different strains, strain rates and temperatures.Johnson-Cook(J-C) model could represent elastic, plastic and thermo-mechanical behaviors of material deformation under different cutting processes, which is widely used in cutting simulations.

3.2. Friction model and the friction coefficient
The sticking-sliding friction model could represent both sticking and sliding regions and was widely adopted by many researchers to define the friction properties at the tool-chip interface. The shear stress is fully defined by normal stress σ(x) and friction coefficient μ. The interfacial contact occurred along two distinct regions:In the plastic region characterized by a sticking friction with a plastic localization in the secondary shear zone (SSZ) near the tool tip, shear stress reached a maximum level as shown in Eq. (2a).
τ(x)=τwhen τ≤μσ(x) and 0 ≤x ≤l(2a)
In the elastic region characterized by a sliding friction and a linear proportionality between normal and shear stress as shown in Eq. (2b).
τ(x)=μσ(x)When μσ(x)<τand l≤x ≤l(2b)
The friction coefficient had an important influence on the accuracy of simulation results.In this article,the mean friction coefficient μis determined from cutting force and tangential force measured in experiments.

where Ris the cutting heat partition coefficient,η is the factor to convert mechanical energy into thermal energy and Vis the sliding velocity at tool-chip interface.
According to the models based on Blok’s theory,the factor Ris assumed as a constant and that two bodies have the same maximal surface temperature.For the primary or secondary zone, the factor Rcould be calculated

Table 2 Johnson-Cook model parameters for AISI 1045.13,19
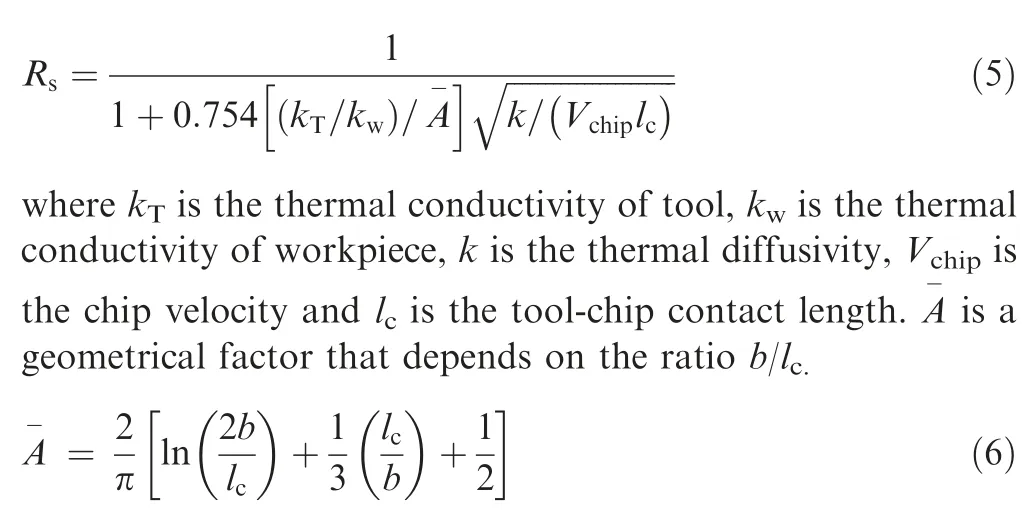
where b is the width of cutting tool.
In the numerical simulations, to ensure that heat can be transferred between the chip and the tool,the contact conductance hmust be adequately determined. In previous works,Filice et al.and List et al.have shown that a value of 10kW/(m·°C)for hwas sufficient to ensure a rapid stabilization of the cutting temperature at the tool-chip interface. In this case, his equal to 10kW/(m·°C).
3.3. The wear evolution process
3.3.1. Tool wear model
Many researchers indicated that the tool wear in machining can be caused by different mechanisms such as abrasion,adhesion,dissolution and diffusion.The tool mechanism varies with the cutting conditions and the thermo-mechanical properties of the tool-work materials would decide the amount of tool wear together.
Usui et al.suggested that the tool wear behavior of uncoated cemented carbides in machining steels would be estimated more accurately by taking into account the effects of contact pressures, sliding velocity and interface temperature on the tool wear rate.

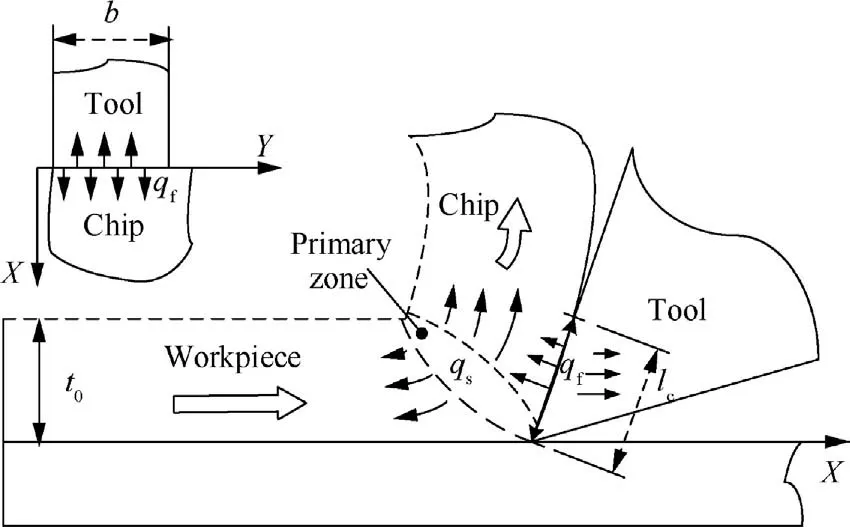
Fig.4 Chip formation with heat transfer during cutting process.
where the constants Cand Care the model constants of tool materials, Vis the sliding velocity, Tis the tool interface temperature and σis the contact pressure. This model had therefore been used by several authors to simulate the wear behavior of coated and uncoated tools in machining steels,Ti-6Al-4V titanium alloy and Ni-based superalloys by using proper sets of parameters Cand C.The results indicated that this model could well represent the abrasion effects.
In order to account for the changes of tool geometry through the wearing process, two constants Cand Cin the applied Usui tool wear equation (Eq. (2)) need to be calibrated.For the regression analysis,Eq.(2)can be rewritten as
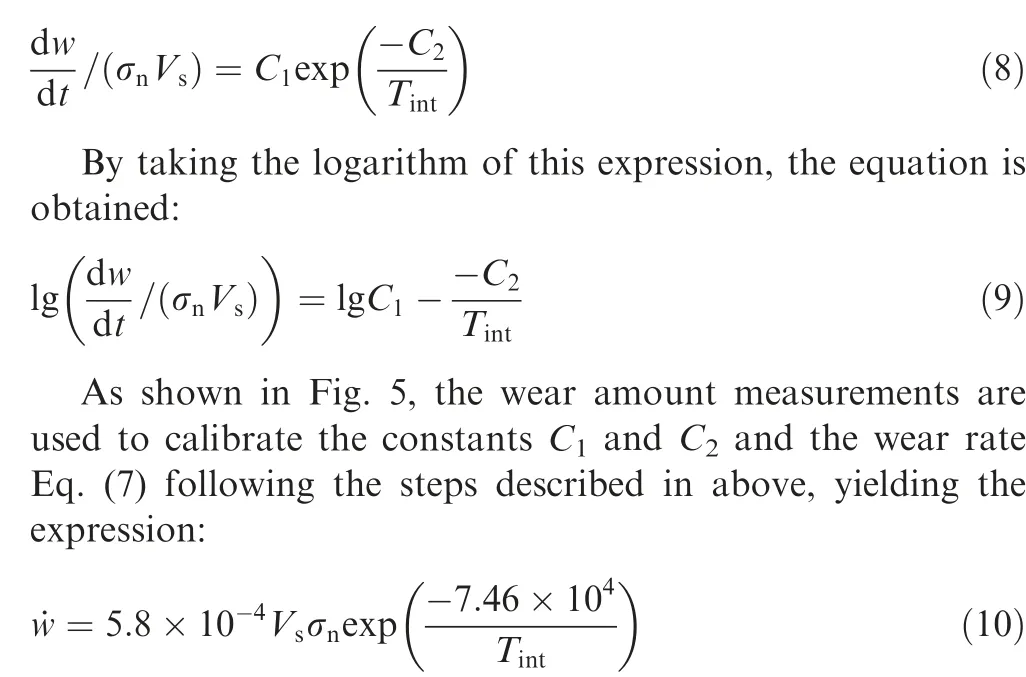
3.3.2. Nodes movement algorithm
Mesh nodes movement have been assigned according to the wear value during a time increasement. The advantages of dynamic nodes movement are avoiding remeshing tool geometry and lowering consumption time in the simulation. The nodes movement steps are shown in following.Firstly,the tool mesh is divided into several layers from the rake face to the bottom side. Secondly, the chosen nodes according to the FEM result outputs on the first layer are moved along the normal vector of the layer and the distance to the second layer is calculated to prevent negative elements happening. When the distance of neighbor nodes is beyond the setting value Δh,the deformed meshes are output and the subroutine is ending.Otherwise, the nodes on the neighbor layer would be chosen and moved repeatedly. The nodes movement algorithm and steps are shown in Fig. 6.

Fig. 5 Regression analysis for calibration of AISI1045 and carbide tool.
For any point (x, y, z) located on the tool-chip contact area, the vector normal to the surface is defined by n=(n,n,n).The displacement in the direction n during a time increasement Δt is then estimated by:

4. Result and discussion
4.1. Comparison of simulated crater wear and experiments
The crater wear is evaluated by calculating tool volume loss in Abaqus software. As shown in Fig. 7, the nodes movement would change the shape of rake face as well as decrease the tool volume. By comparing the deformed tool volume with the initial geometry, the crater wear is set. Fig. 8 reports the comparison between experimental and simulated tool crater.The experimental values are the mean value amongst five tests realized using the same process parameters combination. At the severe tool wear stage (t >400 s), the adhesive workpiece material is catastrophically broken off and takes away pieces of tool material easily, which result in the acceleration condition.

Fig. 7 Illustration of calculating cater wear in simulation.

Fig. 8 Tool wear depending on cutting time.

Fig. 6 Nodes movement process.
The crater wear would decrease the tool resistance section and lead to tool damage.The evolution of tool wear behaviors on rake face are shown in Fig.9.The deepest crater located at the distance away from the cutting edge and gradually increases with the increase of removed material volume.That is because at the beginning of cutting, the abrasion and adhesion are the main reasons that cause the tool wear and the depth of crater wear.Wear topographies of the tool rake face are taken to show that the abrasion and adhesion occurred simultaneously. During this period, the cutting temperature is not very high and some workpiece materials are stuck on the rake face with high pressure. As cutting continuing, the tool material becomes soften and is taken away with friction effect when the heat is accumulated. Both the experimental and simulated results show the same tendencies in terms of the evolution of crater occur and grow up.

Fig. 9 Evolution of experimental and simulated crater wear.

Fig. 10 Wear morphology of tool rake face at cutting time t=120 s.
The KT (crater depth) and KM (crater position) can be evaluated from the cross section of 3D surface topography of the tool rake face to show the details of crater growing up. The depth of crater wear gradually increases as cutting processing. As shown in Fig. 10(b) and Fig. 11(b), the error happens because of the adhesion materials existing.The adhesion material increases the height of the rake face, which is inconsistent with the assumption in this simulation that the wear only reduces the material of tools. Even that, the experimental and simulated results of tool section (Fig. 10(d) and Fig. 11(d)) are in good agreement and are evident showing the ability of the FEM model in forecasting the correct tool worn geometry.
Chip morphology results are shown in Fig. 12. The chip morphology in simulation matches well with experimental result. However, since the mesh deletion method is adopted to simulate chip formation, which was usually taken in previous simulations,some errors occur in predicting chip thickness. The accuracy of chip prediction is limited by the minimum mesh size in chip region.Further reducing mesh size will lower simulation efficiency significantly or cause mesh distortion badly.
4.2. Tool wear influence on cutting performance
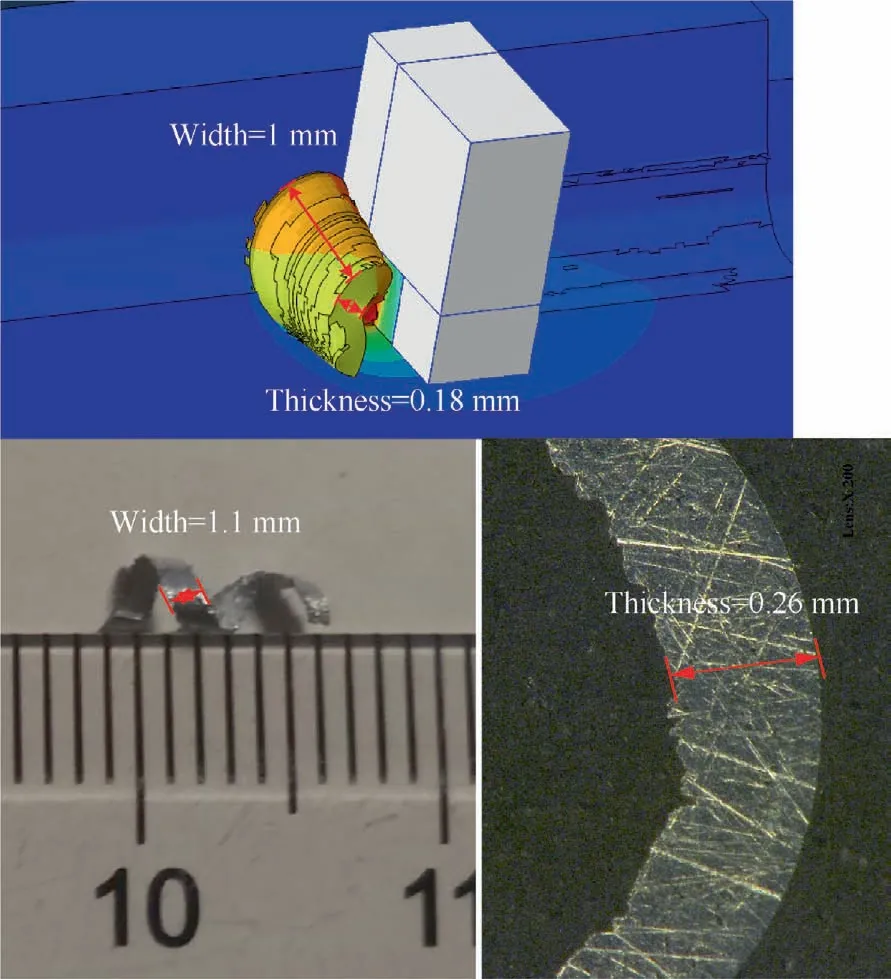
Fig. 12 Results of chip morphology at t=120 s.
As the amount of crater wear increases,the cutting parameters such as contact pressure, contact area or the real rake angle change. It is evident that the tool wear changes the rake angle(γ)from its initial value (γ)and consequently the actual resistance of the tool (in Fig. 13(a)). Higher rake angle values are related to low tool resistance section, as a consequence, the higher the actual rake angle, the higher the risk of tool breakage.

Fig. 11 Wear morphology of tool rake face at cutting time t=300 s.
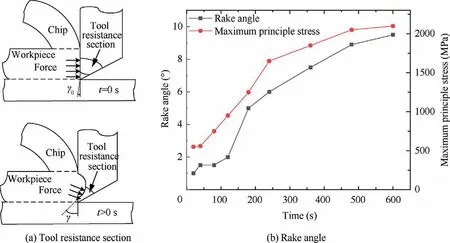
Fig. 13 Tool wear influence on tool resistance section and rake angle.

Fig. 14 FEM results at cutting time t=40 s.

Fig. 15 FEM results at cutting time t=120 s.
Meanwhile,the stress distribution on the rake face changes totally as the crater wear occurs and grows up. At the beginning of cutting (in Fig. 14), the maximum stress (450 MPa)only locates on the cutting-edge region near the nose arc. It is different to the orthogonal simulation results proposed by Xieand Attanasioin which the maximum stress stayed in the middle of cutting edge.It is reasonable because the inclination angle λ=5°is taken in this article,the maximum region exists near the nose arc where the rake face meets the workpiece and chip early. High pressure would make adhesive workpiece material catastrophically broken off and takes away pieces of tool material. As crater wear occurs, the decreased contact area or inadequate contact would obviously raise contact stress. In Fig. 15, the red region (contact stress beyond 750 MPa) have significantly enlarged and high stress gradient appears near the edges of the contact zone. The crater wear aggravates chip accumulating on the rake face, which results in the increase of stress and the change of actual rake angle.Fig.16 confirms that thermo-mechanical stress combined with the severe friction effect of chips bottom results in the maximum crater depth located at a distance away cutting edge and the exacerbation of tool wear. Serious crater causes further change of the actual rake angle. The real rake angle and maximum principle stress during cutting process are shown in Fig. 13(b).

Fig. 18 Cutting temperature depending on cutting time.
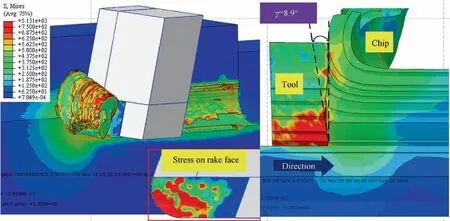
Fig. 16 FEM results at cutting time t=360 s.
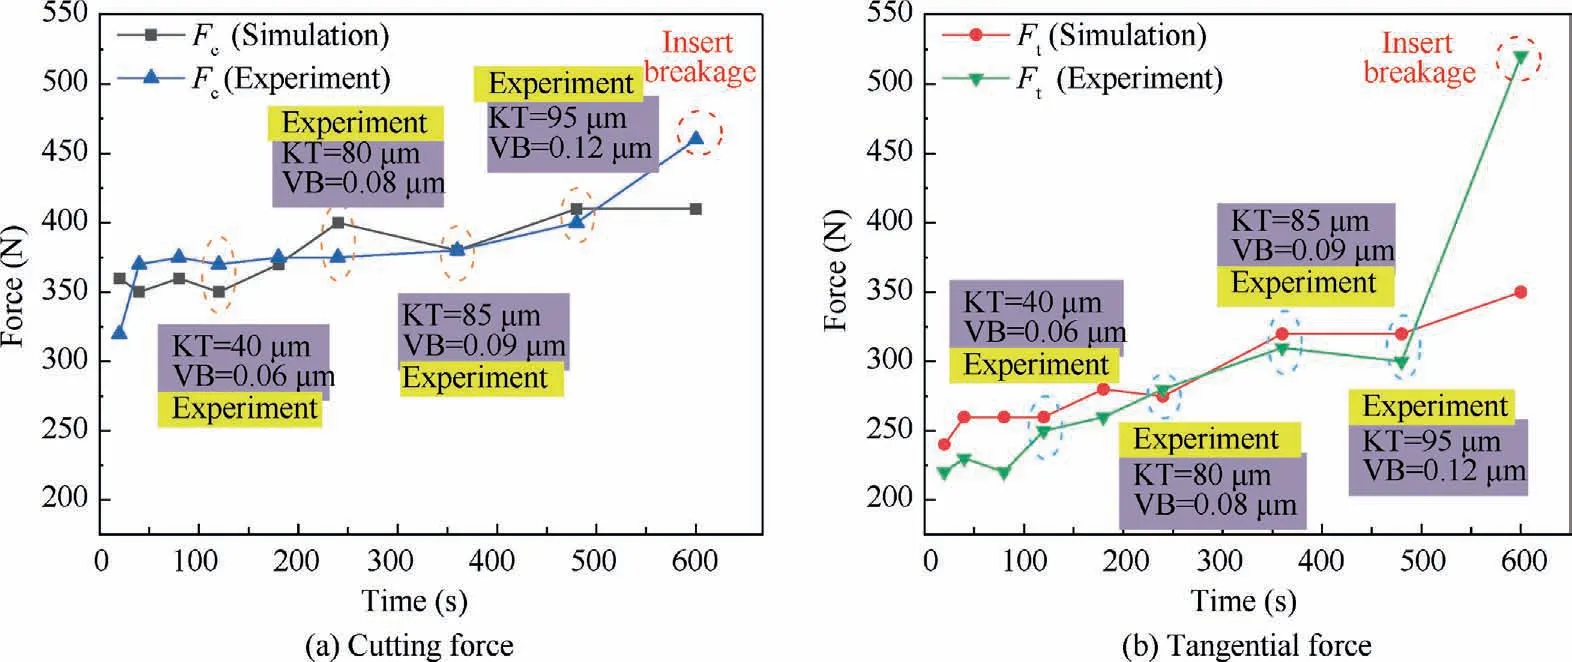
Fig. 17 Forces depending on cutting time.
The stress distribution in the tool resistance section and chip formation are shown in Fig. 14, Fig. 15 and Fig. 16. As crater wear occurs and grows up,the direction of contact force change and lead to higher contact stress and non-uniform stress distribution. After reaching the target time of 10 min in experiments,all the tool edges present serious wear or break.This indicates that the edge breakage and damage are the result of the decreased thickness of tool resistance, inadequate contact and increasing maximum principle stress.Liang et al.investigated the tool wear morphology evolution in cutting the titanium alloy Ti-6Al-4V and found the similar conclusion that the serious wear led to the cutting edge broken off catastrophically.

Fig. 19 Cutting temperature distribution.
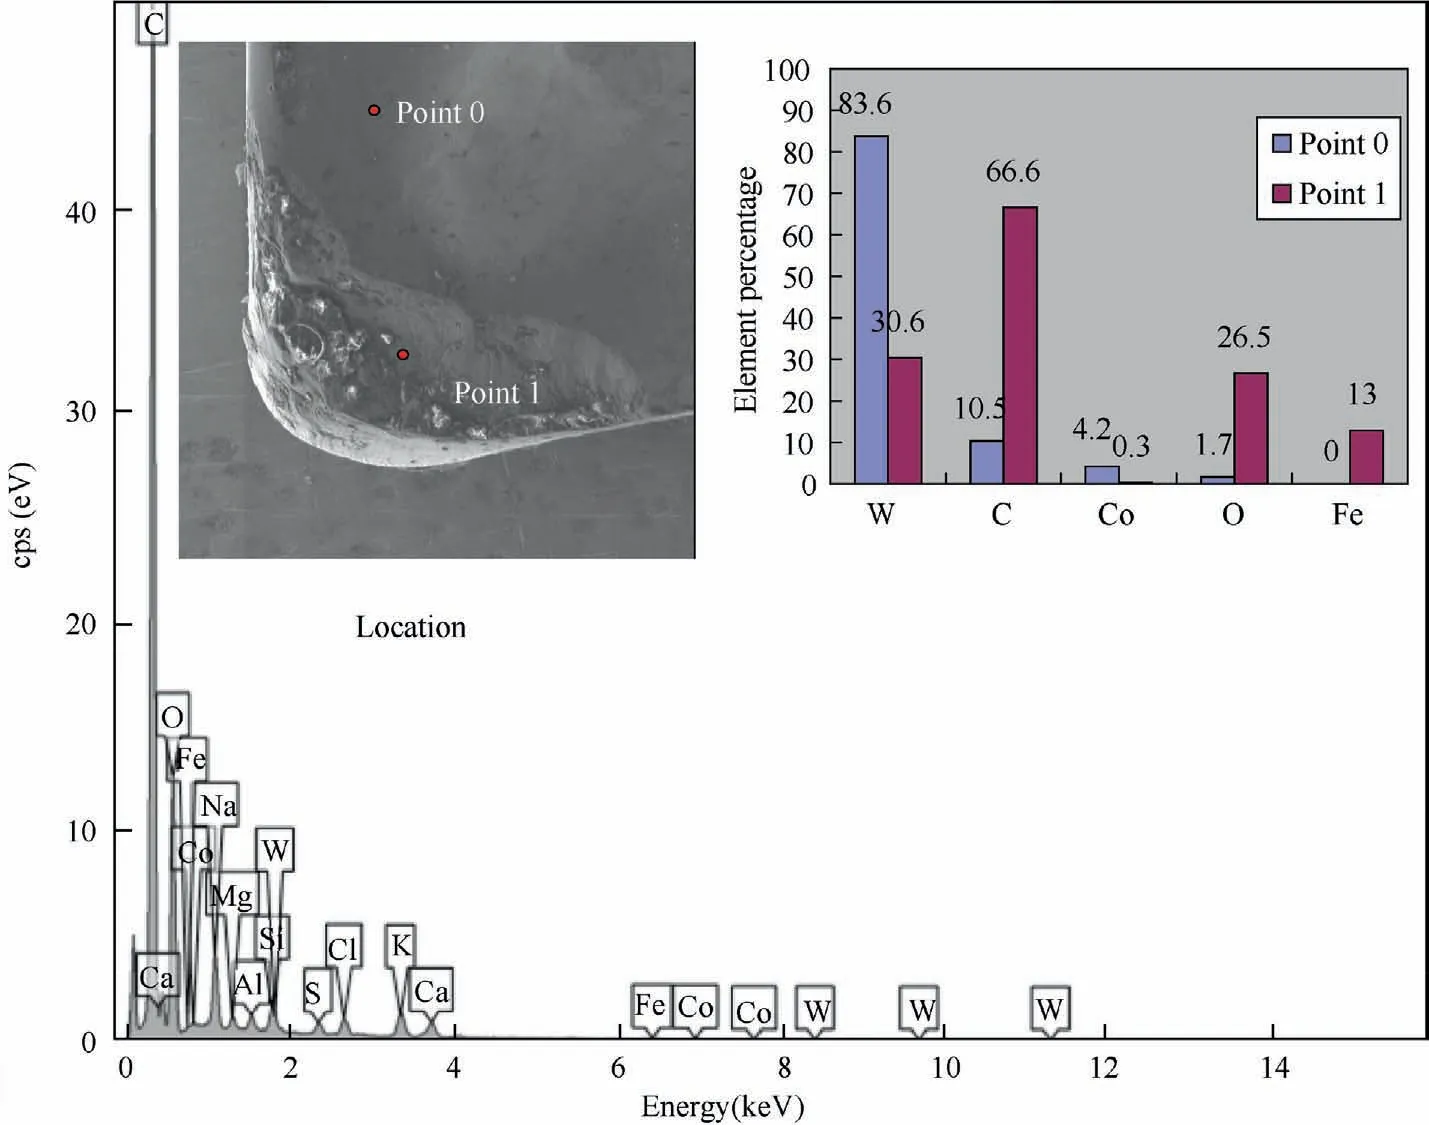
Fig. 20 Residual element and atomic percentage at rake face (point 1).
The tool wear behavior has directly impact on both the tangential force(F)and the cutting force(F).Seen from Fig.17,both the tangential force(F)and the cutting force(F)present an increase trend at the beginning.In this period,the abrasion and adhesion are the main reasons that cause the tool wear and the depth of crater wear gradually increases with the increase of removed material volume.Then when the cutting time reach 200 s,the accumulated frictional heat would accelerate the diffusion and the soften tool material would be taken away by the chip easier when the tool-chip interface is subjected to both higher thermal loads and mechanical loads. The tangential force (F) enlarges, whereas the cutting force (F) still stays a stable stage. Liang and Liuspecialized in the tool wear behaviors and got similar conclusions that the wear rate increased when cutting temperature raised. At the severe tool wear stage (t >500 s), both the tangential force (F) and cutting force (F) indicate an obvious increase. This result is related to the occurrence of severe adhesion due to the serious deterioration of tool wear, especially the tool-chip interface.Reference has revealed that this severe adhesion would lead to the average local sliding reduced significantly and that can explain the phenomenon of increasing the tangential force(F) in the severe tool wear stage.In experiments, the reason why the large errors of cutting force (F) and tangential force(F) occur at the end would be associated with the serious insert breakage under high thermal-mechanical load. The increasing depth of crater wear would lower tool resistance section and lead to severe adhesion, which results in higher the risk of tool breakage.
Fig. 18 shows the cutting temperature change during machining and simulation processes. The K-type thermocouple is buried in tool rake face outside contact region and the element temperature on the same position is output in simulation. The cutting temperature raises rapidly at the cutting beginning and stays stable at almost cutting process. The simulation results are good agreement with experiments. Temperature details are shown in Fig.19.At the cutting beginning(in Fig.19(a)),the maximal temperature locates near the tool arc,where the main wear mechanism is abrasion.Then cutting temperature raises and the maximal temperature position moves right with a distance away from the cutting edge (in Fig. 19(b)).As the cutting continuing,heat is accumulated in the crater wear,which leads to the main wear mechanisms become to adhesion and diffusion.Serious adhesion and diffusion in turn further promote the maximum temperature of crater wear (in Fig. 19(c) and (d)).
The chemical element distributions at the tool crater regions are measured to analyze the tool wear mechanism.The energy-dispersive spectrometer(EDS)results confirm that the element of oxygen(O)and iron(Fe)increase by comparing the element result of the Point 0 and Point 1,which prove that both serious adhesion and diffusion happened in crater wear region (in Fig. 20).
5. Conclusion
In this paper,a novel method for simulating the wear evolution and the cutting performance has been carried out. Dynamic nodes movement technology combined with wear rate model has been conducted to predict tool wear morphology and wear amount. The cutting experiment is performed by turning AISI1045 with uncoated carbide tool to validate the accuracy of the proposed model.The validated FEM model has been further utilized studying how the worn tool affects the cutting performance including actual cutting rake, stress distribution,cutting force and temperature. The results of this paper are meaningful to understand wear evolution during machining and realize the cutting performance under different wear conditions. The main conclusion of the paper are as follows:
1. The FE-based methodology of dynamic nodes movement can be used for predicting the tools wear morphology with less consumption time and numerical issues.
2. The crater would affect the actual rake angle as well as maximum principle stress and the edge breakage and damage are the result of the decreased thickness of tool resistance, inadequate contact and increasing maximum principle stress.
3. The maximum depth of crater wear locates on a distance away from cutting edge and is result of high contact stress and cutting temperature. In this zone, adhesion and diffusion are main reasons that accelerate the tool wear.
4. At the severe tool wear stage (t >500 s), both the tangential force (F) and cutting force (F) indicate an obvious increase. This result is related to the occurrence of severe adhesion due to the serious deterioration of tool wear,especially the tool-chip interface.
5. Heat accumulated in the crater wear results in the change of main wear mechanisms and serious adhesion and diffusion in turn further promote the maximum temperature of crater wear.
Declaration of Competing Interest
The authors declare that they have no known competing financial interests or personal relationships that could have appeared to influence the work reported in this paper.
Acknowledgement
sThe authors gratefully acknowledge the financial support for this work by the National Natural Science Foundation of China (No. 51975334), Key R&D project of Shandong Province(2018GGX103005 and 2019JMRH0407)and the Fundamental Research Funds of Shandong University.
杂志排行
CHINESE JOURNAL OF AERONAUTICS的其它文章
- Time delay compensation in lateral-directional flight control systems at high angles of attack
- Dual stability enhancement mechanisms of axial-slot casing treatment in a high-speed mixed-flow compressor with various tip clearances
- Development cost prediction of general aviation aircraft using combined estimation technique
- Improvement on shaped-hole film cooling effectiveness by integrating upstream sand-dune-shaped ramps
- Modeling and parameter identification of linear time-varying systems based on adaptive chirplet transform under random excitation
- An experimental method to obtain the hard alpha anomaly distribution for titanium alloy aeroengine disks
