黄海溶解无机氮时空变化及其水团对DIN总量的影响
2021-04-30金春洁张传松王丽莎石晓勇韩秀荣唐洪杰
金春洁,张传松,王丽莎*,石晓勇,3,韩秀荣,唐洪杰
黄海溶解无机氮时空变化及其水团对DIN总量的影响
金春洁1,2,张传松1,2,王丽莎1,2*,石晓勇1,2,3,韩秀荣1,2,唐洪杰1,2
(1.中国海洋大学化学化工学院,山东 青岛 266100;2.中国海洋大学海洋化学理论与技术教育部重点实验室,山东 青岛 266100;3.自然资源部海洋减灾中心,北京 100194)
本文根据2013~2016年4个航次调查资料,研究了黄海水体中溶解无机氮(DIN)的时空变化及其总量影响因素.结果表明:春、夏、秋和冬季黄海调查海域DIN平均浓度分别为(5.43±4.02),(4.47±3.16),(7.46±3.56)和(5.09±2.59)μmol/L.其中,秋季浓度最高,夏季最低;黄海调查海域各季节DIN的分布呈现近岸高、外海低的变化规律,近岸高值点多集中在长江口以北、山东半岛和辽东半岛等处.春~秋季影响DIN分布的因素主要是陆源输入和浮游植物的生长繁殖,冬季则主要是河流输入和沉积物再悬浮作用.四季在中央海域底层还存在一个高值区(>6μmol/L),主要受黄海冷水团和黄海暖流等共同影响;通过聚类分析法对黄海四季水团进行了基本划分,调查海域主要包括5个水团:黄海混合水团、黄海冷水团、黄海暖流水、沿岸水团和黄东海混合水团,除黄海混合水团终年存在外,其他水团均为季节性存在;调查海域DIN总量四季差异不大,整体含量介于1.0×106~1.5×106t,春、夏、秋和冬季DIN总量分别约为1.2×106,1.0×106,1.5×106和1.3×106t.春季和夏季受浮游植物吸收影响,DIN总量略低,从水团对DIN总量的贡献上来看,春季以黄海暖流为主,夏季以黄海冷水团为主,秋、冬季以黄海混合水团为主.
DIN;黄海;季节;分布;总量
黄海是典型的半封闭陆架边缘海,长期受人类活动和自然环境的双重影响,现已成为世界上近海研究中具有典型意义的研究对象之一.黄海终年存在着复杂的水团,对于营养盐的来源、分布和运移有重要作用[1-2].有研究表明,黄海环流、水体内部循环都会影响着黄海营养盐时空分布[2-8].
营养盐是海水中最基础的要素,同时也是维持海洋生物生命活动的重要生源要素[9],在一定条件下,营养盐的浓度、组成及分布的变化是导致藻华暴发的重要基础[10-13].其含量和比例的改变会影响浮游植物和藻类的群落结构及生长[14-15],现场调查结果显示营养盐的输入为大型藻类生长和暴发提供物质基础[16],而营养盐分布受环流、陆源输入和浮游植物消耗共同影响.氮是海洋中营养盐主要组成元素之一,海洋中总溶解氮(TDN)由溶解无机氮(DIN)和溶解有机氮(DON)组成,他们占总氮库的绝大部分[17].DIN作为溶解态氮的重要赋存形态,在藻类植物生命活动中占据重要地位,近年来黄海大面积暴发的浒苔绿潮灾害,与DIN浓度逐年上升有关[18-24].黄海浒苔绿潮藻类更倾向于吸收无机态氮盐,尤其是硝酸盐[25-26],DIN为绿潮发展提供了近87%的氮支撑[27],在绿潮暴发期间DIN浓度呈降低趋势[28].所以,DIN是支撑浒苔生长最重要的营养盐[29-33].因此,研究氮营养盐的变化规律并厘清其来源,对了解海洋氮循环、碳循环、生态系统变化以及海洋环境状况评估具有重要意义.
目前对黄海营养盐的研究多局限于南黄海或北黄海的讨论,且多以季节或短期变化为主.针对整个黄海DIN的较长期变化趋势及黄海环流和水团对其含量的贡献尚未见报道.本文以整个黄海DIN为研究对象,2013~2016年在黄海海域进行的4个航次调查数据为依据,阐述了近年来黄海海域DIN的分布特征和季节变化,并结合历史数据分析了DIN近40a的年际变化,探讨黄海DIN发生变化的原因和黄海环流及水团对DIN总量贡献的调控作用,为厘清黄海DIN来源、氮的地球化学循环和浒苔绿潮的防治提供一定的科学依据和理论支撑.
1 研究区域及分析方法
1.1 研究区域和站位
2013年6月22日~7月6日、11月6~21日、2014年4月28日~5月18日、2016年1月15~30日搭载“东方红2”号科考船对黄海进行综合性大面站调查,采样站位基本涵盖整个黄海125°E以西海域.各航次采样站位如图1所示.
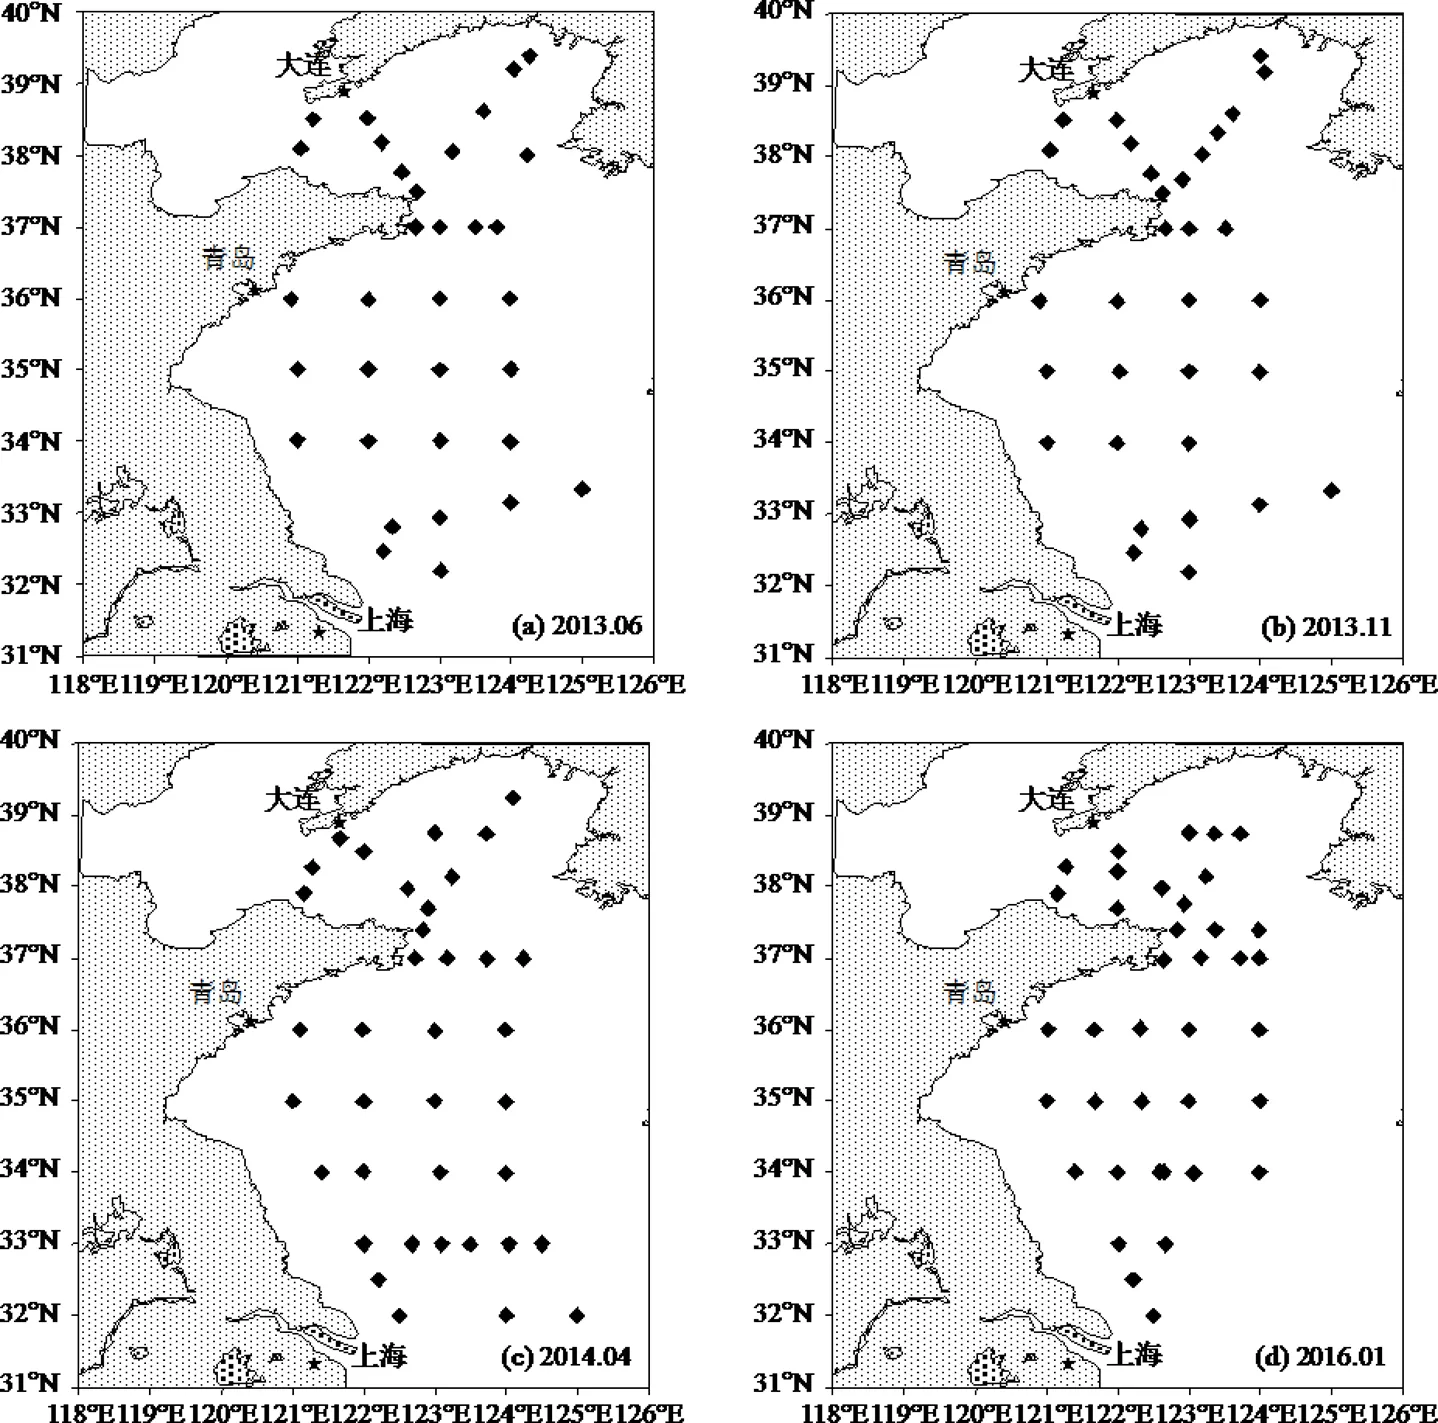
图1 黄海研究区域调查站位
◆为采样站位
1.2 采样及分析方法
现场调查采用直读式温盐深仪(Seabird 911-plus CTD)对温度和盐度进行测定.使用12L Niskin采水器分别采集标准层水样(表层,10m,20m, 30m,中层一般取10m层,底层离海底2m).水样经GF/F滤膜(预先450℃温度下灼烧4h)过滤用聚乙烯瓶贮存,-20℃冷冻保存.使用SEAL-AA3流动分析仪测定,NO3--N,NO2--N,NH4+-N均按照海洋调查规范方法(GB/T 12763.6-2007)[34]测定,其中NO3--N (铜-镉还原)和NO2--N采用重氮-偶氮法,NH4+-N使用靛酚蓝法,检出限分别为0.02,0.02,0.04μmol/L,其测量精度分别是:99.41%、99.05%和99.69%;DIN= NO3--N+NO2--N+NH4+-N.
本文选用文献[35-36]提出的系统聚类法对整个黄海水团进行划分,采用欧氏平方距离——重心法作为划分水团的依据.采用SPSS 18.0软件,对2013~ 2016年4个航次的所有水层(2m/层)CTD实测温盐值进行标准化处理,并根据T-S点聚图结合水团“内同性和外异性”的原则[37],对水团划分的结果进行调整,并将调整后结果与参考文献相对比.
1.2.1 数据标准化处理
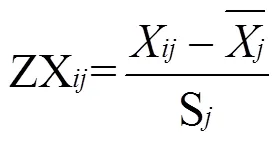

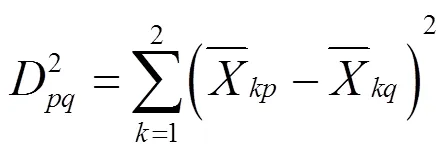
1.2.2 聚类参数和方法 本文以温度和盐度作为参数指标对观测站位的所有水层样品进行聚类分析,以欧几里德平方和距离为计算各样本之间的距离,采用此距离可以使误差缩减到最小.其欧式平方距离(2个指标值)的计算公式如下:

式中:,=1,2,3,…,,≠代表样品数;=1,2,3,…,代表变量个数;ZX为标准化后的数据.
最后,选择计算结果与T-S点聚图最相近的质心法(也叫重心法)作为划分水团的聚类方法.

式中:n=n+n,即类和类合并为类,n为该类的站数.
类与类的类间距离为:
类与类合并后的重心为:

为指标值,温度盐度两个指标值分别为:


在计算中,*为临界值,当<*时继续合并,检验值计算公式:
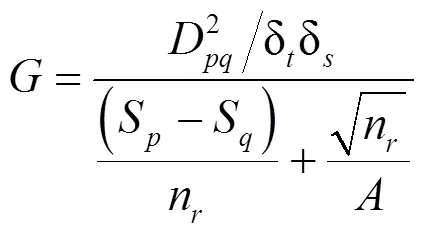
水团体积通过克里格-网格化法,采用Surfer 8.0软件进行计算[38],其中 1 °E=91.1km,1 °N=111.2km.假设各水团在相应季节DIN浓度基本不变,各水团DIN含量计算公式如下:
(t)=摩尔质量(g/mol)×浓度(μmol/L)
×水团体积(km3)(9)
2 结果与讨论
2.1 黄海DIN分布特征及组成
2.1.1 黄海DIN分布特征 春、夏、秋和冬季整个调查海域DIN浓度在0.24~18.01mmol/L之间,平均浓度分别为(5.43±4.02),(4.47±3.16),(7.46±3.56), (5.09± 2.59)μmol/L.从平面分布来看(图2),表、中层海水中DIN的分布在4个航次中均呈现近岸高、外海低的分布趋势,这与文献[2,39-43]结论一致.底层水体DIN分布特征与表层不同,在黄海近岸和中央海区存在2个高值区(>6μmol/L),与王保栋等[3,28,44-46]分析结果一致.表、中层水体DIN高值区分布在黄海近岸,主要集中在长江口以北、苏北沿岸、山东半岛和辽东半岛附近[2,39],结合盐度分布特征可知其主要受陆源输入的影响[31,47-48];其中2014年4月调查海区长江口以北和山东半岛以南海区高值区DIN浓度高于15μmol/L,超过了国家一类海水水质标准(DIN=14.29μmol/L),已成为南黄海近岸水质的污染物之一.春、夏季表中层水体中央海区DIN浓度较低的主要原因是浮游植物生长旺盛消耗所致[16];底层近岸和中央海域两个高值区结合盐度分布特征推测分别受河流输入和黄海暖流及黄海冷水团的影响[3,44-46].
垂直方向上(图2),除冬季外,DIN浓度均表现为底层>表层>中层.冬季调查海区受强烈的垂直混合扰动影响[49],导致浅水区上、下水体中DIN浓度相近.DIN实际水平将取决于DIN的补充与生物活动消耗过程的消长和平衡[50],春季~秋季底层海水中存在一个DIN含量较高的黄海冷水团,为DIN的储库[3];表层海水既有浮游植物的生命活动消耗,又有富含高DIN的冲淡水和大气沉降补充[51],而中层水样处于真光层,该层浮游植物生长繁殖消耗了大量的DIN,加之调查期间温跃层的存在[52],致使底层高浓度的DIN无法上升至表中层水体[2,52],因此该层DIN浓度比表层低.冬季在中央深水区浓度稍高,推测其原因是底层受冬季强风垂直扰动影响较小且有黄海暖流的补充所致[3,44,46].
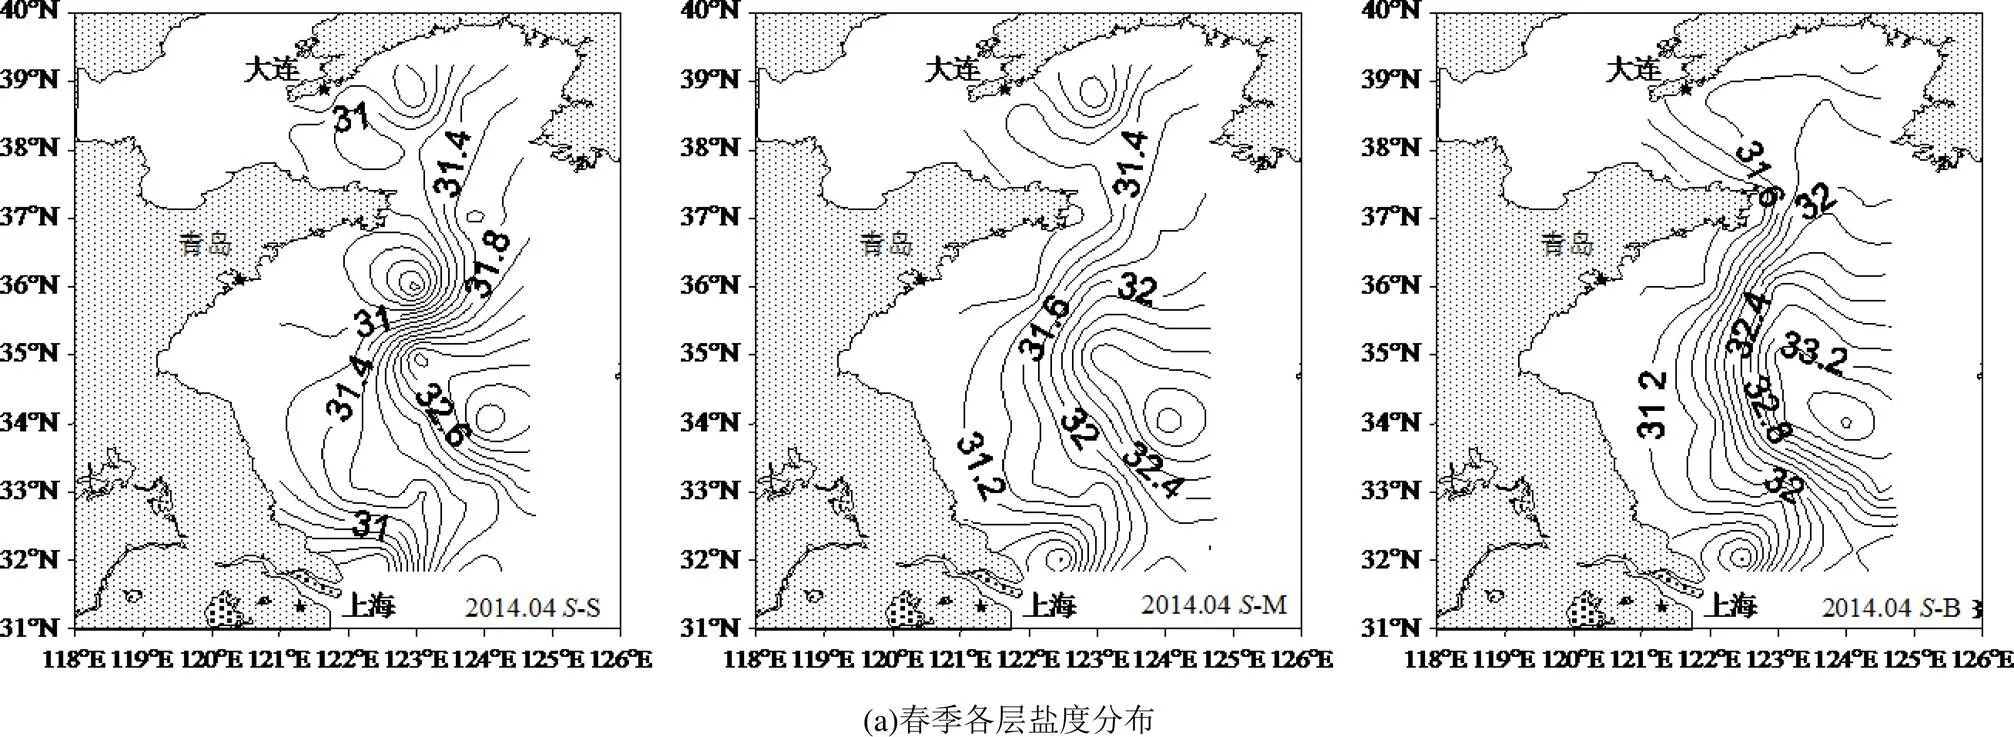
S:表层, M:中层, B:底层
季节变化上(图2),DIN浓度整体表现为秋季最高、夏季最低,秋、冬季高于春、夏季的变化规律,这与蒋昊等[53]研究一致.秋季DIN浓度最高可能是该季浮游植物消耗减少,加之河流输入和水团环流等外源输入的补充作用所致[7];夏季DIN浓度最低可能是浮游植物大量繁殖消耗增加,加之近年来浒苔绿潮频发,且水体层化现象显著[52],水体底层的DIN无法对表层水体进行补充所致[2,52,54].
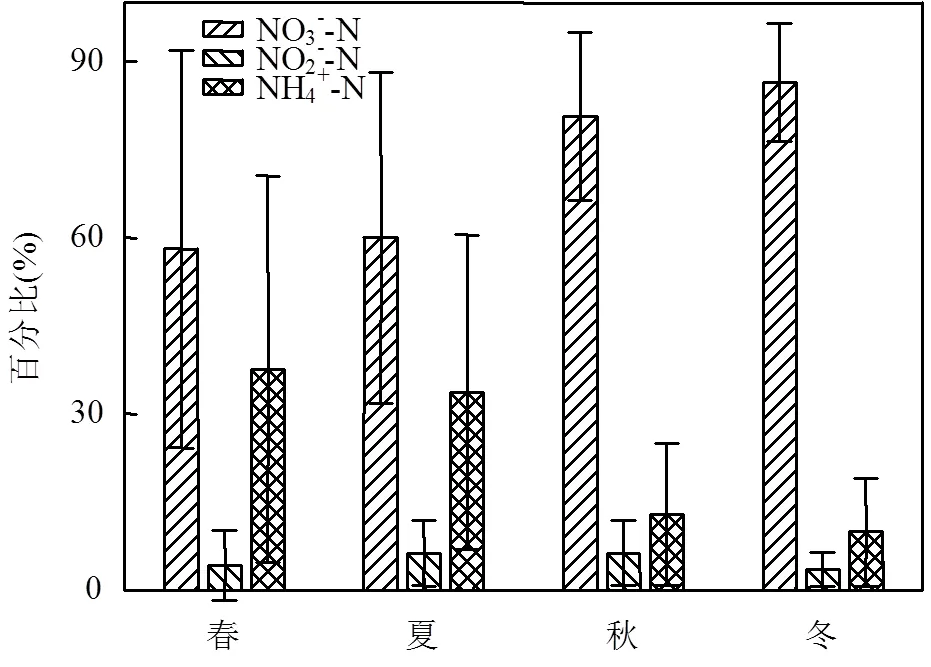
图3 黄海DIN形态组成的季节变化
2.1.2 黄海DIN形态组成 调查海域春、夏、秋和冬季DIN的主要存在形态均为NO3--N,分别占DIN总量的比例为58.10%、60.01%、80.70%和86.47%,其次为NH4+-N分别占37.64%、33.71%、12.96%和9.92%,最少的是NO2--N分别占4.26%、6.28%、6.34%和2.85%(图3).从春季到冬季,NO3--N占DIN的比例逐渐升高;NH4+-N所占比例逐渐降低;NO2--N所占比例相对稳定,均小于7%.有研究表明浒苔在硝酸盐和铵盐同时存在时,会优先吸收NH4+-N[55].NH4+-N可以被海藻直接吸收利用,NH4+- N的吸收效率远远大于NO3--N[56-57],且NH4+-N对NO3--N的吸收有抑制作用[58-61].黄海调查海域NH4+-N在春、夏季所占比例高达37.64%和33.71%,较高比例的NH4+-N可能为黄海浒苔绿潮暴发提供物质保证[58].
2.2 黄海DIN的年际变化
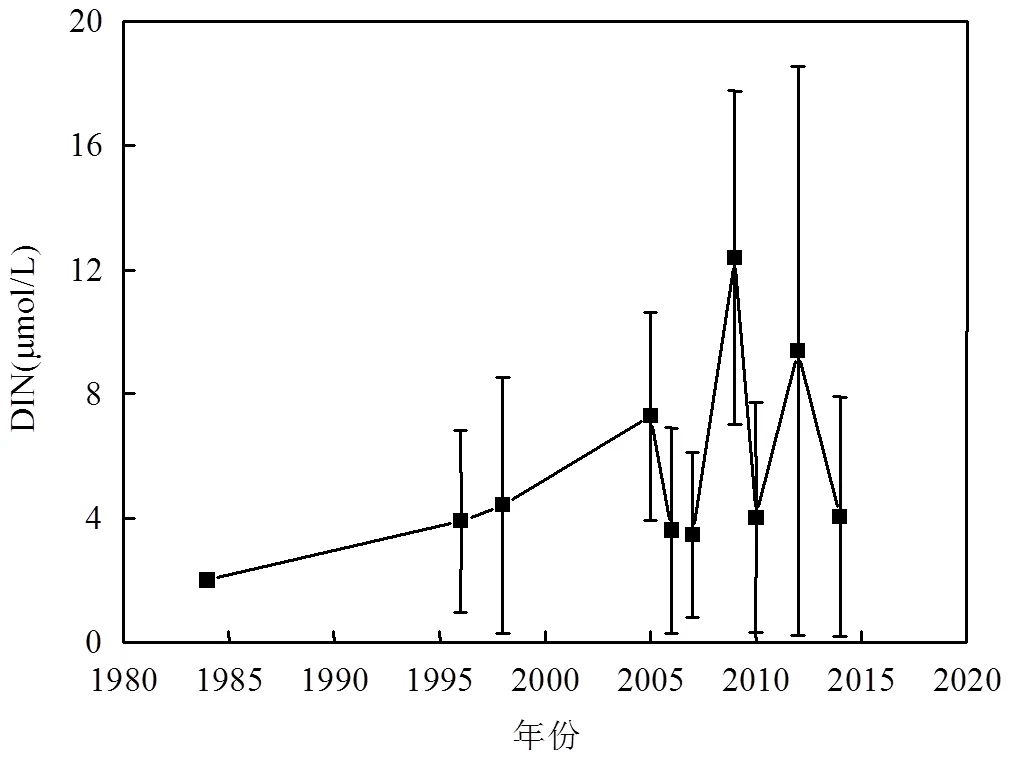
图4 1980~2010年黄海春季表层DIN的年际变化特征
根据历史资料对春季表层海水中DIN的年际变化进行分析[3-4,62-63],近40a春季整个黄海表层水体中DIN浓度呈现波动式的变化特征(图4),在2005年之前,DIN呈现逐渐增长的变化特征,2006~2007年略有下降, 2009年急剧上升达到近40a来最大值12.40μmol/L,2009年以后呈现波动式下降的变化趋势,2010年浓度水平降至1984年浓度水平.实验室培养结果表明,DIN的浓度水平是制约浒苔生长的主要因素[64-65],2009年DIN的峰值恰逢浒苔绿潮在黄海近岸大面积暴发,最大分布面积达58000km2[66],推测DIN输入的逐年增加是导致浒苔绿潮大面积暴发的重要因素,这与Keesing等[19]、Lin等[18]和Li等[25]的研究结果一致.随着国家对海洋环境污染的重视与治理,2009年以后,DIN开始波动式下降,使氮营养盐的输入得以控制.
2.3 水团对DIN含量的贡献分析
通过聚类分析和T-S点聚图(图6)对调查海域四季水团进行划分(图5),黄海主要存在黄海混合水团(Y)、黄海冷水团(YC)、黄海暖流水(YW)、沿岸水团(CW)和黄东海混合水团(YE)5个水团(台湾暖流TW并非黄海特征水团,故本文不作讨论),结果与邱道立等[35]和刘树勋等[67]水团划分较为一致.邱道立等[35]提出除了Y终年存在外,其它均是季节性水团.各水团水文特征如表1所示, Y温度、盐度均存在明显的季节变化,从温盐特性上看,具备中盐的特征[68],温度在6.1~23.3℃之间,盐度在29.91~33.37之间.YC温度盐度特性是低温中盐,温度在3.8~13.2℃之间,盐度在30.75~33.30之间,是温度最低的水团. YW温度盐度特性为中温高盐,温度在8.3~17.2℃之间,盐度在31.72~33.85之间. CW最大的温度盐度特性是低盐,温度在11.0~23.0℃之间,盐度在28.71~ 30.85之间,均<31.YE水文特性是中温中盐,温度在9.0~23.8℃之间,盐度在31.19~33.42之间.

表1 黄海各水团的水文特征
注: /表示该水团在该季节不明显或者影响很小.
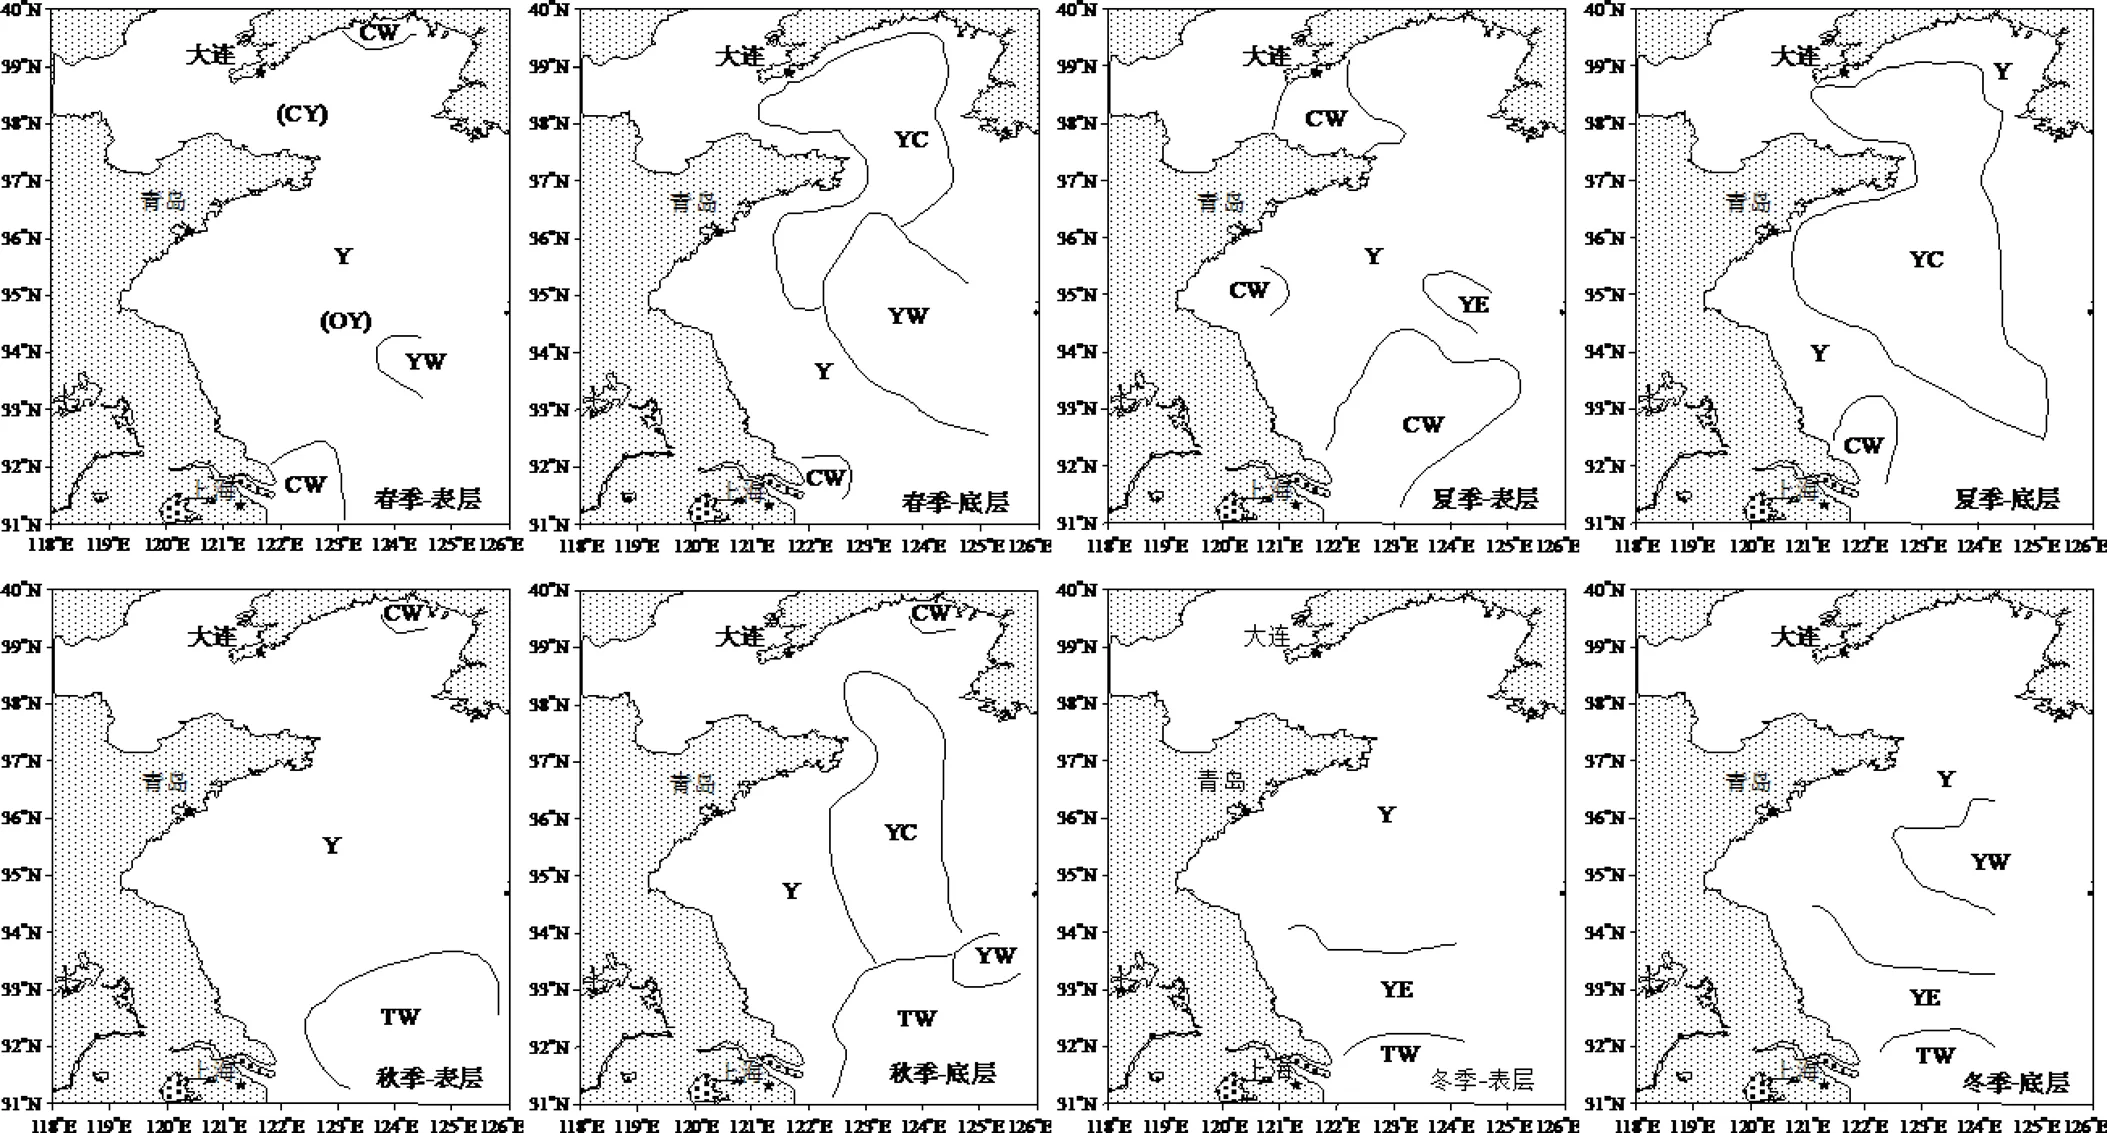
图5 四季黄海表、底层水团分布
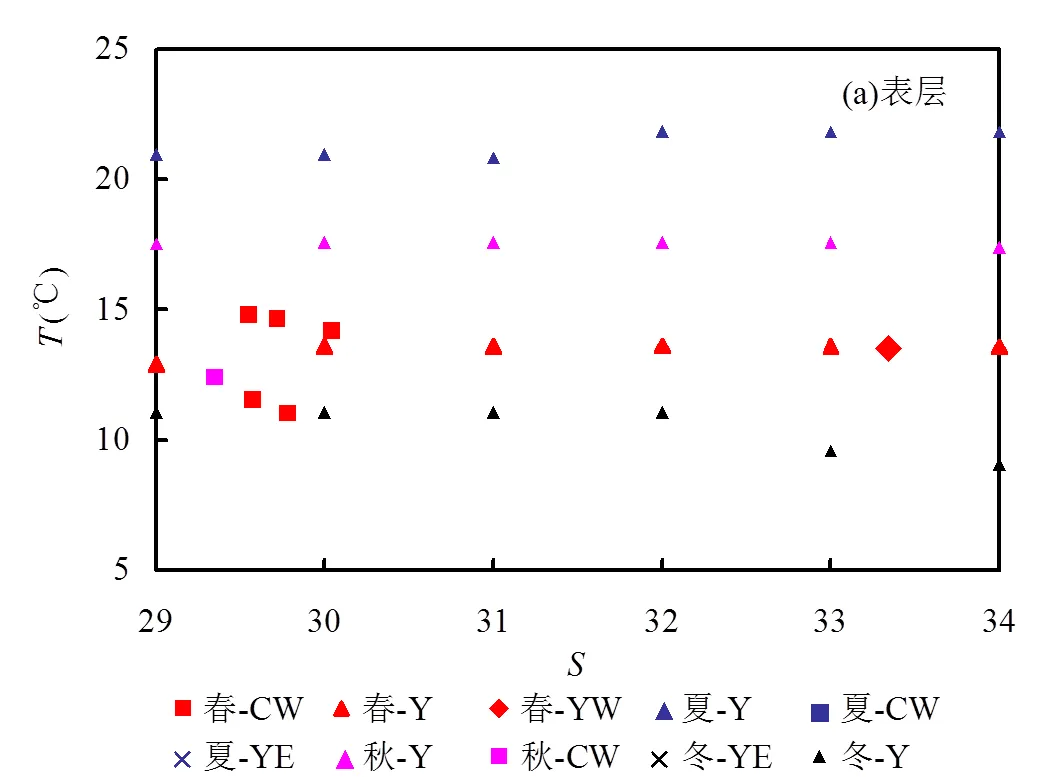
由于4个调查航次站位不完全相同,因此本文只讨论125°E以西调查海域,根据上述已划分的水团,采用Surfer 8.0软件克里格-网格化法对水团体积进行计算,并根据式9分别计算各水团中DIN含量,其结果如表2所示.各季节不同水团对DIN总量的贡献大小如图7所示.
Y由进入黄海的沿岸水和外海水混合而成,常年占据调查海区表、中层绝大部分海域,底层面积较小,多集中于南黄海西侧(图5). Y是四季体积最大且DIN浓度最低的非季节性水团,春、夏、秋和冬季Y水团体积分别约为6.8×103,6.0×103,9.1×103,9.2× 103km3;DIN平均浓度约为(4.36±3.60),(3.17±2.38), (6.84±3.37),(4.71±1.87)μmol/L;对DIN总量的贡献比例分别为33.6%,26.4%,57.7%,78.8%(图7),由此可知,秋、冬季以Y对DIN总量的贡献为主.春季Y多分布于表中层水体;夏季Y的范围缩小至四季最小(图5),春季~夏季DIN浓度随着浮游植物生长繁殖的消耗越来越低[16],且因温跃层的存在,底层水体高浓度DIN无法对表中层水体进行补充[2,52,54],因此Y在春、夏季对DIN总量的贡献较小.而秋季浮游植物活动开始减弱,伴随着降温和大风的垂直扰动影响,Y占据调查海区大部分海域(图5),由于温跃层的逐渐消失和垂直扰动作用的影响,底层高浓度DIN对表层水体进行补充,使得DIN浓度达到全年最高,因此,秋季Y对DIN总量贡献最大.冬季随着垂直混合作用加强和YW、YE北上,Y整体向北扩展,体积增至最大,因而对调查海域该季节DIN总量贡献最大.
YC是黄海最保守的季节性水团,主要盘踞在黄海中央底层水体(图5),其形成与黄海海底地形、温跃层和深度相关[69]. YC在春、夏和秋季体积分别约为3.7×103,9.3×103,2.0×103km3;DIN浓度分别约为(5.52 ± 3.39),(5.57 ± 2.91),(10.50 ± 4.00) μmol/L;对DIN总量的贡献比例分别为23.4%,71.5%,19.6%.因此,夏季以YC对DIN总量的贡献最大,其DIN含量为7.24×105t. YC于春季黄海北部开始形成,前一年冬季冷水有助于春季YC的形成[70],虽然DIN浓度高于Y,但是规模尚小,体积约为Y的1/2,因而贡献也相对Y较小.夏季YC规模最大[2],受南风作用南下[70]延伸至济州岛附近,几乎覆盖整个南北黄海中央底层区域.此时,底层浮游植物残体被分解成DIN重新回到水体中,加之水体的层化作用使得YC中高浓度DIN无法扩散进入上层水体[2,52,54],YC中DIN浓度在该季最高,体积较其他季节也最大,因此,对DIN总量贡献最高,进而YC成为整个黄海DIN的主储备库,这与王保栋等[3]研究结论一致.秋季随着降温和垂直扰动作用的增强,YC向西北方向回缩至黄海中央海域[70],贡献比例与春季接近.冬季随着降温和垂直混合作用的进一步加强,YC消失.
YW是由黄海暖流与黄海水混合而成,受北风作用驱动形成[72-77],多分布于底层水体(图5), YW在秋、冬和春季体积分别约为0.5×103,0.2×103,4.7× 103km3;DIN浓度分别约为(9.98±5.92),(12.19± 1.76), (8.01±3.83) μmol/L;对DIN总量的贡献比例分别为4.3%,3.6%,42.8%.由此可知,春季以YW对DIN总量的贡献最为突出,其DIN含量为5.3×105t,且YW所携带的DIN浓度较高,这与Jin等[44]、Fu等[46]和Guo等[78]研究结论一致.秋季随着降温和季风作用的加强YW携带高浓度DIN从黄海东南端开始入侵,冬季随着季风作用进一步加强,YW进一步向西北方向迅速扩展[73,79-81],延伸至黄海中部海域,强度达到全年最高,虽然DIN浓度较高,体积却较小.因此,秋、冬季YW对DIN总量贡献不大.春季YW继续北上扩张至36.5°N[82-83],影响范围全年最大[84],且在34°N以南123.5°E以东海域表层呈舌状向西北方向扩张,体积达四季最大,加上携带较高浓度DIN,因而对春季DIN总量贡献最大.夏季YW消失.

表2 研究海域不同季节各水团体积、DIN浓度和含量
注:1./代表可以忽略不计.2.*代表冬季补足缺失部分后总量.
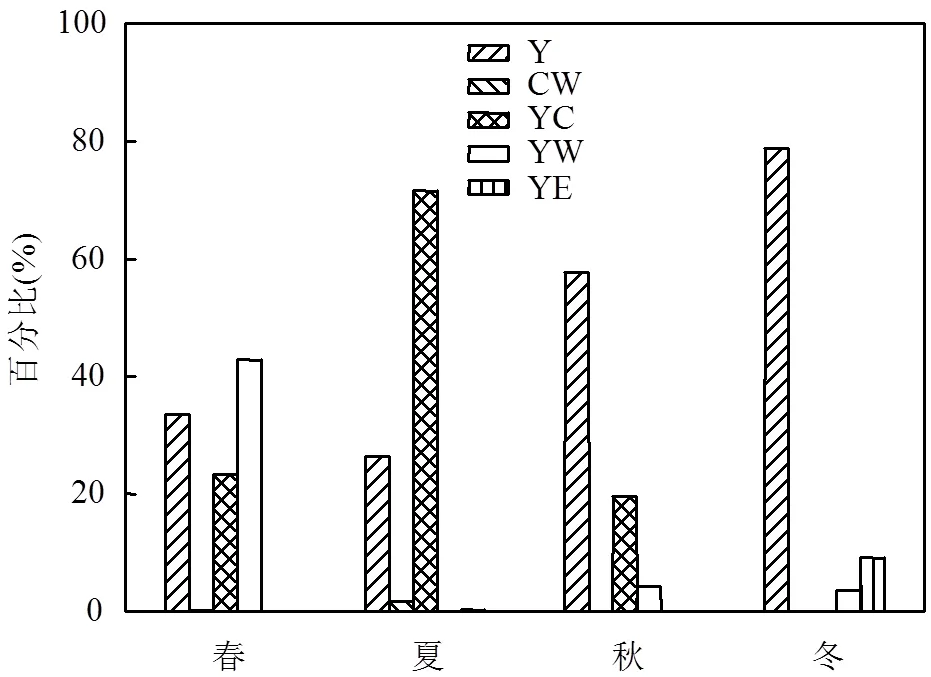
图7 各水团对DIN含量贡献比例的季节变化
CW是由黄海沿岸径流与黄海水混合而成,分布于黄海沿岸区域(图5).因本研究近岸调查站位较少,故根据实际站位进行讨论,本研究CW存在于春、夏季.春季CW分布在长江口以北的表底层和鸭绿江口附近表层海域,夏季随着河流径流量的增大, CW在长江口明显呈舌状向东北方向扩展,在山东半岛和辽东半岛表层水体也开始向外扩展,其分布面积达到最大.秋季随着径流量减少仅分布在鸭绿江口附近,冬季随着河流枯水期的到来,CW消失. CW在春、夏季体积分别约为0.01×103,0.2×103km3; DIN浓度分别约为(14.13±4.70),(5.28±4.26)μmol/L;对DIN总量的贡献比例分别为0.2%,1.8%,贡献较小,几乎可忽略不计.
YE是由东海水北上与黄海水混合而成,主要分布于研究海域南部(图5),存在于夏、冬季, YE在夏、冬季体积分别约为0.3×103,1.0×103km3;DIN浓度分别约为(0.62±0.10),(5.20±2.77)μmol/L;对DIN总量的贡献比例分别为0.3%,9.2%.由此可见,YE对DIN总量的贡献冬季比夏季高.夏季YE分布于34°N以北123.5°E以东小部分海域,水团体积和DIN浓度均较小,其贡献可忽略不计.冬季表层分布于34°N以南海域,底层移至33.5°N以南海域,水团体积和DIN浓度较夏季均增大,因而对DIN总量贡献较夏季大.
综上所述,调查海域春季~冬季黄海各水团DIN总量分别为1.2×106,1.0×106,1.5×106和0.8× 10⁶t.由于各个航次调查海域的区域性差别(冬季航次东至124°E以西,北至39°N;其他季节东至125°E,北约至40°N),为了更好的比较DIN总量的季节变化,本文估算了冬季航次缺失部分的DIN总量,冬季航次水体体积为1.6×10⁴km3,冬季DIN总量为1.3×10⁶t.由此可以看出,夏季DIN总量略低,受浮游植物消耗作用较为明显.从不同季节水团对DIN含量贡献比例来看,春季以YW为主,高达42.8%;夏季以YC为主,高达71.5%;秋冬季以Y为主,贡献比例分别为57.7%和78.8%.
3 结论
3.1 2013~2016年黄海DIN的浓度在0.24~ 18.01μmol/L之间,平均值在4.47~7.46μmol/L之间,春、夏、秋和冬季DIN平均值分别为(5.43±4.02), (4.47±3.16),(7.46±3.56)和(5.09±2.59)μmol/L.DIN浓度平均值季节变化整体表现为秋季最高、夏季最低,秋、冬季高于春、夏季.其平面分布规律基本上呈现近岸高、外海低的分布特征.表层水体DIN浓度高值区主要集中在辽东半岛、山东半岛、苏北沿岸及长江口以北近岸海区,底层水体高值区多集中在中央海域;垂直方向上,除冬季外,黄海DIN浓度均表现为底层>表层>中层.
3.2 DIN的主要形态为NO3--N,春季~冬季, NO3--N所占DIN比例逐渐升高.NH4+-N所占DIN比例逐渐降低,其中春、夏季NH4+-N所占比例是秋、冬季的近3倍.
3.3 调查海域主要分布着5个水团:黄海混合水团、黄海冷水团、黄海暖流、沿岸水和黄东海混合水.其中黄海混合水团终年存在,而黄海冷水团和黄海暖流是典型的季节性水团.
3.4 黄海各水团DIN含量和对DIN总量贡献因季节而异,春、夏、秋和冬季黄海所有水团中DIN总量分别为1.2×106,1.0×106,1.5×106和1.3×10⁶t,夏季总量最低.从水团对DIN总量的贡献分析,春季以黄海暖流为主,夏季以黄海冷水团为主,秋、冬季以黄海混合水团为主.
[1] 米铁柱,姚庆祯,孟 佳,等.2011年春、夏季黄海、东海营养盐分布特征研究[J]. 海洋与湖沼, 2012,43(3):678-688. Mi T Z, Yao Q Z, Meng J, et al. Distributions of nutrients in the Southern Yellow Sea and East China Sea in spring and summer 2011 [J]. Oceanologia et Limnologia Sinica, 2012,43(3):678-688.
[2] Wei Q S, Yu Z G, Wang B D, et al, Coupling of the spatial–temporal distributions of nutrients and physical conditions in the southern Yellow Sea [J]. Journal of Marine Systems, 2016,156:30-45.
[3] 王保栋,王桂云,郑昌洙,等.南黄海营养盐的平面分布及横向输运[J]. 海洋学报, 1999,21(6):124-129. Wang B D, Wang G Y, Zheng C Z, et al. Horizontal distributions and transportation of nutrients in the southern Huanghai Sea [J]. Haiyang Xuebao, 1999,21(6):124-129.
[4] 王保栋.黄海和东海营养盐分布及其对浮游植物的限制[J]. 应用生态学报, 2003,14(7):1122-1126. Wang B D. Nutrient distributions and their limitation on phytoplankton in the Yellow Sea and the East China Sea [J]. Chinese Journal of Applied Ecology, 2003,14(7):1122-1126.
[5] Liu S M, Hong G H, Zhang J, et al. Nutrient budgets for large Chinese estuaries [J]. Biogeosciences, 2009,6(10):2245-2263.
[6] 韦钦胜,于志刚,冉祥滨,等.黄海西部沿岸流系特征分析及其对物质输运的影响[J]. 地球科学进展, 2011,26(2):145-156. Wei Q S, Yu Z G, Ran X B, et al. Characteristics of the Western Coastal Current of the Yellow Sea and its impacts on material transportation [J]. Advances in Earth Science, 2011,26(2):145-156.
[7] 韦钦胜,臧家业,魏修华,等.秋季南黄海西部营养盐的分布及其与环流场的关系[J]. 海洋学报, 2011,33(1):74-82. Wei Q S, Zang J Y, Wei X H, et al. The distribution of nutrients and the relationship of them with the circulation condition in the western southern Huanghai Sea in autumn [J]. Haiyang Xuebao, 2011,33(1): 74-82.
[8] Zheng L W, Zhai W D, Wang L F, et al. Improving the understanding of central Bohai Sea eutrophication based on wintertime dissolved inorganic nutrient budgets: Roles of North Yellow Sea water intrusion and atmospheric nitrogen deposition [J]. Environmental Pollution, 2020,267:115626.
[9] Abal E G, Bunn S E, Dennison W C. Healthy waterways healthy catchments: Making the connection in South East Queensland [M]. Moreton Bay Waterways and Catchments Partnership, Brisbane, Australia, 2005:240.
[10] Wang J J, Yu Z G, Wei Q S, et al. Long-term nutrient variations in the Bohai Sea over the past 40years [J]. Journal of Geophysical Research: Oceans, 2018,124(1):703-722.
[11] Wei Q S, Wang B D, Yao Q Z, et al. Hydro-biogeochemical processes and their implications for Ulva prolifera blooms and expansion in the world's largest green tide occurrence region (Yellow Sea, China) [J]. The Science of the Total Environment, 2018,645(DEC.15):257-266.
[12] Gilbert P M. Eutrophication, harmful algae and biodiversity — Challenging paradigms in a world of complex nutrient changes [J]. Marine Pollution Bulletin, 2017,124(2):591-606.
[13] Ferreira J G, Bricker S B, Simas T C. Application and sensitivity testing of a eutrophication assessment method on coastal systems in the United States and European Union [J]. Journal of Environmental Management, 2007,82(4):433-445.
[14] Jackson C, Preston N, Thompson P J, et al. Nitrogen budget and effluent nitrogen components at an intensive shrimp farm [J]. Aquaculture, 2003,218(1-4):397-411.
[15] Naylor R L, Goldburg R J, Mooney H. Natures subsidies to shrimp and salmon farming [J]. Science, 1998,282:883-884.
[16] 王俊杰,于志刚,韦钦胜,等.2017年春、夏季南黄海西部营养盐的分布特征及其与浒苔暴发的关系[J]. 海洋与湖沼, 2018,49(5):1045- 1053. Wang J J, Yu Z G, Wei Q S, et al. Distributions of nutrients in the Western South Yellow Sea in spring and summer of 2017 and their relationship with Ulva prolifera outbreaks [J]. Oceanologia et Limnologia Sinica, 2018,49(5):1045-1053.
[17] 李绪录,张军晓,史华明,等.深圳湾及邻近沿岸水域总溶解氮的分布、组成和来源及氮形态的转化[J]. 环境科学学报, 2014,34(8): 2027-2034. Li X L, Zhang J X, Shi 11M, et al. Transformation of nitrogenous forms, and composition, sources and distributions of total dissolved nitrogen in the Shenzhen Bay and adjacent coastal waters [J]. Acta Scientiae Circumstantiae, 2014,34(8):2027-2034.
[18] Lin A, Shen S, Wang G, et al. Comparison of chlorophyll and photosynthesis parameters of floating and attached Ulva prolifera [J]. Journal of integrative plant biology, 2011,53(1):25-34.
[19] Keesing J K, Liu D, Fearns P, et al. Inter-and intra-annual patterns of Ulva prolifera green tides in the Yellow Sea during 2007~2009, their origin and relationship to the expansion of coastal seaweed aquaculture in China [J]. Marine Pollution Bulletin, 2011,62(6):1169- 1182.
[20] Li H M, Zhang C S, Han X R, et al. Changes in concentrations of oxygen, issolved nitrogen, phosphate, and silicate in the southern Yellow Sea, 1980~2012: sources and seaward gradients [J]. Estuarine Coastal and Shelf Science, 2015,163(20):44–55.
[21] Perrot T, Rossi N, Ménesguen A, et al. Modelling green macroalgae blooms on the coasts of Brittany, France to enhance water quality management [J]. Journal of Marine Systems, 2014,132(4):38–53.
[22] Liu D Y, Keesing J K, Dong Z, et al. Recurrence of Yellow Sea green tide in June 2009 confirms coastal seaweed aquaculture provides nursery for generation of macroalgae blooms [J]. Marine Pollution Bulletin, 2010,60(9):1423–1432.
[23] Liu D Y, Keesing J K, Xing Q, et al. World’s largest macroalgal bloom caused by expansion of seaweed aquaculture in China [J]. Marine Pollution Bulletin, 2009,58(6):888–895.
[24] Nelson T A, Nelson A V, Tjoelker M. Seasonal and spatial patterns of Green Tides (ulvoid algal blooms) and related water quality parameters in the coastal waters of Washington State, USA [J]. Botanica Marina, 2003,46(3):263-275.
[25] Li H M, Zhang Y Y, Chen J, et al. Nitrogen uptake and assimilation preferences of the main green tide alga Ulva prolifera in the Yellow Sea, China [J]. Journal of Applied Phycology, 2019,31(1):625-635.
[26] 吴老五,韩秀荣,吴 婷,等.重金属对浒苔吸收硝酸盐的动力学特性影响 [J]. 中国环境科学, 2016,36(4):1173-1180. Wu L W, Han X R, Wu T, et al. Effects of heavy metals on the uptake of nitrate by Ulva prolifera. [J]. China Environmental Science, 2016, 36(4):1173-1180.
[27] 张海波,王 爽,尹 航,等.2018年南黄海浒苔绿潮发展规律及氮组分的作用探究 [J]. 海洋学报, 2020,42(8):40-49. Zhang H B, Wang S, Yin H, et al. The development of Ulva prolifera green tide and the roles of nitrogen nutrients in it in the southern Yellow Sea in 2018 [J]. Haiyang Xuebao, 2020,42(8):40-49.
[28] Shi X Y, Qi M Y, Tang H J, et al. Spatial and temporal nutrient variations in the Yellow Sea and their effects on Ulva prolifera blooms [J]. Estuarine, Coastal and Shelf Science, 2015,163:36-43.
[29] Morand P, Merceron M. Coastal eutrophication and excessive growth of macroalgae [J]. Recent Research Developments in Environmental Biology, 2004,1:395-449.
[30] Teichberg M, Fox S E, Olsen Y S, et al. Eutrophication and macroalgae blooms in temperate and tropical coastal waters: nutrient enrichment experiments with Ulva spp [J]. Global Change Biology, 2010,16:2624-2637.
[31] Liu D Y, Keesing J K, He P M, et al. The world's largest macroalgae bloom in the Yellow Sea, China: formation and implications. Estuarine [J]. Coastal and Shelf Science, 2013,129:2-10.
[32] Chen L, Li C, Zhou K, Shi Y, et al. Effects of nutrient limitations on three species of zooplankton [J]. Haiyang Xuebao, 2018,37:58–68.
[33] Li H M, Zhang Y Y, Tang H J, et al. Spatiotemporal variations of inorganic nutrients along the Jiangsu coast, China, and the occurrence of macroalgal blooms (green tides) in the southern Yellow Sea [J]. Harmful Algae, 2017,63:164-172.
[34] GB/T. 12763.3-2007 海洋调查规范[S]. GB/T. 12763.3-2007 Specification of oceanographic investigation [S].
[35] 邱道立,周诗赉,李昌明.应用聚类分析法划分黄海水团的初步研究[J]. 海洋学报(中文版), 1984,(3):281-292. Qiu D L, Zhou S L, Li C M. Application of cluster analysis method in determining water mass of the Huanghai Sea [J]. Haiyang Xuebao, 1984,(3):281-292.
[36] 李凤岐,苏育嵩,喻祖祥.聚类分析在浅海变性水团分析中的试验[J]. 海洋学报, 1983,(6):675-686. Li F Q, Su Y S, Yu Z X. Application of cluster analysis method to modified water masses in the shallow sea [J]. Haiyang Xuebao, 1983,(6):675-686.
[37] 李凤岐,苏育嵩,王凤钦,等.用模糊集合观点讨论水团的有关概念[J]. 海洋与湖沼, 1986,17(2):102-110.Li F Q, Su Y S, Wang F Q, et al. Discussion of some concepts of the water mass by the theory of fuzzy sets [J]. Oceanologia et Limnologia Sinica, 1986,17(2):102-110.
[38] 臧 璐.北黄海生源要素的季节特征及冷水团对其影响的研究[D]. 山东:中国海洋大学, 2009. Zang L. The Research of biogenic elements' seasonal characteristics in the North Yellow Sea and the contribution of the North Yellow Sea Cold water mass [D]. Shandong: Ocean University of China, 2009.
[39] Wang J J, Yu Z G, Wei Q S, et al. Intra- and inter-seasonal variations in the hydrological characteristics and nutrient conditions in the southwestern Yellow Sea during spring to summer [J]. Marine Pollution Bulletin, 2020,156(111139):1-15.
[40] 赵晨英,臧家业,刘 军,等.黄渤海氮磷营养盐的分布,收支与生态环境效应[J]. 中国环境科学, 2016,36(7):2115-2127. Zhao C Y, Zang J Y, Liu J, et al. Distribution and budget of nitrogen and phosphorus and their influence on the ecosystem in the Bohai Sea and Yellow Sea [J]. China Environmental Science, 2016,36(7):2115- 2127.
[41] 王丽莎,张传松,王 颢,等.夏季黄渤海生源要素的平面分布特征[J]. 海洋环境科学, 2015,34(3):361-366,383. Wang L S, Zhang C S, Wang H, et al. Horizontal distribution features of biogenic elements in Bohai Sea and the Yellow Sea in summer [J]. Marine Environmental Science, 2015,34(3):361-366,383.
[42] 殷京玉,金春洁,石晓勇,等.2013年夏秋季黄海溶解无机氮的分布及季节变化特征[J]. 海洋通报, 2017,36(1):74-81. Yin J Y, Jin C J, Shi X Y, et al. Distribution and seasonal variation in dissolved inorganic nitrogen of the Yellow Sea in summer and autumn of 2013 [J]. Marine Science Bulletin, 2017,36(1):74-81.
[43] 唐 永,孙语嫣,石晓勇,等.黄渤海海域秋季营养盐及有色溶解有机物分布特征[J]. 环境科学, 2017,38(11):4501-4512. Tang Y, Sun Y Y, Shi X Y, et al. Distribution Characteristics of Chromophoric Dissolved Organic Matter and Nutrients from the Yellow Sea and Bohai Sea in Autumn [J]. Environmental Science, 2017,38(11):4501-4512.
[44] Jin J, Liu S M, Ren J L, et al. Nutrient dynamics and coupling with phytoplankton species composition during the spring blooms in the Yellow Sea [J]. Deep Sea Research Part II: Topical Studies in Oceanography, 2013,97:16-32.
[45] 王 婷,石晓勇,张传松,等.2008年黄海浒苔绿潮爆发区营养盐浓度变化及分布特征 [J]. 海洋通报, 2011,30(5):578-582. Wang T, Shi X Y, Zhang C S, et al. Variations in nutrient concentration and distribution for green tide of Enteromorpha prolifera occurrence areas of the Yellow Sea in 2008 [J]. Marine Science Bulletin, 2011, 30(5):578-582.
[46] Fu M, Wang Z, Li Y, et al. Phytoplankton biomass size structure and its regulation in the Southern Yellow Sea (China): Seasonal variability [J]. Continental Shelf Research, 2009,29(18):2178-2194.
[47] Wang B D, Wang X L, Zhan R. Nutrient conditions in the Yellow Sea and the East China Sea [J]. Estuarine Coastal and Shelf Science, 2003,58(1):127-136.
[48] Li H M, Tang H J, Shi X Y, et al. Increased nutrient loads from the Changjiang (Yangtze) River have led to increased Harmful Algal Blooms [J]. Harmful Algae, 2014,39:92-101.
[49] 江蓓洁,鲍献文,吴德星,等.北黄海冷水团温、盐多年变化特征及影响因素[J]. 海洋学报, 2007,29(4):1-10. Jiang B J, Bao X W, Wu D X, et al. Interannual variation of temperature and salinity of northern Huanghai Sea Cold Water Mass and its probable cause [J]. Haiyang Xuebao, 2007,29(4):1-10.
[50] 张传松.长江口及邻近海域赤潮生消过程特征及其营养盐效应分析[D]. 山东:中国海洋大学, 2008. Zhang C S. The Characteristic and Effects of Nutrient during the Process of HAB in Changjiang River Estuary and its Adjacent Area [D]. Shandong: Ocean University of China, 2008.
[51] Zhang H B, Su R G, Shi X Y, et al. Role of nutrients in the development of floating green tides in the Southern Yellow Sea, China, in 2017 [J]. Marine Pollution Bulletin, 2020,156:111197.
[52] Yang F X, Wei Q S, Chen H T, et al. Long-term variations and influence factors of nutrients in the western North Yellow Sea, China [J]. Marine Pollution Bulletin, 2018,135:1026-1034.
[53] 蒋 昊,赵 亮,张 晶.黄海溶解无机氮及颗粒有机氮收支与转化模型 [J]. 中国环境科学, 2020,40(9):3981-3991. Jiang H, Zhao L, Zhang J. Budgets and transformation of dissolved inorganic and particulate organic nitrogen in the Yellow Sea: A model study [J]. China Environmental Science, 2020,40(9):3981-3991.
[54] 韦钦胜,刘 璐,战 闰,等.夏季南黄海海水化学要素的分布特征及影响因素[J]. 中国海洋大学学报(自然科学版), 2010,40(1):82-88. Wei Q S, Liu L, Zhan R, et al. Distribution Features of the Chemical Parameters in the Southern Yellow Sea in Summer [J]. Journal of Ocean University of China, 2010,40(1):82-88.
[55] Flynn K J. Algal carbon-nitrogen metabolism: a biochemical basis for modelling the interactions between nitrate and ammonium uptake [J]. Journal of Plankton Research, 1991,(2):373-387.
[56] Hanisak M D. The Nitrogen Relationships of Marine Macroalgae [J]. Nitrogen in the Marine Environment, 1983:699-730.
[57] Maestrini S Y, Robert J M, Leftley J W, et al. Ammonium thresholds for simultaneous uptake of ammonium and nitrate by oyster-pond algae [J]. Journal of Experimental Marine Biology & Ecology, 1986, 102(1):75-98.
[58] 田千桃,霍元子,王阳阳,等.浒苔对NH4+-N与NO3--N吸收的相互作用[J]. 海洋科学, 2010,(7):41-45. Tian Q T, Huo Y Z, Wang Y Y, et al. The interaction between NH4+-N and NO3--N in nitrogen uptaking by Ulva prolifera [J]. Marine Sciences, 2010,(7):41-45.
[59] 何 洁,刘 瑀,张立勇,等.三种大型海藻吸收营养盐的动力学研究[J]. 渔业现代化, 2010,37(1):1-5. He J, Liu Y, Zhang L Y, et al. Study on the nutrient uptake kinetics of three kinds of macro_alga [J]. Fishery Modernization, 2010,37(1):1-5.
[60] 吴 婷,田小亭,刘召辉,等.浒苔对不同氮源吸收特性的初步研究[J]. 海洋科学, 2011,35(4):51-54. Wu T, Tian X T, Liu Z H, et al. Absorption of different nitrogen species by[J]. Marine Sciences, 2011,35(4): 51-54.
[61] 李俭平.浒苔对氮营养盐的响应及其氮营养盐吸收动力学和生理生态研究[D]. 北京:中国科学院研究生院(海洋研究所), 2011. Li J P. The response to nitrogen nutrient, and the uptake kinetics mechanism of nitrogen and ecophysiaiagical analysis of[D]. Beijing: University of Chinese Academy of Sciences, 2011.
[62] 海洋化学图集编委会.渤海黄海东海海洋图集--化学卷[M].北京:海洋出版社, 1991:99-103. Editorial board for the atlas of marine chemistry. Marine atlas of Bohai Sea Yellow Sea East Sea—Chemistry [M]. Beijing: China Ocean Press, 1991:99-103.
[63] 高生泉,林以安,金明明,等.春、秋季东、黄海营养盐的分布变化特征及营养结构[J]. 东海海洋, 2004,22(4):38-50. Gao S Q, Lin Y A, Jin M M, et al. Distribution features of nutrients and nutrient structure in the East China Sea and the Yellow Sea in spring and autumn [J]. Donghai Marine Science, 2004,22(4):38-50.
[64] 李瑞香,吴晓文,韦钦胜,等.不同营养盐条件下浒苔的生长[J]. 海洋科学进展, 2009,(2):211-216. Li R X, Wu X W, Wei Q S, et al. Growth ofunder different nutrient conditions [J]. Advances in Marine Science, 2009,(2):211-216.
[65] 李俭平,赵卫红,付 敏,等.氮磷营养盐对浒苔生长影响的初步探讨[J]. 海洋科学, 2010,34(4):45-48. Li J P, Zhao W H, Fu M, et al. Preliminary study on the effects of nitrogen and phosphorus on the growth of[J]. Marine Sciences, 2010,34(4):45-48.
[66] 国家海洋局.2009年中国海洋灾害公报[J]. 海洋开发与管理, 2010,(2):70. State Oceanic Administration (SOA). 2009 China marine disaster bulletin [J]. Ocean Development and Management, 2010,(2):70.
[67] 刘树勋,沈新强,王幼琴,等.渤、黄、东海水团多年月平均分布与变化的初步分析[J]. 海洋学报(中文版), 1993,15(4):1-11. Liu S X, Shen X Q, Wang Y Q, et al. Preliminary analysis on the monthly mean distribution and variation of water masses in the Bohai Sea, Yellow Sea and East China Sea over the years [J]. Haiyang Xuebao, 1993,15(4):1-11.
[68] 张启龙,翁学传,杨玉玲.南黄海春季水团分析[J]. 海洋与湖沼, 1996,(4):421-428. Zhang Q L, Weng X C, Yang Y L. Analysis of water masses in the South Yellow Sea in spring [J]. Oceanologia et Limnologia Sinica, 1996,(4):421-428.
[69] Nakao T. Oceanic Variability in Relation to Fisheries in the East China Sea and the Yellow Sea [J]. Journal of the Faculty of Marine Science and Technology, 1977,1:199-367.
[70] Zhong Y, Qiao L, Song D, et al. Impact of cold water mass on suspended sediment transport in the South Yellow Sea [J]. Marine Geology, 2020,106244:1-20.
[71] Wang B, Hirose N, Kang B, et al. Seasonal migration of the Yellow Sea Bottom Cold Water [J]. Journal of Geophysical Research: Oceans, 2014,119(7):4430-4443.
[72] Yuan D L, Hsueh Y. Dynamics of the cross-shelf circulation in the Yellow and East China Seas in winter [J]. Deep-Sea Research Part II: Topical Studies in Oceanography, 2010,57(19/20):1745-1761.
[73] Tak Y J, Cho Y K, Seo G H, et al. Evolution of wind‐driven flows in the Yellow Sea during winter [J]. Journal of Geophysical Research Oceans, 2016,121(3):1970-1983.
[74] Teague, G. A. Jacobs. Current observations on the development of the Yellow Sea Warm Current [J]. Journal of Geophysical Research: Oceans, 2000,105:3401-3411.
[75] Hsueh Y, Pang I C. Coastally Trapped Long Waves in the Yellow Sea [J]. Journal of Physical Oceanography, 1989,19(5):612-625.
[76] Hsueh Y. Recent current observations in the eastern Yellow Sea [J]. Journal of Geophysical Research: Oceans, 1988,93(C6):6875-6884.
[77] Park Y H. A simple theoretical model for the upwind flow in the southern Yellow Sea [J]. Oceanological Society Korea, 1986,21:203– 210.
[78] Guo C C, Zhang G C, Sun J, et al. Seasonal responses of nutrient to hydrology and biology in the southern Yellow Sea [J]. Continental Shelf Research, 2020,206:104207.
[79] Wang F, Liu C Y, Meng Q J. Effect of the Yellow Sea warm current fronts on the westward shift of the Yellow Sea warm tongue in winter [J]. Continental Shelf Research, 2012,45:98-107.
[80] Mei X, Li R H, Zhang X H, et al. Evolution of the Yellow Sea Warm Current and the Yellow Sea Cold Water Mass since the Middle Pleistocene [J]. Palaeogeography Palaeoclimatology Palaeoecology, 2016,442:48-60.
[81] Ding Y, Bao X W, Yao Z G, et al. Effect of coastal-trapped waves on the synoptic variations of the Yellow Sea Warm Current during winter [J]. Continental Shelf Research, 2018,167:14-31.
[82] 邹娥梅,郭炳火,汤毓祥,等.1996年春季南黄海水文特征和水团分析[J]. 海洋学报(中文版), 2000,(1):17-26. Zou E M, Guo B H, Tang Y X, et al. The hydrographic features and water masses analyses of the southern Huanghai Sea in the spring of 1996 [J]. Haiyang Xuebao, 2000,(1):17-26.
[83] 于 非,张志欣,刁新源,等.黄海冷水团演变过程及其与邻近水团关系的分析[J]. 海洋学报(中文版), 2006,(5):26-34. Yu F, Zhang Z X, Diao X Y, et al. Analysis of evolution of the Huanghai Sea Cold Water Mass and its relationship with adjacent water masses [J]. Haiyang Xuebao, 2006,(5):26-34.
[84] 王辉武.黄海暖流季节和年际变化研究[D]. 山东:国家海洋局第一海洋研究所, 2008. Wang H W. Study on Seasonal and inter-annual variations of the Yellow Sea Warm Current [D]. Shandong: First Institute of Oceanography, State Oceanic Administration, 2008
Spatial-temporal variation of dissolved inorganic nitrogen (DIN) and impacts of water mass on the reserves estimation of the total DIN content in the Yellow Sea.
JIN Chun-jie1,2, ZHANG Chuan-song1,2, WANG Li-sha1,2*, SHI Xiao-yong1,2,3, HAN Xiu-rong1,2, TANG Hong-jie1,2
(1.College of Chemistry and Chemical Engineering, Ocean University of China, Qingdao 266100, China;2.Key Laboratory of Marine Chemistry Theory and Technology,Ministry of Education, Ocean University of China, Qingdao 266100, China;3.National Marine Hazard Mitigation Service, Beijing 100194, China)., 2021,41(4):1642~1654
Based on the data of 4 curies in 2013~2016, the distribution of DIN in the Yellow Sea、nitrogen pool and its influencing factors have been studied. Results showed that the average concentrations of DIN in the Yellow Sea were (5.43±4.02) μmol/L in spring, (4.47±3.16) μmol/L in summer, (7.46±3.56) μmol/L in autumn, and (5.09±2.59) μmol/L in winter, among which DIN contents reached maximum in autumn and minimum in summer, respectively. DIN concentrations declined from coastal zones to the offshore area. The DIN-rich sites near the coast were mostly centralized in the north of the Yangtze River estuary, Shandong Peninsula and Liaodong Peninsula. The main affecting factors all the year except winter were terrigenous input and the growth of phytoplankton, as the resuspension of the riverine input and sediment were the main factors affecting the distribution of DIN in winter. There was an area with high concentration of DIN(>6μmol/L) in the central area, which was co-influenced by the Yellow Sea warm current and the Yellow Sea Cold Water Mass. Cluster analysis has been used to classified the Yellow Sea water into 5 water masses, including the Yellow Sea water masses (Y), Yellow Sea cold water mass (YC), Yellow Sea warm current water (YW), Coastal water mass (CW) and Yellow Sea-East China Sea mixed water mass (YE), which was the main water mass in the researching sea area. All these water masses except for Y were seasonal. The total DIN content in the research field showed no obvious difference in all year, and their range was 1.0×10⁶~1.5×10⁶t. The DIN content was slightly lower in spring and summer under the influence of phytoplankton assimilation. The total DIN contents were about 1.2×10⁶t in spring, 1.0×10⁶t in summer, 1.5×10⁶t in autumn, and 1.3×10⁶t in winter, respectively. The contributions of water masses to the total DIN content were different in the varying season. In autumn and winter, Y was dominant, while in summer and spring, YW and YC played the dominant roles, respectively.
DIN;Yellow Sea;season;distribution;total content
X55
A
1000-6923(2021)04-1642-13
金春洁(1988-),女,山东青岛人,中国海洋大学博士研究生,主要从事海洋污染生态化学研究.发表论文2篇.
2020-08-04
国家重点研发计划项目(2016YFC1402101)
* 责任作者, 高级实验师, lishawang@ouc.edu.cn
