Study on Marker-assisted Breeding of Soybean Vitamin E
2021-04-30ZhangSiwenSunYananLiHaiyanandLiuXiaojie
Zhang Si-wen, Sun Ya-nan, Li Hai-yan, and Liu Xiao-jie
1 Key Laboratory of Soybean Biology in Chinese Ministry of Education, Northeast Agricultural University, Harbin 150030, China 2 Heilongjiang Green Food Science Research Institute, Harbin 150028, China
Abstract: Hefeng 25 variety with low vitamin E content in Heilongjiang Province and Bayfield variety with high vitamin E content in Canada were crossed. A total of 144 F2 : 7 recombinant inbred lines (RILs) were used as materials. The genetic linkage mapping of soybean vitamin E was constructed. Soybean varieties were marker-assisted selected in the interval of refined quantitative trait locus (QTLs). QTLs were identified in α-, γ-, δ- and the total tocopherol contents of soybean seeds. Fine QTLs of soybean vitamin E content were identified in the interval between Sat_239 and Satt022 on N linkage group. It was valuable to narrow the interval by marker-assisted selection (MAS). There were seven major QTLs of vitamin E content in soybean. MAS related to vitamin E content in soybean was carried out in the intervals between Sat_239 and Satt022. Considering all the kinds of agronomic traits, six strains with high yield and good quality of vitamin E were chosen, numbered 4, 54, 104, 114, 122 and 135.
Key words: soybean, vitamin E, quantitative trait locus (QTL), marker-assisted selection (MAS)
Introduction
Vitamin E (tocopherol) is an effective antioxidant. It's a necessary fat-soluble vitamin for the human body and has important physiological functions. Plants are the primary source of dietary vitamin E, producing the tocopherol and tocotrienol derivatives that collectively constitute vitamin E (Jianget al., 2017). Tocopherol and tocotrienol forms (α-,β-,γ- andδ-) differ by the number and position of methyl substituents on the chromanol ring (Laurentet al., 2017). Usually,α-tocopherol is the predominant form found in leaves and accounts for more than 90% of the foliar content of vitamin E, whereasγ-tocopherol is more abundant in seeds.β- andδ- tocopherols are scarce forms in most plant species (Espinozaet al., 2013), whileγ- tocopherol and tocotrienols accumulate to higher levels in seed of many plant species (Tan, 1989; Demurinet al., 2010).
The most active form of vitamin E isα- tocopherol and thus most of vitamin E is obtained from our diet (Dellapenna and Last, 2006; Fritscheet al., 2017).However, soybean seed generally contains relatively high content ofγ-tocopherol (60%-65% of the total)andδ-tocopherol (20%-26%) which have lower vitamin E activity, but very low content ofα-tocopherol (7%-10%) which has higher vitamin E activity (Shintani and Dellapenna, 1998; Grusak and Dellapenna, 1999; Chenet al., 2012). Vitamin E is important for human health, and dietary or supplemental vitamin E is absorbed and delivered to the liver (Traber, 2007). It is generally found in high concentrations in vegetable oils such as soybean, safflower or canola oil (Dellapenna, 2005). Natural tocopherol comes from green plants. It is valuable to increase vitamin E content in oil crops, such as soybean.
The soybean varieties with high vitamin E contents were selected by molecular makers. The target genes are in close linkage with the molecular markers. High density soybean molecular genetic map was constructed and QTLs related to vitamin E contents were located by genotyping of molecular markers.
Fine genetic linkage map was established using non-functional markers by a cross between Bayfield and Hefeng25. QTLs associated with high vitamin E contents were discovered. Soybean strains with high vitamin E contents were selected in the range of fine positioning by molecular assisted selection. It was used to guide the breeding of new soybean lines with high vitamin E contents.
Materials and Methods
Plant materials and culture condition
Hefeng 25 which had good comprehensive characters and high combining ability was used as the mother. Canadian variety Bayfield which had higherα-tocopherol content was used as father. A total of 144 RILs derived from F2:7after hybridization were planted in Harbin City.
SSR analysis and molecular genetic map construction
The total DNA of the parents and each RIL line was isolated from dried leaf tissues by CTAB method (Doyle, 1990). A total of 800 simple sequence repeat (SSR) markers covered the entire genome of soybean (https://soybase.org/) were used to detect polymorphisms. PCR consisted of 95℃ for 5 min, followed by 35 cycles of 30 s at 94℃, 30 s at 47℃ and 30 s at 72℃ and 5 min at 72℃ after the last cycle. The result was amplified by PCR. Products were mixed with loading buffer and then kept on ice for 5 min. PCR products were separated on 6% (w/v) denaturing polyacrylamide gels and visualized by silver staining (Trigizano and Caetano, 1998). The genetic map including 107 SSR markers was constructed (Liet al., 2010) and the markers were mapped onto 20 LGs according to Creganet al. (1999) and Songet al(2004).
The populations were tested using primers which performance differently between the parents. The chromosomes belonging to SSR markers with difference were determined and molecular markers were anchored on the chromosome by querying the linkage map of common soybean heredity. The linkage map of molecular markers was constructed by mapmaker/EXP3.0b. The genetic graph distance (cM) was converted by recombination rate by Kosambi function. Soybean linkage was drawn by MapChart 2.1.
Fine positioning of soybean vitamin E
Hefeng25×Bayfield and its populations were located in different environments by Bio-Mercator (v2.1). QTL of vitamin E content which had high genetic contribution rate was built by Cregon. They were integrated into consistency QTL. SSR sequence tags which were based on consistent QTL and the latest soybean genome sequence Glyma1.0 were blasted in phytozome (https://phyto-zome.jgi.doe.gov/pz/portal.html) and the corresponding DNA sequence was found. SSR structure contained in the sequence was analyzed by ssr.pl (http://www.gramene.org). The primers were designed, according to these SSRs and fine positioning was determined by these primers according to the above method.
Results
Screening of SSR primers for RILs populations
Analysis the public genetic linkage map of soybean, 800 pairs of SSR primers were tested on both Hefeng 25 and Bayfield in the study. A total of 157 primers showed good polymorphism with 19.63%(Fig. 1). These markers were used to amplify the 142 RILs populations with clear performance.
Analysis on PCR product of SSR
A total of 157 pairs of polymorphic primers were amplified in the F2:7RILs populations. The products were detected by electrophoresis with rapid silver dyeing (Fig. 2). The bands were recorded by statistics and sliver dyed.

Fig. 1 Screening SSR primers with polymorphism between parents

Fig. 2 Sat_246 amplification in some plants of F2:7 populations
Construction and analysis of SSR genetic map of soybean
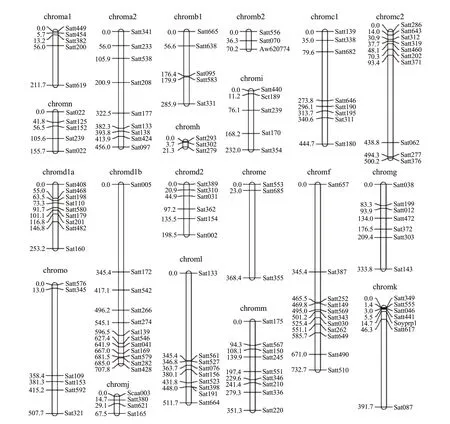
The distribution of SSR primers of soybean linkage group is shown in Table 1. A total of 157 SSR primers were assigned to 20 chromosomes defined by Songet al(2004). The total length of SSR markers was approximately 6 800.8 cM. Almost the entire chromosome group was covered including 136 SSRs (Fig. 3). The average distance was 50.01 cM between molecular markers. The number of markers was 3 to 12 on each linkage group and the length was from 21.3 cM to 73.7 cM. The largest average distance was E of 122.8 cM in all the linkage groups. The smallest linkage group was H of 7.10 cM. SSR markers were more evenly distributed and most of them were distributed on three linkage groups of C2, D1b and F. Each linkage group possessed more than 10 SSR markers. There were 33 SSR molecular markers on three chromosomes, accounting for 21.02% of the total number of markers.
Analysis on fine positioning of soybean vitamin E
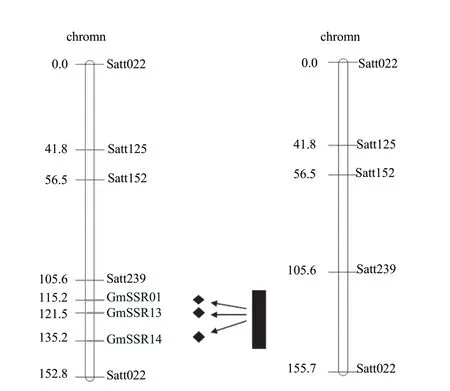
SSR markers were located on the N linkage group and these QTLs were built to the common map by Cregon. The consistent QTL was integrated through meta-analysis (Fig. 4). SSR markers of Sat_239 from Satt022 located on N linkage group were analyzed according to the soybean genome sequences.
There were 16 newly developed SSR markers. And three markers (GMSSR01, GMSSR13 and GMSSR14) were chosen among all the markers in parents. They were validated in the group and the polymorphism were good (Fig. 5). These markers were inserted between Sat_239 and Sat022 by mapmaker software as shown in Fig. 6. QTLs were repositioned using reconstructed linkage map and the three QTLs were positioned in the four intervals. New QTL map of soybean vitamin E content was subdivided between Sat_239 and Satt022 as shown in Fig. 6. The three new markers were inserted into Sat_239 and Satt022 interval from the map. Thus, it was divided into four narrower intervals in order to locate the soybean vitamin E.
Screening high vitamin E of soybean and evaluation of comprehensive traits
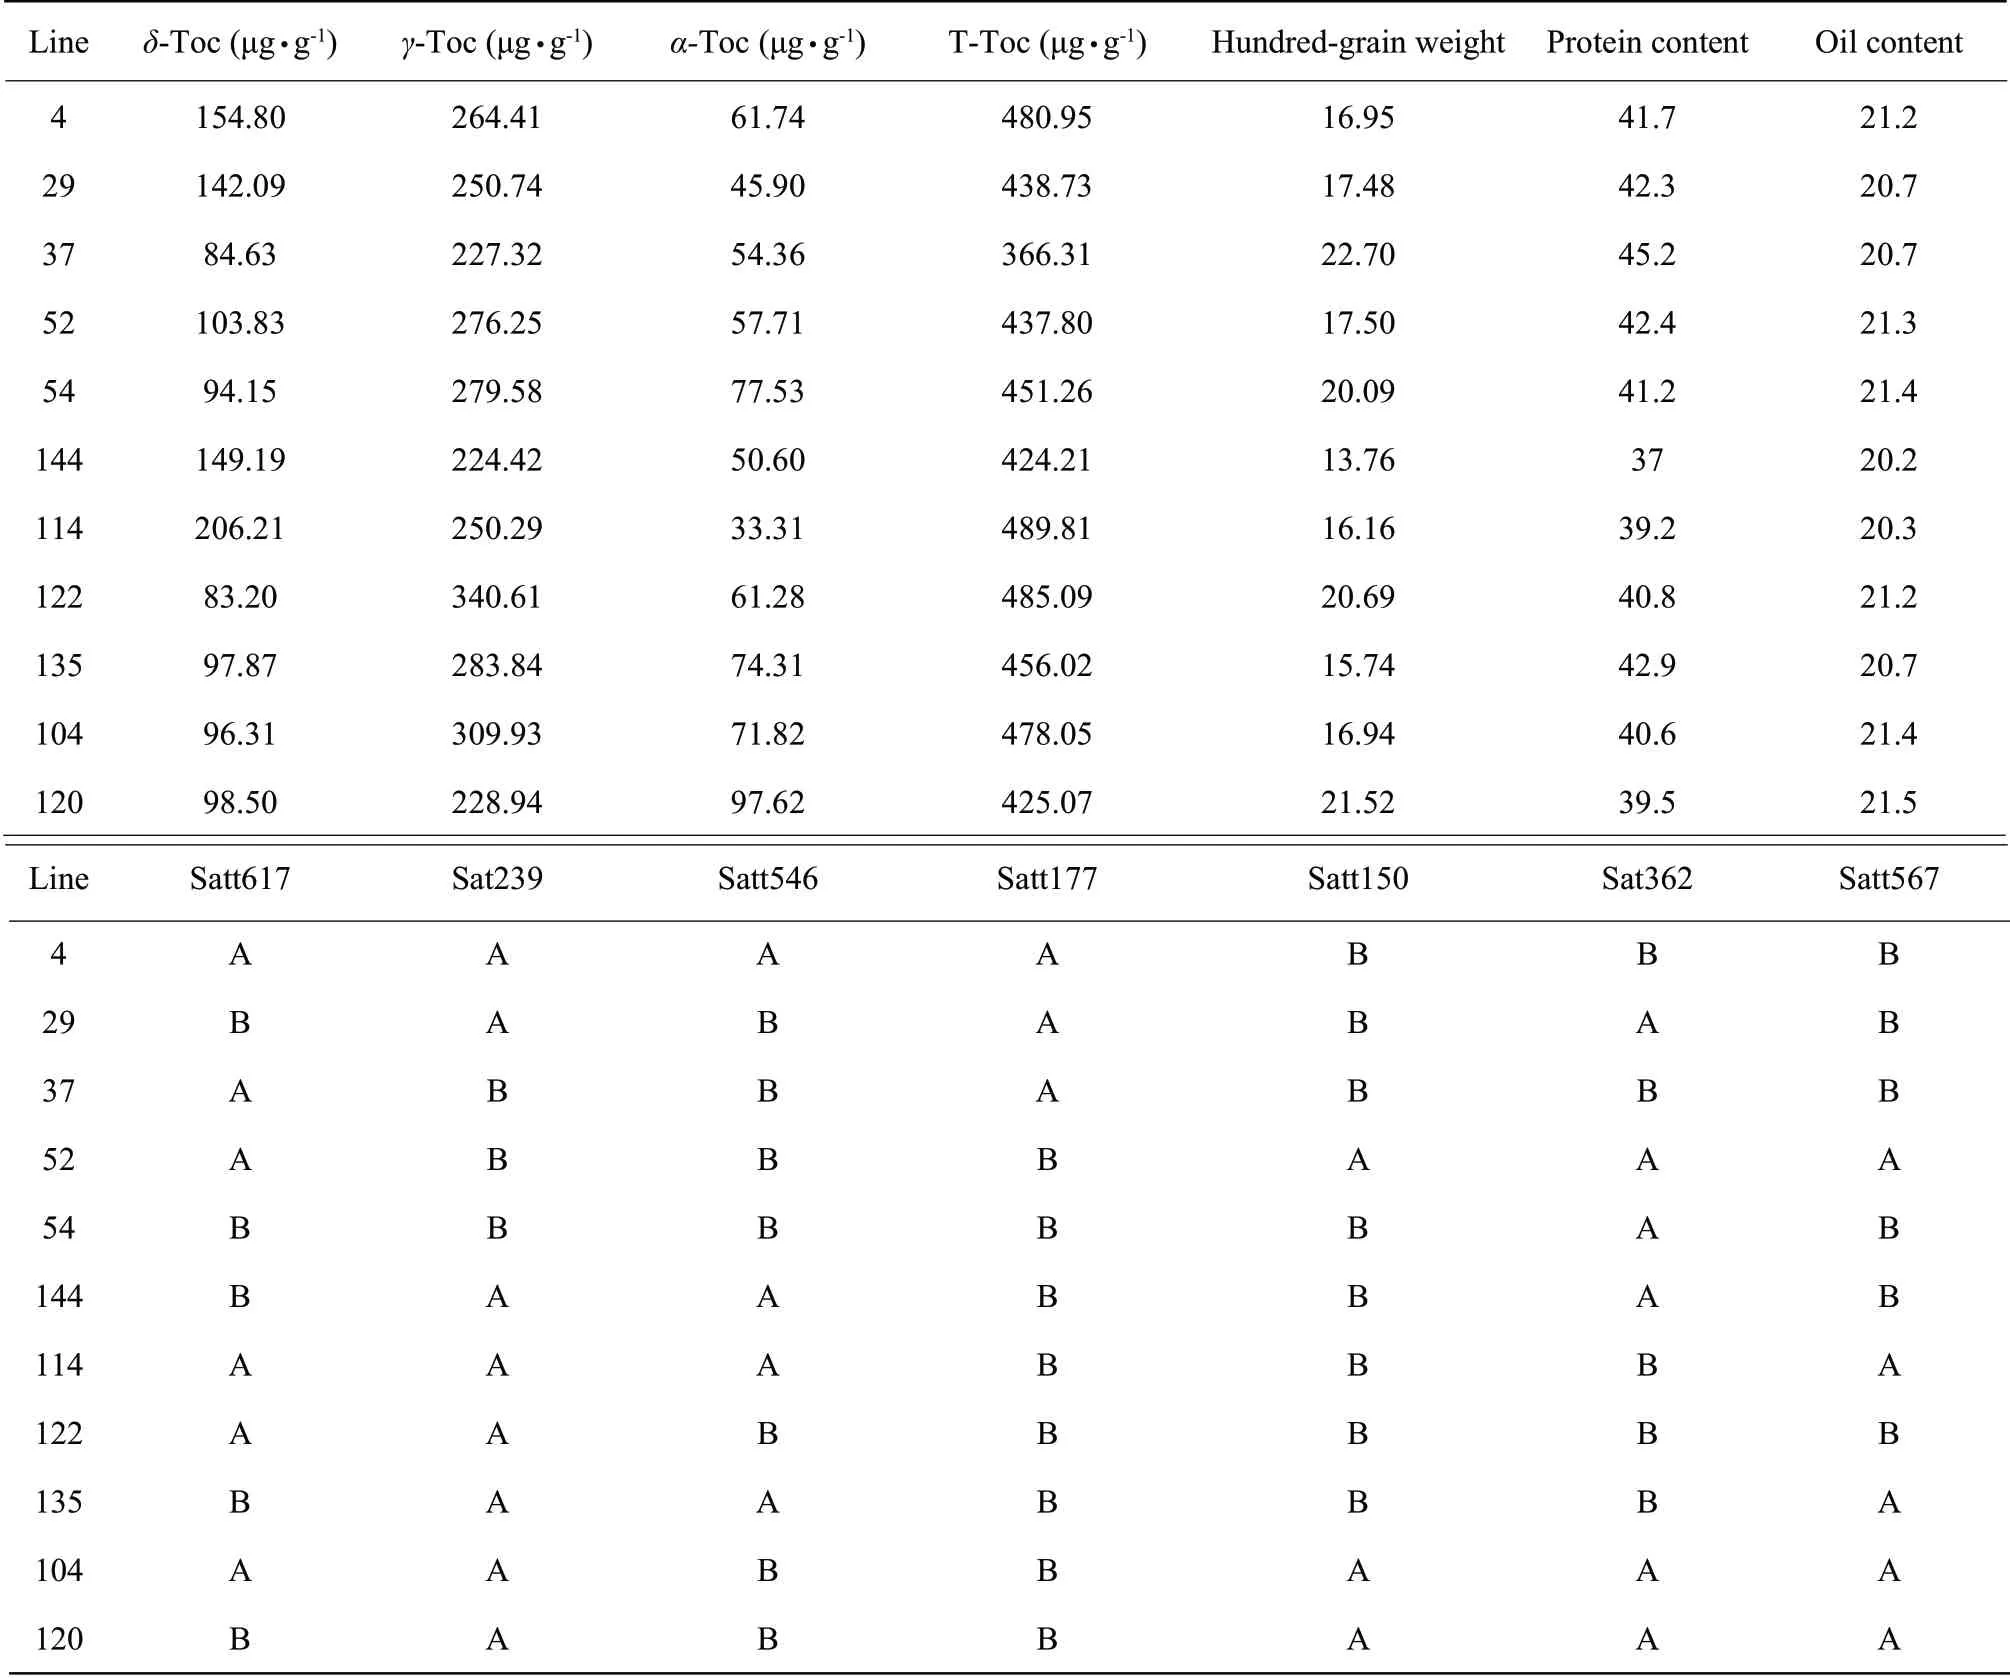
There were 11 excellent strains of high vitamin E of soybean as the followings: 4, 29, 37, 52, 54, 144, 114, 122, 135, 104 and 120 (Table 2), six of which possessed vitamin E contents of more than 450 µg • g-1, numbered 4, 54, 114, 122, 135 and 104.

Fig. 3 Molecular genetic map based on SSR markers

Table 1 Distribution of SSR markers on map

Fig. 4 Fine mapping of interval (Sat_239-Satt022) related to vitamin E in soybean

Fig. 5 SSR amplification in some plants of F2:7 populations

Fig. 6 New QTL of interval (Sat239-Satt022) related to vitamin E content in soybean
The strain 122 was selected in contrast to Hefeng25, due to its optimal comprehensive traits, combining with the performance of the agronomic traits of high vitamin E content strains, of which hundred-grain weight was 20.69 g and the protein and oil contents were 40.8% and 21.2%, respectively.

Table 2 Selection high vitamin E lines in Hefeng25×Bayfield F2:7 RILs populations
The vitamin E contents of strains 4, 29, 37, 52, 54, 144, 114, 122, 135, 104 and 120 were 360 μg • g-1to 500 μg • g-1. Hundred-grain weight of the strain 4 was 16.95 g. Its protein and oil contents were 41.7% and 21.2%, respectively. The comprehensive trait of the strain 54 was good, possessing 41.2% protein content, 20.09 g hundred-grain weight and 21.4% oil content. The protein content of the strain 114 was 39.2%. Its hundred-grain weight was 16.16 g and oil content was 20.3%. The hundred-grain weight of the strain 135 was 15.74 g and its yield traits were normal. Its protein and oil contents were 42.9% and 20.7%, respectively. The hundred-grain weight of the strain 104 was 16.94 g,and its protein and oil contents were 40.6% and 21.4%, respectively.
Discussion
QTL analysis of vitamin E
Seven major QTL sites associated with soybean vitamin E content were detected. They were Satt617 (chr9), Sat_239 (chr3), Satt546 (chr2), Satt177 (chr8), Satt150 (chr7), Sat362 (chr17) and Satt567 (chr7). In previous studies, stable QTLs were detected in multiple years and environments on linkage group D1a (chr1) and A2 (chr8) (Lianget al., 2019). Parket al. (2019) constructed a high-density genetic linkage map using SNP markers. Three QTLs related to vitamin E content were detected on chr9, chr11 and chr12. Among them, stable QTL was found on chr9. QTL on chr12 was related toα/γ-tocopherol content and was considered to be the interval ofγ-TMT. There were no genes involved in tocopherol synthesis in QTL on chr11; however, but there were two zinc finger transcription factors that elevatedγ-tocopherol content and thus indirectly raisedα-tocopherol content (Eenennaamet al., 2004). Ericet al.(2016) screened out QTLS related toα-tocopherol content on chr6 and the total tocopherol content on chr4. Liuet al.(2017) detected 66 QTLs for isoform and the total tocopherol content. More than half of them were located on chr15, considering that this linkage group was essential for vitamin E content. Further screening showed that four QTLs on chr15 could significantly increaseα-tocopherol content, all of which were stable in various environments (Liuet al., 2017). Although QTLs detected in this study located on the same linkage group with part of the precious studies, the genetic distance of these QTLs was distant.
Linkage analysis showed the natural variation for tocopherol levels in seed ofArabidopsis, soybean, rapeseed and sunflower (Dwiyantiet al., 2011; Fritscheet al., 2012; Haddadiet al., 2012). In maize, QTLs were detected for variation of tocopherol levels (Xuet al., 2012). Diepenbrocket al.(2017) reported natural variation in vitamin E levels in maize, providing important insights into the control of tocochromanol content. They found allelic variation was responsible for 56%-93% of phenotypic variation attributed to QTL for tocochromanols in maize grain, established a nearly complete foundation for the genetic improvement of vitamin E and non-vitamin E tocochromanol levels in the major food crop and likely in seed of the other major cereals. Quadranaet al.(2014) found a major QTL of the total tocopherol content in tomato, which explained about 50% of the variation in vitamin E content between the parental genotypes.
Application of major QTL related to soybean vitamin E content in molecular assisted selection of high vitamin E content varieties
The polymorphism of 157 SSR was detected in the parents. It was valuable for molecular assisted breeding on the N linkage group from Sat_239 to Satt022. QTLs (Sat_239 to Satt022) were positioned on the N linkage group through testing 144 RILs. Sixteen primers were designed from Sat_239 to Satt022. Three of them (GMSSR01, GMSSR13 and GMSSR14) were chosen. The original interval was divided into four sections by the three primers. QTL was located in the smallest interval in this study. These markers could be used to select high vitamin E content soybean varieties. Taking Hefeng25 as control and taking various agronomic traits into comprehensive consideration, six soybean varieties with high vitamin E contents and good qualities were selected.
Lipkaet al.(2013) reported MAS of vitamin E in maize. The missing heritability of tocochromanol content traits was explained by numerous small effect QTLs. The sample size of only 252 lines did not provide adequate statistical power to identify QTL with small effects. Molecular markers associated with QTL alleles could enhance the contents of vitamin E in a single maize grain. In maize, multiple populations were built and every isoform of tocopherol content was analyzed to construct a high-density genetic map related to vitamin E content (Meganet al., 2018). With the development of genome sequencing technology, the combination of linkage analysis and genome-wide association analysis (GWAS) will screen out major and fine QTLs for vitamin E contents (Wang, 2018; Zhanet al., 2019).
Conclusions
Vitamin E contents of the soybean were finely mapped in the Sat_239-Satt022 interval on the N linkage group. It was found that the three primers (GMSSR01, GMSSR13 and GMSSR14) were polymorphic between the parents, and they could be divided into smaller intervals. Seven major QTLs related to soybean vitamin E contents were detected. Molecular-assisted breeding was carried out in the interval of Sat_239-Satt022. Based on the multiple agronomic traits, six soybean lines with excellent quality traits and high vitamin E contents were screened, numbered 4, 54, 104, 114, 122 and 135. Among them, one was chosen to conduct regional trails.
杂志排行
Journal of Northeast Agricultural University(English Edition)的其它文章
- Identification of Co-dominant SSR Markers Associated with Genes Controlling α′- and α-subunit-null β-conglycinin Phenotypes in Soybean (Glycine max (L.) Merr.)
- Effect of Drought Stress on Growth and Water Physiological Characteristics of Poa sibirica
- Biotransformation of Flavor Compositions During Fermentation of Litchi (Litchi Chinensis Sonn.) Fruits into Wine
- Effect of Endophytic Fungus on Pyrola calliantha H. Andr Responsed to Cold Stress
- Uterine Expression of WNT7A and β-catenin After Induction of Oestrus in Sheep
- Multi-objective Function Optimization for Environmental Control of a Greenhouse Based on a RBF and NSGA-II
