Urban ecological sustainability assessment of the human-made system and natural system based on emergy and GIS approach
2021-04-23ZhangJunxueLiShan
Zhang Junxue Li Shan
(1 School of Architecture, Southeast University, Nanjing 210096, China)(2Urban Design Institute of Zhong Fang, Shanghai 201100, China)
Abstract:Due to the complexity of sustainable urban research, the environmental sustainability was assessed. Taking the sponge city as an example, the case study was conducted based on the integrated geographic information system (GIS) and emergy methods. The results demonstrate that the emergy of agricultural crops, major industrial products, comprehensive energy products, imports and exports, waste products and increased natural system emergy are the decisive factors for the sustainability assessment. Agricultural crops are the primary contributor, which accounts for 48.9% of the total emergy amount. Urban solid waste has a self-evident superiority in the waste products’ emergy proportion. Surface water and vegetal biomass emergy possess the pivotal consequences, far higher than soil organic matter. The sewage treatment stations (0.11%) play a small role in the sustainability assessment of the sponge city. The emergy sustainability index is 0.021 81, which indicates poor environmental sustainability. According to the study results, increasing renewable energy input proportion and adopting the vegetal biomass of high unit emergy values (UEVs) can improve the sustainability level.
Key words:sponge city; emergy analysis; geographic information system(GIS); ecological indicators; sustainability evaluation
With the rapid development of economy,urbanization is becoming more common in China. As the world’s largest developing country, China has more than 297 prefecture-level cities, which are all growing rapidly. The process of urban development requires a great deal of materials, energy, and capital; meanwhile, a large number of pollutants will be discharged, including exhaust gas, wastewater, and solid waste. For example, according to the Chinese state of the environment bulletin in 2018, 217 cities (73% of all cities in China) and 52% of Chinese rivers are substandards[1]. In 2019, 1.55×10¹⁰t of conventional solid waste, 4.643×10⁷t of industrial hazardous waste, 8.17×10⁵t of medical waste, and 2.147 3×10⁷t of domestic garbage were produced in China[2].Under these circumstances, Chinese cities face substantial environmental problems, and there is an urgent need to evaluate the environmental sustainability in the city.
Until now, several sustainable studies have been considered widely through different analysis perspectives for the cities.Many scholars have studied the relationship between environment and capital, such as the tourism economy[3], coal and sustainable city[4], strategic planning[5],indicators assessment[6],African perspective[7],shrinking cities sustainability[8], and behavioral guidance impact on the sustainability of city[9].
Therefore, there are some drawbacks of these studies, such as incomplete angles, a lack of pollutant emissions and no renewable energy, which will have a negative impact on sustainability. In order to optimize the research results, emergy analysis (EMA) was conducted in Ref.[10]. The greatest advantage of this approach is that it allows all elements to be considered in the system. Up to now, emergy-GIS has only been performed in the ecological city field.
Taking a city in Italy as an example,some researchers focused on renewable resource flows to evaluate sustainability based on the emergy-GIS approach.Emergy-GIS synthesis was applied to the natural and the human-made capital of the Campania region through the environmental support directly and indirectly provided by natural resources generation. In previous studies, emergy-GIS was adopted to assess renewable natural resources flow and net primary productivity in Japan. According to the emergy-GIS method, Qi et al.[11]selected the sponge urban area to study the reconstruction effect.Campbell[12]chose the megacities to study the sponge city transformation, which can enhance the application degree of the emergy-GIS theory. These studies have a series of shortcomings by using emergy and GIS investigations, including a non-sponge city selection, an old emergy baseline, a lack of pollution calculation and insufficient indicators, etc. In this context, this paper considers all the situations to make up for the defects for better sustainability in these cities.
1 Methodology
1.1 Study area
Lishui city belonging to Nanjing city has a subtropical monsoon climate, with an annual temperature of 15.4 ℃ and an yearly wind speed of 3.00 m/s based on the meteorological data of 2019.The land area is 1 067 km2, and it has a population of 443 600. As an essential area of Nanjing, the gross domestic product of Lishui is 1.237×10¹¹US dollars. All expenses have been converted into US dollars based on an exchange rate (6.87 Yuan=1 dollar). Fig.1 shows the specific residential area (red parts).

Fig.1 The residential area located in the city
1.2 Data collection of the sponge city
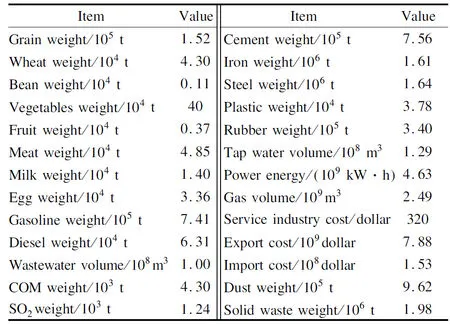
In order to calculate the sustainability of the sponge city, primary input data should be considered carefully, including agricultural data, industrial data, service data and energy data, etc.The main data is shown in Tab.1.
In order to enhance the sustainability in the sponge city, the sustainable assessment is conducted through the expansion of the sewage pipe network in the sponge city (see Fig.2).There will be 18 new pumping stations built in the city to improve the performance of the sponge city, and the sewage volume is 3.79×10⁵m3/d.

Fig.2 The expansion of the sewage pipe network in the sponge city
1.3 Emergy approach
1.3.1 Emergy analysis
As a comprehensive concept, the emergy method comprises of the direct part, the indirect part, the energy part, and labor & service. Its unit is solar emergy, which was proposed by Odum[10]first. The most important superiority of emergy is that it can integrate environment resources, products, and services into a unified platform to assess the impact of sustainability[13]. The specific emergy calculation method involves the multiplication result by quantity and unit emergy values (UEVs). In more detail, mass, energy, and money can be converted into solar emergy(unit: sej) by way of unit emergy values[14]. In this paper, the latest emergy baseline (12×1024sej/a) was adopted for the sustainable assessment of the sponge city.
1.3.2 Emergy inputs of the sponge city
There are three inputs to connect the sponge city, including renewable energy, the agricultural resources input part, and the waste product input. The non-renewable part consists of agricultural resources, industrial resources, energy, labor & service, the export,and the import part.The renewable part is the renewable energy, including sunlight, rain(chemical potential), rain(geopotential), wind(kinetic energy), and geothermal heat. The discharge part is composed of pollutant emissions,which are the exhaust gas and solid waste.
1.3.3 Ecological indicators
In this paper, there are a series of emergy indicators for the sponge city assessment. For example, the renewability rate, increased natural system rate, increased human-made system rate,emergy personal density, emergy intensity, environmental pollutant rate, emergy investment ratio[15], emergy yield ratio, environmental loading ratio and emergy sustainability index[16], etc.
1.4 GIS method
As a universal and capable software,the geographic information system(GIS) plays a pivotal effect in several research fields. Therein the urban sustainability is one of them[17]. Generally speaking, the GIS integrates hardware, software, data, people, procedures, etc. It can take advantage of the collection, storing, manipulating, analysis, and visualization for the spatially distributed phenomena to realize the multiple purposes, involving inventory, management, and strategic reference[18].
1.5 Increased human-made system emergy calculations
1.5.1 Sewage treatment station emergy calculation
There are two steps for the sewage treatment station emergy calculation. First, the freshment volume needs to be calculated, as follows:
(1)
whereQiis the emergy of fresh water;Hiis the water pollutant disposal weight per year (2.5×10⁸kg/a);dis the density of water (1 000 kg/m3);eiis the acceptable concentration (15 mg/L);Mwateris the discharged wastewater volume per year (4.51×10⁶m3/a).
Secondly, the emergy of wastewater can be obtained as
Ewater,i=QiTn
(2)
whereEwater,iis the emergy from the evaluated system;Tnis the unit emergy value of surface runoff in China.
1.5.2 COD emergy calculation of the nonpoint source pollution
In order to assess sustainability using emergy in the sponge city, the chemical oxygen demand (COD) emergy of the nonpoint source pollution should be computed.The stormwater runoff is required to be responsible for the nonpoint source pollution in the urban area, which can take the natural and human-made pollutants into the water bodies[19]. As the most important indicator, COD represents the pollution level, so the COD emergy must be calculated for the sponge city assessment.According to Qin et al.[20], about 50%of stormwater was polluted and it is similar to wastewater. In light of the assumption proportion, the COD emergy of the stormwater runoff can be displayed as[21]
WCOD=0.5ACODfCODθVwater
(3)
whereWCODis the energy amount in COD (J);ACODis the concentration of COD (120 mg/L);fCODis the energy content of 1g COD (3.4 k/g);θis the unit ratio (4 186 J/K);Vwateris the volume of the storm runoff water.
Eβ=WCODQUEV
(4)
whereWCODcan be calculated by Eq.(3), andQUEVis the unit emergy value of the wastewater.
1.5.3 Industrial pollutant emergy calculation in the sewage treatment station
On the basis of the related study[22], the human health effect can be assessed as[23]
L=∑WiDiα
(5)
whereLis the human health effect emergy loss;Wiis the exhaust amount (m3);Diis the disability adjusted life per year;αis the emergy of humans per year (1.68×10¹⁶sej/(a·person))[24].
The exhaust gas amount is
(6)
whereMiis the dilution air amount per year (kg/a);cis the air density (1.23 kg/m3);Uiis the mass of annual air pollutants (kg/a);siis the acceptable concentration (mg/m3).
The ecological service emergy can be obtained as
Rair,i=0.5Miv2Tw
(7)
whereRair,iis the environmental emergy;vis the wind speed (3 m/s); andTwis the wind transformity (1.86×10³sej/J).
Mud emergy can be obtained as[25]
SLM=ZmudPLβL
(8)
whereSLMis the mud emergy;Zmudis mud value (2.32 ha);PLis land demand[26];βLis the transformity of land.
1.6 Emergy calculations of the natural system
For the natural system in the sponge city, there are three categories, including vegetal biomass, soil organic matter, and surface water. The specific calculated formulas can be found as follows.
1.6.1 Surface water emergy calculation
In this paper, there is a hypothesis; i.e., the annual runoff volume is equal to the accumulated surface water for the sponge city.The surface water emergy is[27]
Fi=VdG
(9)
whereFiis the energy of the surface water (J);Vis the volume of water (m3);Gis the Gibbs free energy of surface water, and the value is 4 940 J/kg.
Ef=FiUi
(10)
whereEfis the emergy of surface water in the sponge city(sej);Uiis the unit emergy value of surface water (2.05×10⁴sej/J)[28].
1.6.2 Vegetal biomass emergy calculation
In order to calculate the vegetal biomass emergy, the following formula can be used:
U=∑(SiUi)i=1,2,…,n
(11)
whereUis the entire vegetal biomass emergy;Siis the vegetal biomass amount (mass, volume, or number);Uiis the unit emergy value of the vegetal biomass in the sponge city.
2 Results and Discussion
2.1 Emergy value in the sponge city
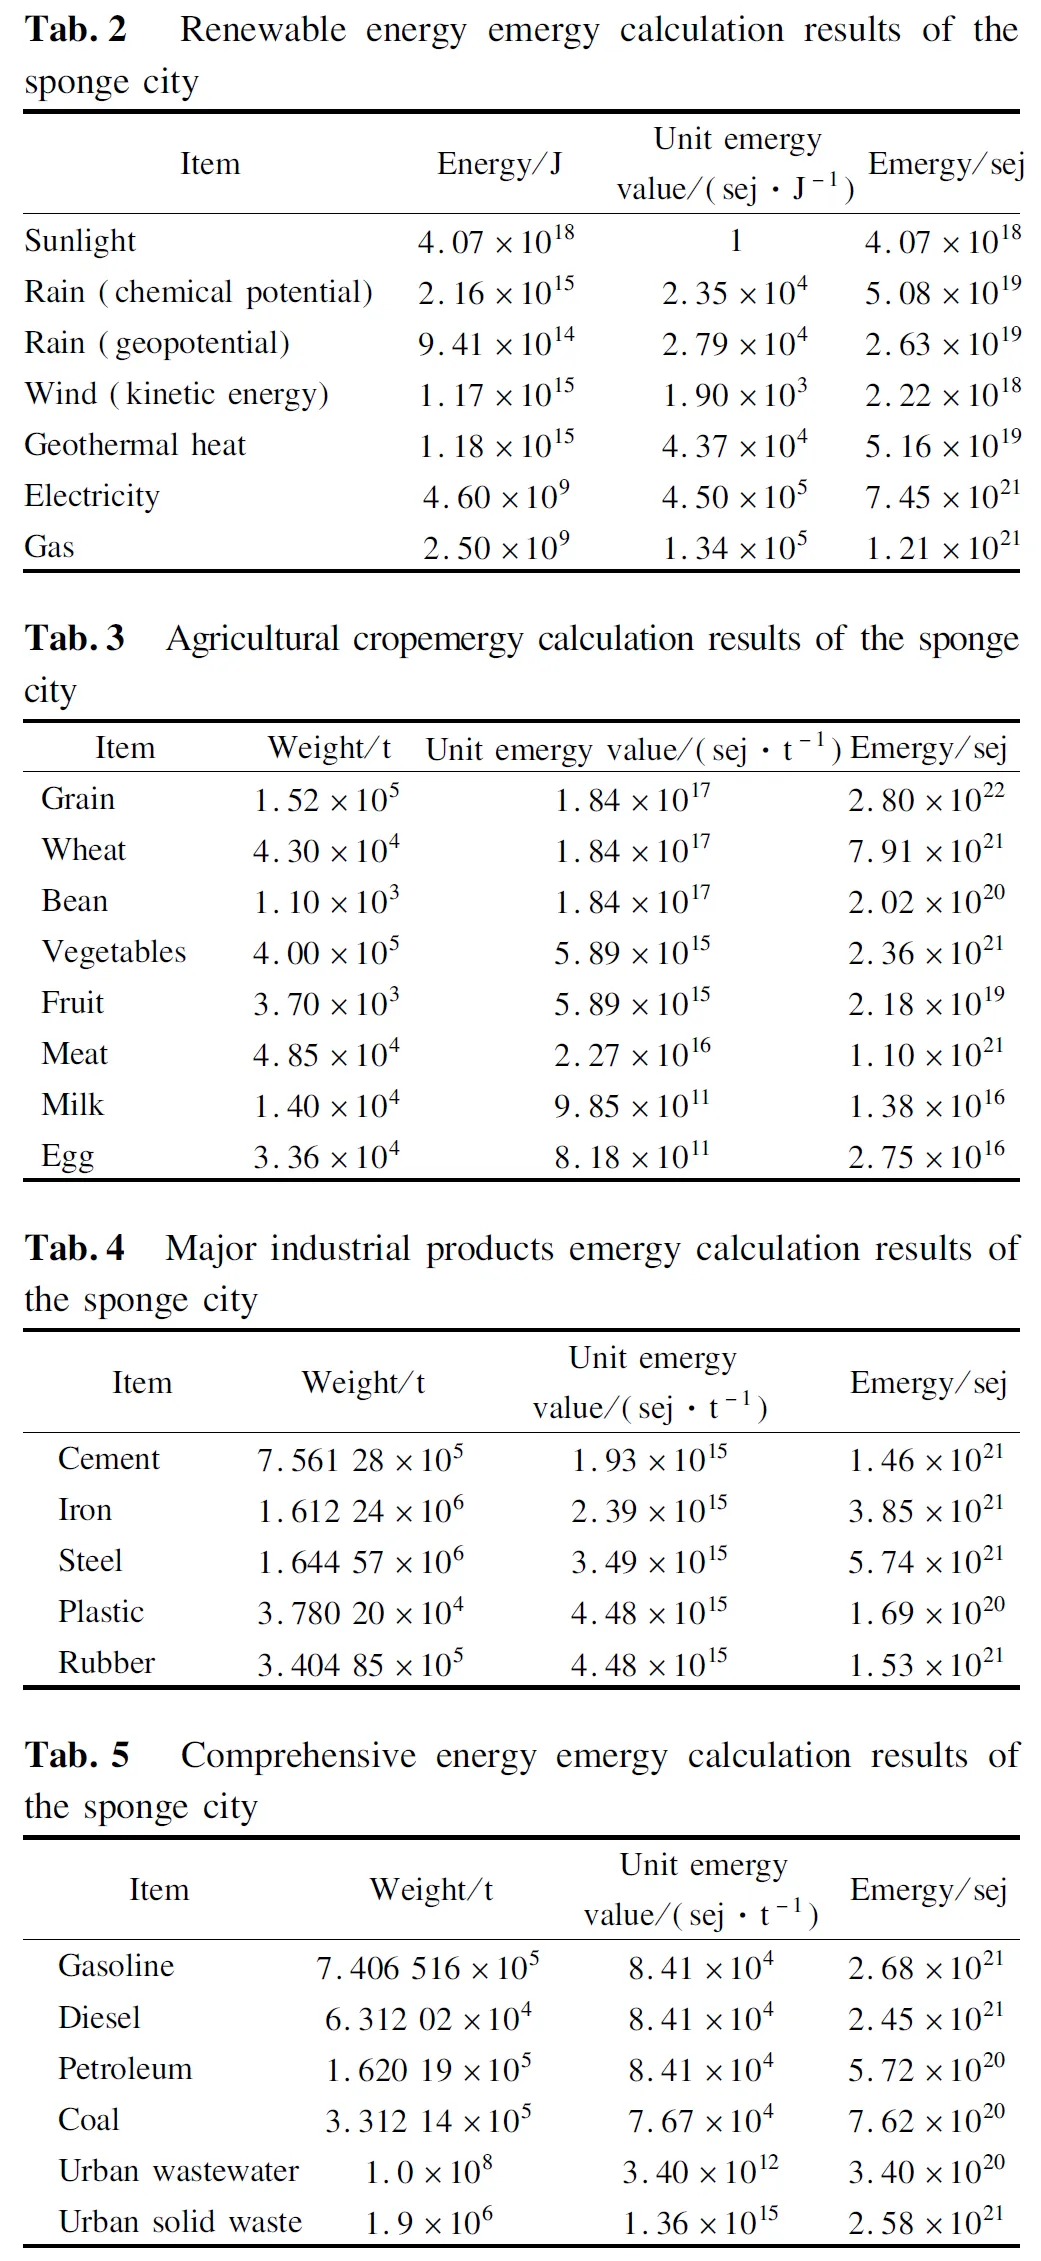
In Tab.2, the unit emergy value of sunlight and geothermal heat can be referred as Refs.[29-30]. In Tab.3, all the unit emergy values can be obtained from Ref.[31]. In Tab.4, the unit emergy values of plastic can be obtained from Ref.[32]. In Tab.5, the unit emergy values of diesel can be found in Ref.[33]. The unit emergy values of the service industry can be obtained from Ref.[34].
2.2 Emergy analysis
In Tabs.2 to 7, several comprehensive evaluated tables have been calculated to demonstrate the emergy structure of the sustainable contributions in the sponge city.There are nine sections that affect the estimated result, including renewable energy emergy, agricultural crop emergy in 2019, major industrial products emergy in 2019, comprehensive energy emergy in 2019, labor & services emergy in 2019, imports and exports emergy in 2019, waste product emergy in 2018, natural system emergy and pollutant emissions emergy.

According to the proportion of all items, the emergy of agricultural crops, major industrial products, comprehensive energy products, imports and exports, waste products and increased natural system emergy account for 99.31% of the entire emergy in the sponge city, which are the decisive factors for the sustainability assessment. Agricultural crops are the primary contributor, which accounts for 48.9% of the total emergy amount, followed by comprehensive energy (18.7%), major industrial products (16.3%), imports and exports (7.26%), waste products of sponge city (4.98%), increased natural system emergy (3.32%).
As a human-made system, the sewage treatment stations (0.11%) play a small role in the sustainability assessment of the sponge city; meanwhile, the natural system (0.11%) also has a little effect on the evaluated system as a whole.
Moreover, renewable energy (0.17%) and labor & services (0.45%)have an unconsidered status for the sustainability assessment in the sponge city.
In details of the agricultural crop emergy in 2019, the grain, wheat, and vegetables have dominant impacts, and the proportions are 47.3% of the total emergy and 96.7% of the agricultural crop emergy. For comprehensive energy in 2019, it exerts a secondary influence on the complete result, and the primary energy types are electricity (9.2%), gasoline (3.31%), and diesel (3.02%).The major industrial products in 2019 were the third most influential factor, and they were composed of cement (1.86%), iron (4.75%), steel (7.09%), plastic (0.21%), rubber (1.89%), and tap water (0.55%). Among them, steel and iron are the essential parts and take up a 72.3% ratio for the entire industrial product emergy.Imports and exports in 2019 make the role of the fourth. Therein, export emergy (5.9%) is more crucial than the imports emergy (1.36%).
Given the waste products emergy of the sponge city in 2019, there is also a necessary implication, comprising of urban wastewater (0.42%), chemical oxygen demand (1.02%), carbon dioxide (0.01%), dust (0.26%), and urban solid waste (3.19%). Urban solid waste has a self-evident superiority in the waste products’ emergy proportions.
Natural system emergy consists of three factors, including surface water (1.73%), vegetal biomass (1.59%), and soil organic matter (0.00%). Therein, the surface water and vegetal biomass possess the pivotal consequents in light of natural systememergy, far more significant than soil organic matter. The human-made system has two items, including exhaust gas (dust and SO2) and the mud waste of stations, which has hardly any impact (0.11%) on the emergy assessment of the sponge city.
2.3 Emergy indicators analysis
All the ecological indicators of the sponge city are shown in Tab.8. The renewability rate is 1.665×10⁻³, which can demonstrate the weak sustainability and ecological level for the sponge city. As the unit indicator, emergy personal density and emergy intensity are 1.83×10¹⁷sej/person and 7.59×10¹³sej/m3, which are high emergy level for people and land use. Environmental pollutant rate, emergy investment ratio, emergy yield ratio and environmental loading ratio are the foremost indices for sustainability in the sponge city and based on these results, the final emergy sustainability index can be calculated. In this paper, their values are 0.048 927, 0.072 562, 11.611 2, 532.436 7 and 0.021 81, respectively. According to the standard study[16], the sustainability indicator is less than 1, which illustrates the negative sustainability degree for the sponge city in the long run.
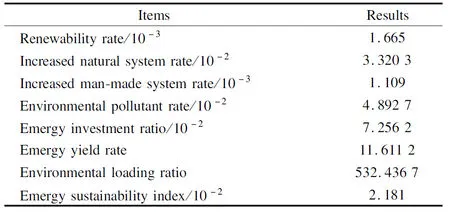
Tab.8 Calculated results of ecological indicators
2.4 Increased natural system impact on sustainability assessment in the sponge city
2.4.1 Surface water changes based on GIS and emergy methods
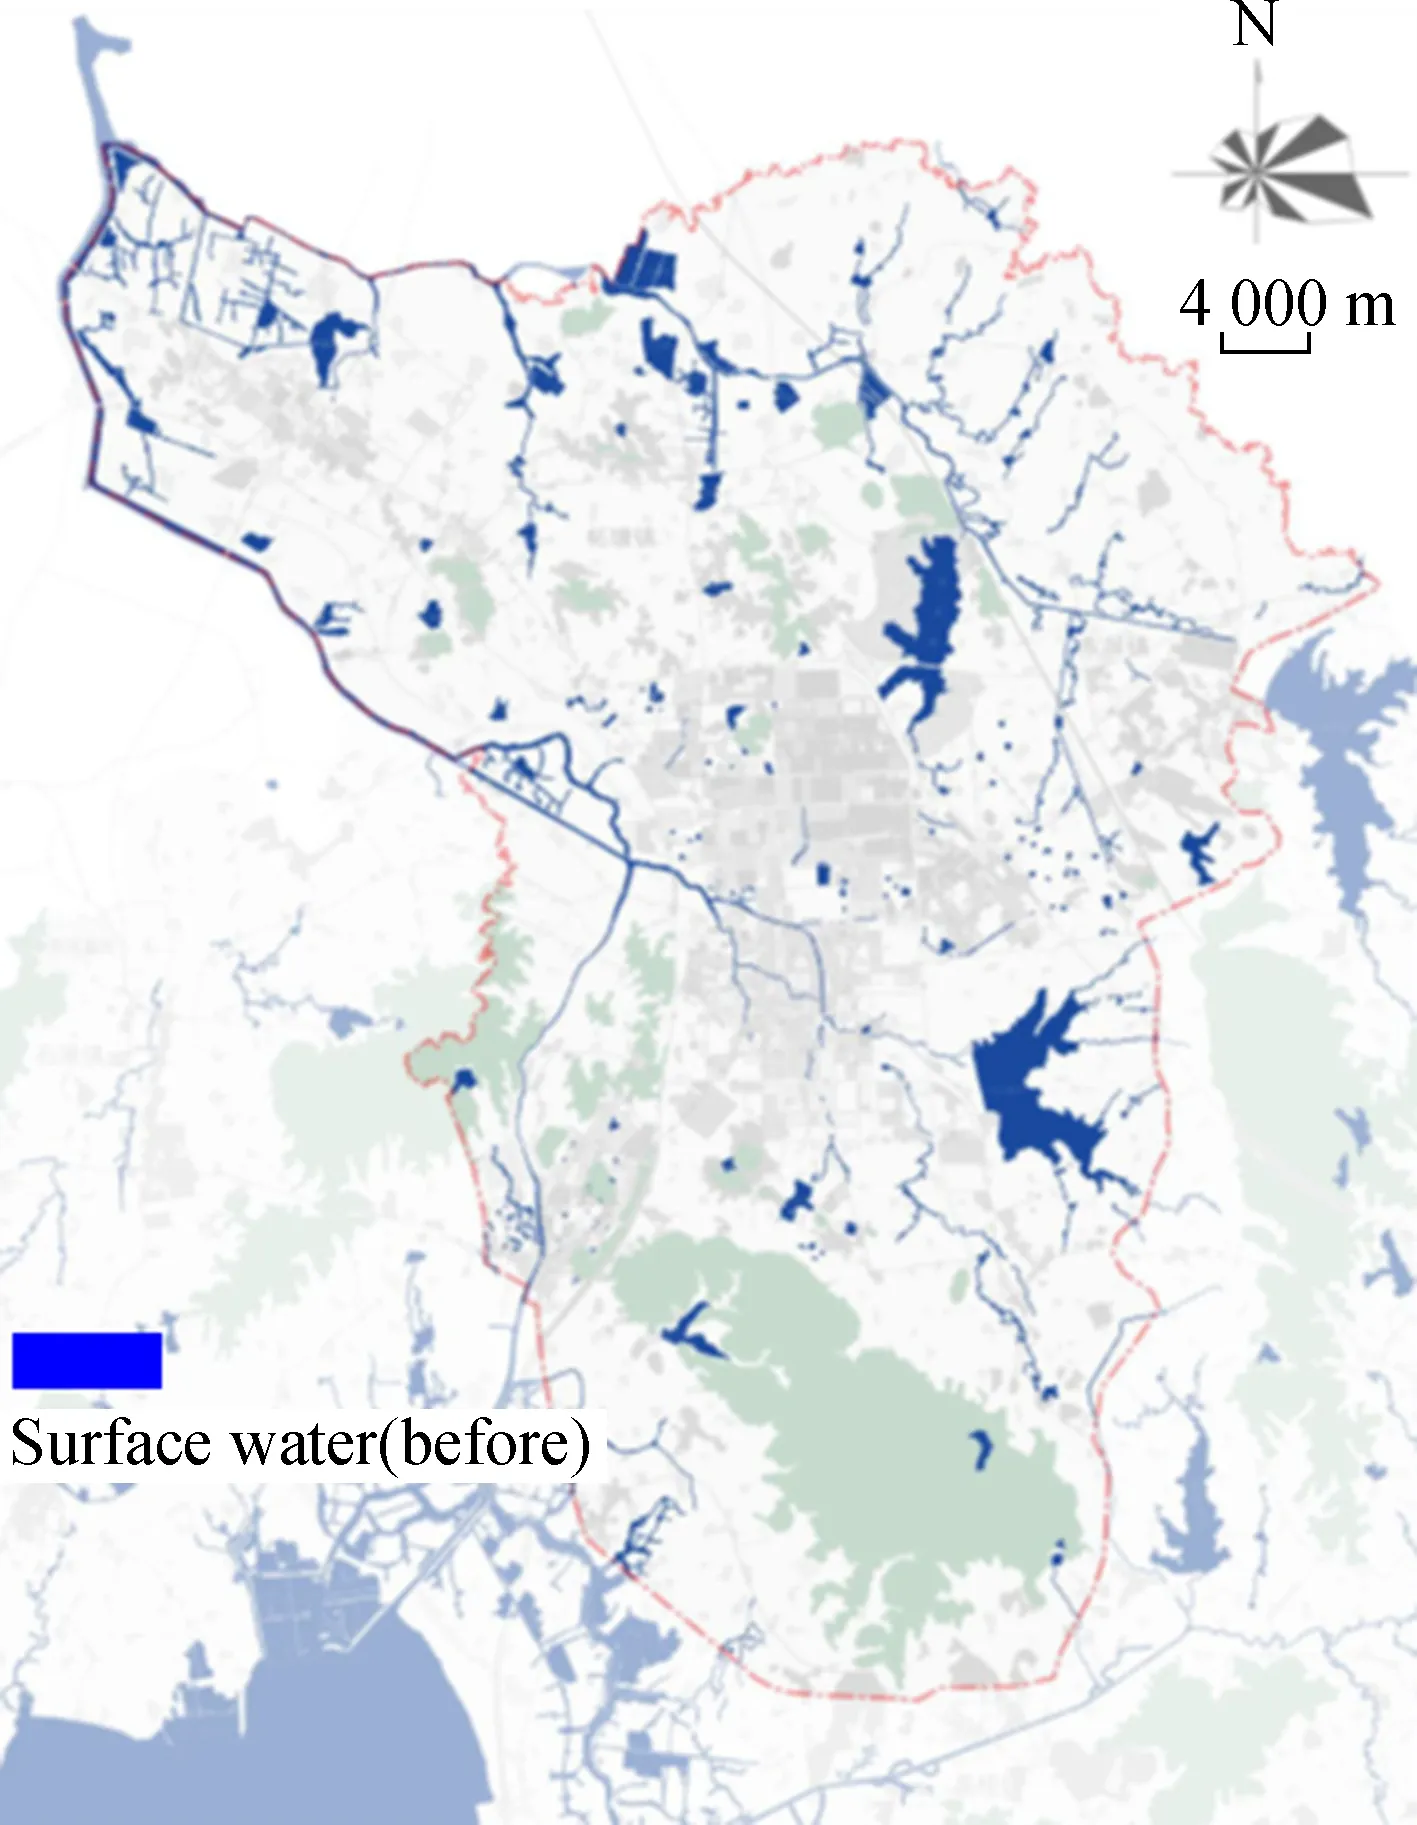
The simulation effects are shown in Fig.3. Fig.3(a) is the surface water before the construction of the sponge city, and Fig.3(b) is the current state of the surface water.
(a)
On the basis of the GIS method, the difference between the two pictures can be found. There is an apparent variation, which increases the surface water area, especially on the northwest side of the city. Fig.3(b) shows the clear signs of water accumulation due to the natural surface water increment.
According to our investigation and official statistics, before planning and construction of the sponge city, there was a 22.66 km2surface water area and the surface water ratio was 6.17%. After the construction, the corresponding data is 29.42 km2and the surface water ratio becomes 8.01%. Following the emergy approach, the emergy proportion of surface water accounts for 1.73% of the whole emergy in the sponge city, which corresponds to a surface water area ratio of 1.84%.
In this section,the GIS method gives the qualitative presentation and exhibits fine visualizations for the result in the sponge city; meanwhile, the emergy method provides the quantitative calculations to assess the sustainable level. Through the integrated analysis of these two approaches, it is better to demonstrate the effect of sustainability evaluation.
2.4.2 Vegetal biomass changes based on GIS and emergy methods
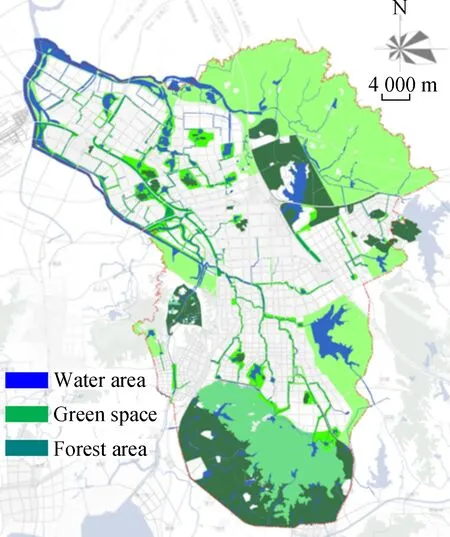
A parallel analysis mode can be used in Fig.4. Given the GIS consequence, there is a sharp distinction between the previous result and latter reconstruction, as shown in Fig.4.In line with an approximate estimate, the green land area in Fig.4(b) is greater than that in Fig.4(a). In Fig.4(b), the green area accounts for more than 50% of the total area. It is simple to generate the qualitative results so that much greater sustainability can be displayed in Fig.4(b) due to the large green land area.
(a)
Compared with the GIS methodology, the emergy analysis offers a different result in Tabs.2 to 7.Between the two effects, there is only 1.59% of emergy amount difference rather than more than 50% disparity in the sponge city.
Through the GIS method, good visualization can be realized for the sustainability effect. In order to improve the situation, the emergy analysis can be adopted as a supplement. A unified analysis that integrates the GIS and emergy methodology can produce reliable and more precise results for the sustainability assessment of the city, including qualitative analysis and quantitative analysis.
2.5 Increased human-made system impact on sustainability assessment in the sponge city
In this paper, as an input item, there is a human-made system that is added to the evaluated system of the sponge city, which is the sewage treatment system, involving 18 sewage treatment stations. The emergy analytical results can be sought out in Tab.2.The human-made system is made up of exhaust gas (dust and SO2) and mud waste, and only 0.11% of the emergy proportion belongs to the human-made system, which has shown a weak influence on the sustainability assessment in the sponge city.Taking the man-made system as an example, the exhaust gas (dust and SO2) barely contributes to the the emergy assessment of the sponge city.
2.6 Similar research comparison
Until now, there are several articles that involve the GIS method and Emergy approach.Compared with this paper, some weaknesses can be found, as follows: The old emergy baseline has been adopted in one paper[11]; meanwhile, no emergy baseline can be discovered in others. Due to having the old emergy baseline or no baseline, the sustainability assessment for the city is harmed. Meanwhile, only two papers conducted studies based on the GIS-emergy method in the sponge city. This can also create research uncertainty while sustainable evaluation is conducted in the town.Compared to these papers, no paper performed the calculations of the added natural system or added a human-made system. Finally,as the pivotal evaluated indices for sustainability, few articles carried out the emergy indicators design, which affect the accuracy of the assessment.
3 Suggestions and Strategies
3.1 Enhancing renewable energy input proportion
In this paper, renewable energy has been considered for sustainability assessment in the sponge city system. Obviously, owing to the small proportion, it has almost no effect on the sustainability of the system. In order to improve the situation, the energy structure should be adjusted for the city system, especially enhancing renewable energy input proportion, such as solar power, hydropower, and wind power. In China, there are several obstacles for large-scale deployment of such clean energy, involving superabundant investment, professional and technical obstacles, and geographical restrictions. For the purpose of improvement, financial subsidies and favorable tax policies are good measures for enlarging the clean energy proportion. A few studies can give the references, such as solar power[35], hydropower[36], wind power[37].
3.2 Adopting the vegetal biomass of high UEVs in the natural system
As a critical part, the selections of plant species and vegetal biomass play an irreplaceable role. For the sake of sustainable level improvement in the sponge city, plant species and vegetal biomass with high unit emergy values(UEVs) should be chosen. In this paper, the vegetal biomass emergy accounts for 1.59% of the entire emergy in the sponge city. If several plant species and vegetal biomass with high UEVs can be used in the emergy calculations, the emergy proportion of the natural system will rise to some extent, resulting in a higher sustainability for the sponge city.
For example,when you have four choices of plant species, citrus and arboriculture should be selected rather than shrub and poplar forest based on the high UEVs standards, for the purpose of boosting the sustainability level in the sponge city.
3.3 Feasibility and advancement of emergy-GIS methodology
Based on the GIS pictures, the high definition details of the sponge city can be found, such as surface water, a residential area, green vegetation area, agriculture, forestry and mountain areas, etc. Through the changes in GIS pictures in a sponge city, qualitative results can be obtained so as to help the reader understand the research content well, which is a significant advantage. Compared to the GIS method, the emergy analysis can generate accurate quantitative calculations apart from a good visualization effect. In view of the benefits of the GIS method and emergy approach, a unified platform(emergy-GIS) can be formed to study sustainability in the sponge city.
4 Conclusions
1) The emergy of agricultural crop, major industrial products, comprehensive energy products, imports and exports, waste product and increased natural system emergy are the decisive factors for the sustainability assessment.
2) Agricultural crop is the primary contributor, which accounts for 48.9% of the total emergy amount, followed by comprehensive energy (18.7%), major industrial products(16.3%), imports and exports (7.26%), waste products of sponge city (4.98%), and increased natural system emergy(3.32%).
3) As a human-made system, the sewage treatment stations (0.11%) play a small role in the sustainability assessment of the sponge city.
4) A series of indicators are 0.001 665 (renewability rate), 0.033 203 (increased natural system rate), 0.001 109 (increased man-made system rate), 0.048 927 (environmental pollutant rate), 0.072 562 (emergy investment ratio), 11.611 2 (emergy yield ratio), 532.436 7 (environmental loading ratio), and 0.021 81 (emergy sustainability index).
5) A unified analysis that integrates the GIS and emergy methodology can produce reliable and more precise results for the sustainability assessment of the city, including qualitative analysis and quantitative analysis.
6)The shortcomings have been improved in this paper in order to obtain precise sustainability assessment results.
杂志排行
Journal of Southeast University(English Edition)的其它文章
- Intracellular temperature measurementby a dual-thermocouple difference method
- 3D heterogeneous integration of wideband RF chipsusing silicon-based adapter board technology
- A method for constraining the end effect of EMD based on sequential similarity detection and adaptive filter
- A bearing fault feature extraction method based on cepstrum pre-whitening and a quantitative law of symplectic geometry mode decomposition
- Fatigue life evaluation of girth butt weld within welded caststeel joints based on the extrapolation notch stress method
- A neural network method for estimating weighted mean temperature over China and adjacent areas
