Predictive value of MGMT promoter methylation on the survival of TMZ treated IDH-mutant glioblastoma
2021-04-22RuichaoChaiGuanzhangLiYuqingLiuKenanZhangZhengZhaoFanWuYuzhouChangBoPangJingjunLiYangfangLiTaoJiangYongzhiWang
Ruichao Chai, Guanzhang Li, Yuqing Liu, Kenan Zhang, Zheng Zhao, Fan Wu, Yuzhou Chang, Bo Pang, Jingjun Li, Yangfang Li, Tao Jiang,, Yongzhi Wang,
1Department of Molecular Neuropathology, Beijing Neurosurgical Institute; Chinese Glioma Genome Atlas Network (CGGA), Capital Medical University, Beijing 100070, China; 2Department of Neurosurgery, Beijing Tiantan Hospital, Capital Medical University, Beijing 100070, China
ABSTRACT Objective: O6methylguanine-DNA methyltransferase (MGMT) promoter methylation is a biomarker widely used to predict the sensitivity of IDH-wildtype glioblastoma to temozolomide therapy. Given that the IDH status has critical effects on the survival and epigenetic features of glioblastoma, we aimed to assess the role of MGMT promoter methylation in IDH-mutant glioblastoma.
KEYWORDS Glioblastoma; O6methylguanine-DNA methyltransferase; isocitrate dehydrogenase; temozolomide; pyrosequencing
Introduction
The alkylating agent temozolomide (TMZ) is the first-line chemotherapy drug for glioma, the most common malignant primary brain tumor in adults1-5. Glioblastoma (GBM, WHO grade IV), the most aggressive glioma, has a median survival rate of 14-16 months despite intensive treatment including neurosurgical resection, concurrent radiotherapy and TMZ therapy, and adjuvant TMZ treatment for several cycles1,2,6-8. GBM are classified according to whether they express the wildtype or mutant isocitrate dehydrogenase (IDH) gene; more than 85% of all GBM have wildtype IDH9,10. The prognosis of IDH-wildtype cases is poorer than that of IDH-mutant cases, and the genetic, epigenetic, and clinical features differ between IDH-wildtype and IDH-mutant GBM10-17. On the basis of these findings, the Consortium to Inform Molecular and Practical Approaches to CNS Tumor Taxonomy (cIMPACT-NOW) update 5 suggests that IDHmutant GBM should be denoted astrocytoma, IDH-mutant, grade 4, but notes that this change in this terminology may be viewed as controversial and will require further discussion in context of the next WHO classification11. Therefore, we have used the terminology of IDH-mutant GBM in this study.
O6-methylguanine-DNA methyltransferase (MGMT) is a DNA repair enzyme that can rapidly reverse alkylation at the O6 position with its own irreversible consumption4. The expression level of MGMT strongly depends on the methylation level of its promoter region4,18. In a series of clinical trials, promoter methylation of MGMT has been demonstrated to be associated with significantly improved survival in patients with GBM treated with TMZ4,5,19,20. However, this conclusion has been based mainly on cohorts dominated by IDHwildtype patients with GBM. Study of the roles of MGMT promoter methylation in a homogeneous cohort of IDH-mutant patients with GBM is therefore urgently needed.
The methylation status of the MGMT promoter is widely classified as “methylated” or “unmethylated” through quantitative methods such as pyrosequencing (PSQ) with a defined cutoff value21-24. How the optimal cutoff value should be defined and whether a single cutoff value can fully reflect the clinical response to TMZ therapy are critical issues remaining to be resolved24-26. Several studies in cohorts dominated by IDH-wildtype patients with GBM or comprising exclusively IDH-wildtype patients with GBM have shown that the survival of TMZ-treated patients with GBM can be divided into 3 or more groups on the basis of the extent of MGMT promoter methylation27-29. In addition, the cutoff value determined in IDH-wildtype GBM cases might not be suitable for IDH-mutant cases. Considering gliomas overall, the MGMT promoter methylation of IDH-mutant glioma (mainly lower-grade glioma, WHO grade II/III) is significantly higher than that of IDH-wildtype glioma (mainly GBM), and more than 90% of cases of IDH-mutant gliomas have been determined to be MGMT promoter methylated according to the cutoff value used for IDH-wildtype GBM2,23,30. Methylation levels of the MGMT promoter can be used to stratify the progression-free survival (PFS) of TMZ-treated IDH-mutant lower-grade glioma (LGG) with TMZ therapy into 3 groups according to cutoff values significantly higher than those commonly used in IDH-wildtype GBM cases30. Together, these findings suggest that the predictive cutoff value for MGMT promoter methylation in IDH-mutant GBM must be reassessed because it is likely to differ from that in IDH-wildtype GBM.
Here, our aim was to determine the predictive value of MGMT promoter methylation levels in IDH-mutant GBM. We investigated the effects of IDH mutant status on MGMT methylation and MGMT mRNA expression in 187 IDHmutant GBM and 173 IDH-wildtype cases. Then, we compared the PFS and overall survival (OS) of patients in different methylation groups of 75 TMZ treated IDH-mutant GBM cases. We additionally compared the predictive cutoff levels of MGMT promoter PSQ testing between IDH-mutant and IDH-wildtype GBM samples.
Materials and methods
Samples, clinical and patient data
A total of 187 patients diagnosed between 2006 and 2018 (WHO grade IV) with GBM with IDH mutation were enrolled in the Chinese Glioma Genome Atlas (CGGA) Database. Another 173 patients diagnosed with GBM with IDH-wildtype for whom MGMT promoter methylation information was available were also enrolled for comparison. The clinical characteristics of these patients are summarized in Supplementary Table S1.
There are 98 CpG sites located in the MGMT promoter region (chr10: 131264949-131265710 from the 5′-end to the 3′-end). Our previous study showed that the average methylation levels at 4 or more of CpG sites 72-82 have similar predictive effects2,31. In 50 patients who were diagnosed before June 2016 with IDH-mutant GBM and treated with TMZ for at least 3 cycles, methylation information for CpG sites 75-78 was available (cohort A); in 25 additional cases diagnosed after June 2016, methylation information for CpG sites 76-79 was available (cohort B). These data were used to study the predictive value of MGMT promoter methylation levels for TMZ treatment. The TMZ protocols for these patients followed the Chinese Glioma Cooperative Group Clinical Practice Guidelines for the management of adult diffuse gliomas1. For patients with primary GBM or recurrent/secondary GBM who had not received radiotherapy, the chemotherapy regimen was TMZ at a daily dose of 75 mg/m2during concurrent chemoradiotherapy, and then at least 3 adjuvant TMZ treatment cycles over 5 days during each 28-day cycle at doses of 150-200 mg/m2. Patients with recurrent/secondary GBM who had previously received radiotherapy received only TMZ treatment at a dose of 150-200 mg TMZ mg/m2over 5 days during each 28-day cycle for at least 3 cycles.
The PFS and OS information for all cases was extracted from the CGGA database. We also compared the clinical characteristics of cases in cohort A and cohort B (Table 1). PFS was determined on the basis of RANO criteria32, and the OS and PFS of patients with recurrent/secondary were calculated from the date of the recurrent/secondary diagnosis.
The tumor histological grades for all patients in this study were determined independently by 2 pathologists. All specimens with > 80% tumor cells were used to determine MGMT promoter methylation by PSQ. The IDH1 R132H and IDH2 R172K/M mutations were determined by whole-exome sequencing or PSQ, as previously reported2,31,33. MGMT mRNA expression data were obtained by RNA sequencing with the Illumina HiSeq 2000 platform (Illumina, San Diego, CA, USA) as previously reported31,34,35.
Ethical approval
This study was approved by the Beijing Tiantan Hospital institutional review board (Approval No. KY2014-002-02).All patients in this study were enrolled in the CGGA program (KY2014-002-02), and informed consent was obtained from each patient involved in our research.
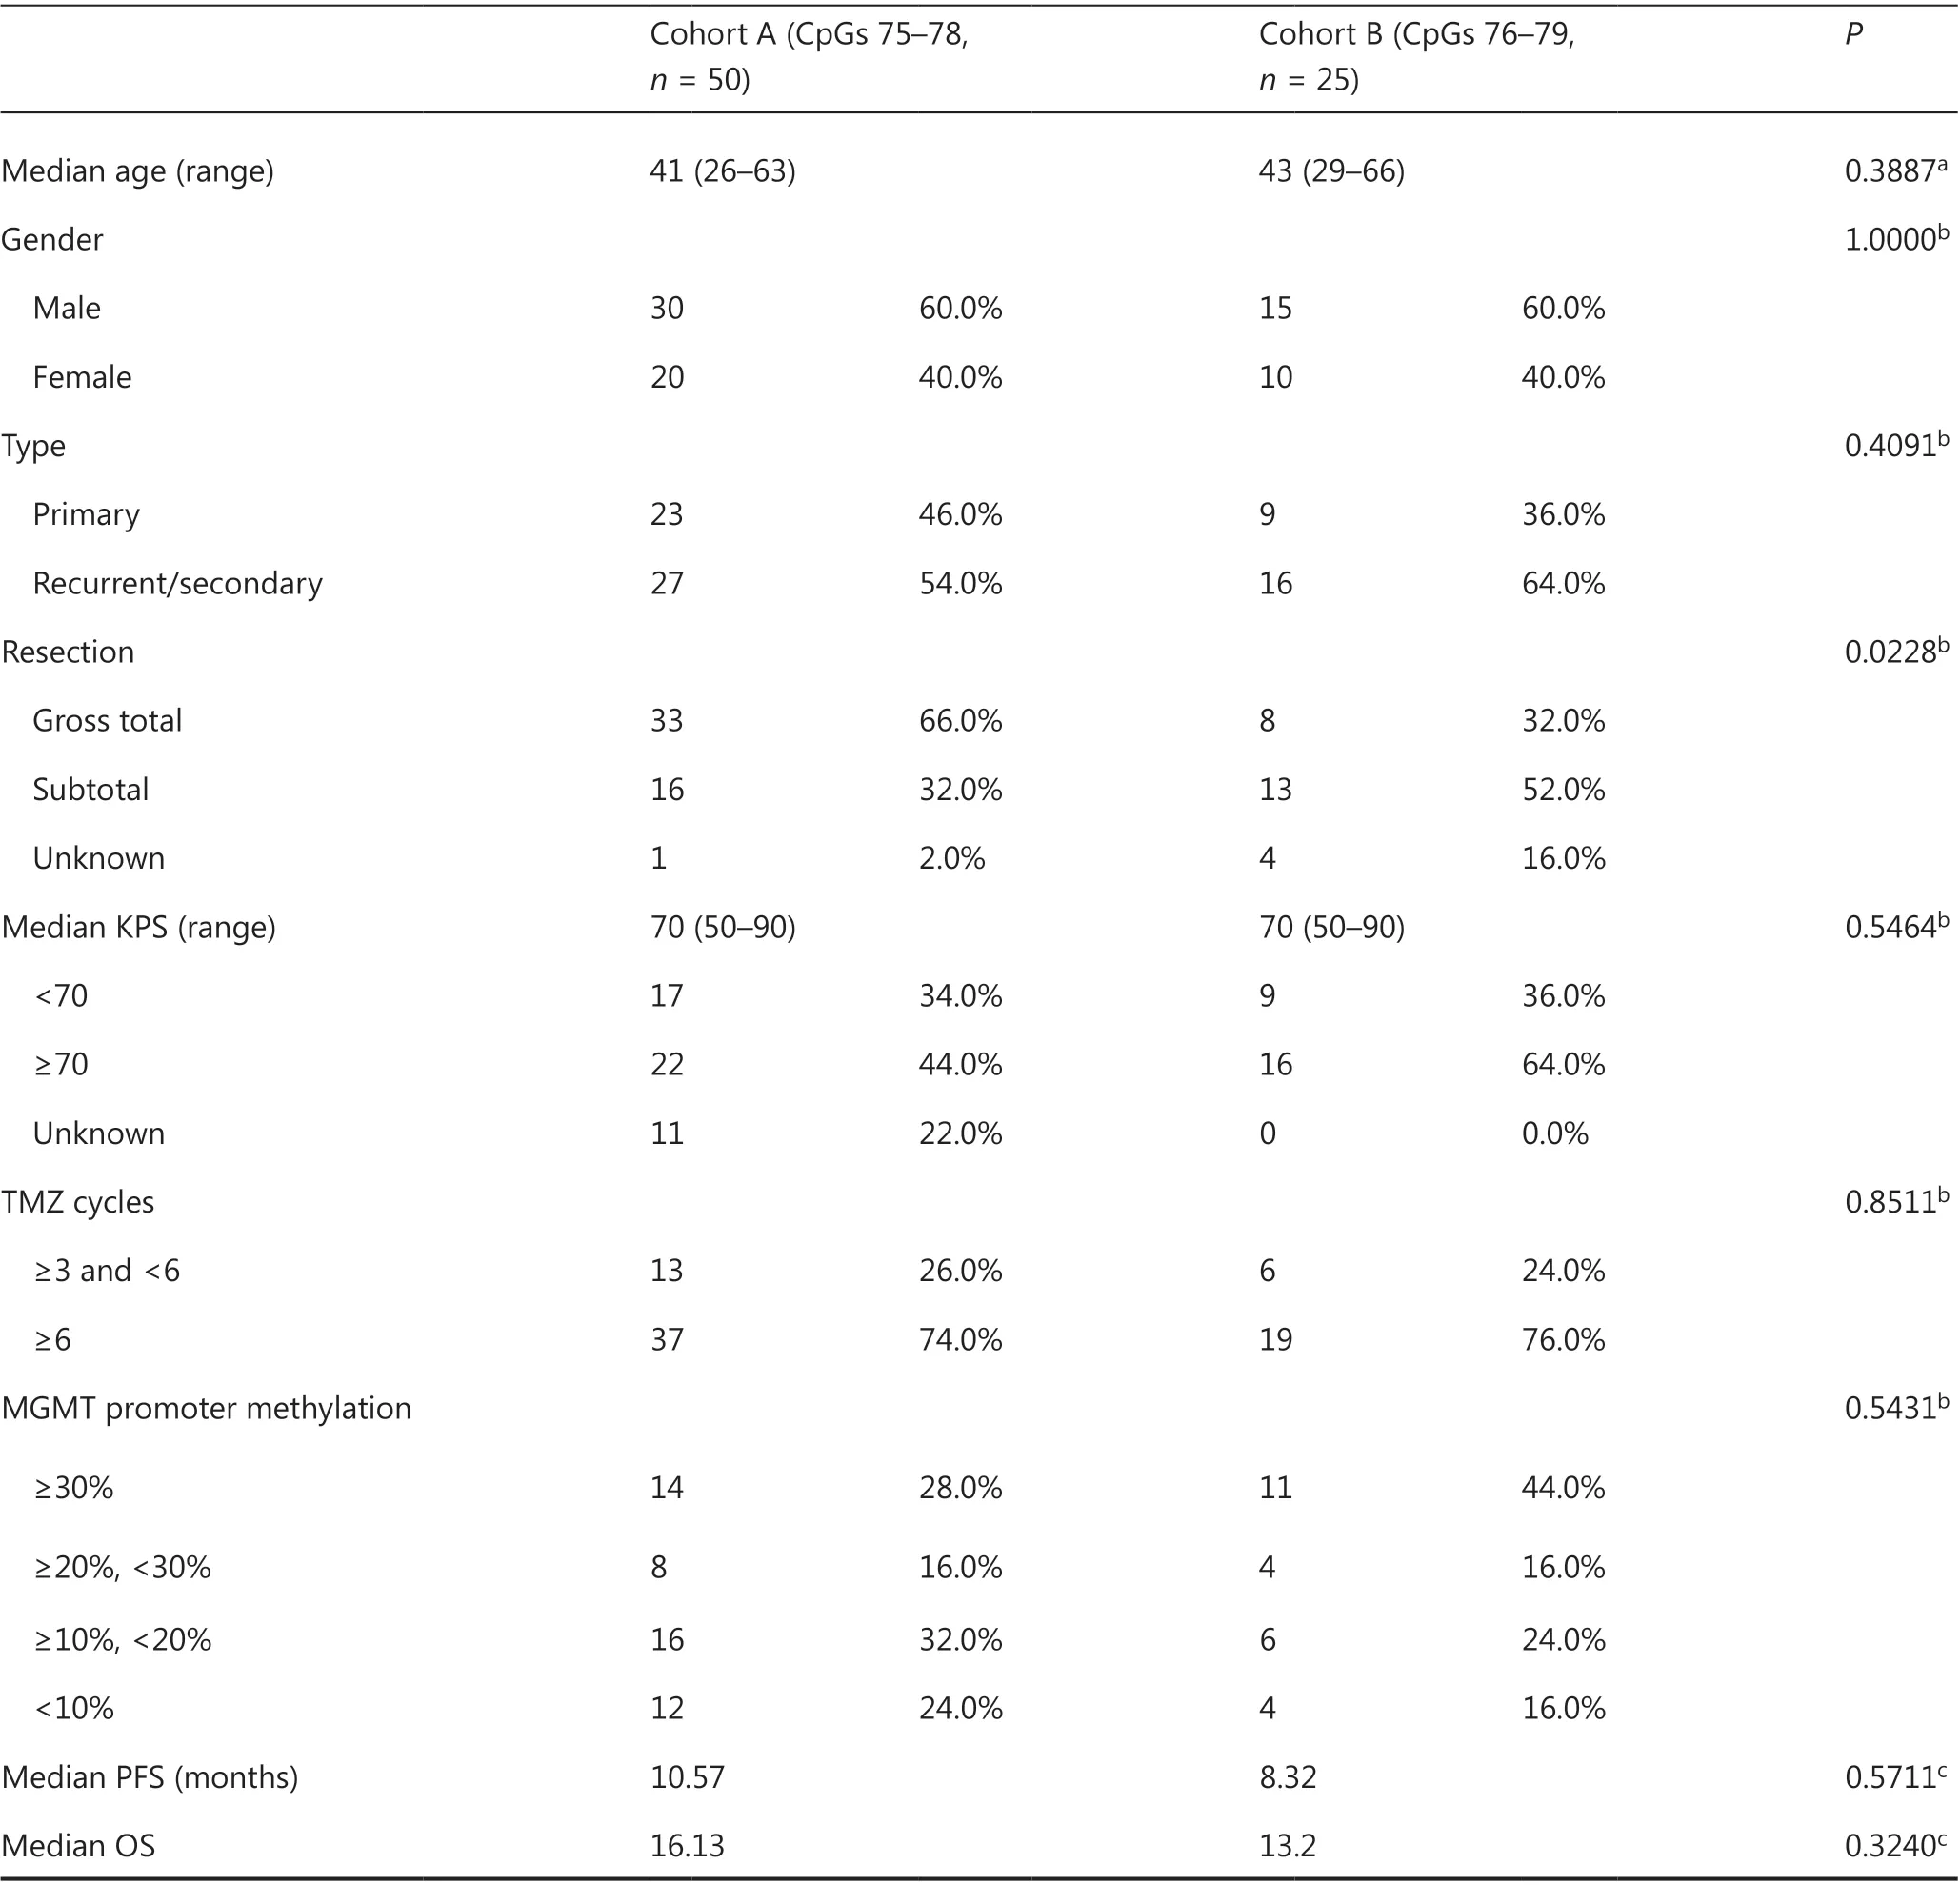
Table 1 Characteristics of IDH-mutant patients with GBM used in survival analysis
Pyrosequencing of MGMT promoter methylation
The PSQ testing of MGMT promoter methylation was performed as previously reported2. Briefly, DNA was extracted in formalin-fixed paraffin-embedded samples with a QIAamp DNA FFPE Tissue Kit (Qiagen, Hilden, Germany). Then 100 ng DNA was bisulfite converted with an Epitect Bisulfite kit (Qiagen, Hilden, Germany) according to the manufacturer’s protocol. The bisulfite-treated DNA was amplified and then sequenced by PSQ. The amplification primers were the forward primer 5′-GTT TYG GAT ATG TTG GGA TAG TT-3′ and the biotinylated reverse primer 5′-biotin-ACR ACC CAA ACA CTC ACC AA-3′. The methylation levels of CpG sites 75-78 were obtained with the PSQ sequencing primers 5′-GAT ATG TTG GGA TAG T-3′ or 5′-GTT TTT AGA AYG TTT TG-3′. The methylation levels of CpG sites 76-79 were detected with a commercial MGMT PSQ kit (Qiagen, Hilden, Germany) with a PyroMark Q24 System (Qiagen, Hilden, Germany). Standardized positive and negative controls were included in all routine PSQ testing, and every PSQ test was performed by 2 experienced molecular neuropathologists together.
Statistical analysis
Statistical analysis was performed in GraphPad Prism 7 (GraphPad Software, California, USA) and SPSS (IBM, NY, USA). A P-value of less than 0.05 was considered significant in this study. A nonparametric test was used to compare the age distribution between the 2 subgroups; two-tailed Student’s t-test was used to compare the MGMT mRNA expression between the 2 subgroups; and χ2tests were used to compare the distribution of MGMT promoter methylation statuses and other clinicopathological features. The Kaplan-Meier method with log-rank test was used to compare the PFS and OS of patients in different subgroups. Univariate and multivariate survival analyses were performed with the Cox regression model to study the survival associations of different candidate factors.
Results
Cases and clinical features
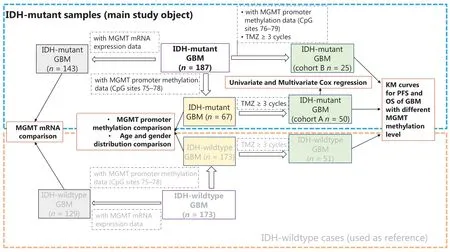
Figure 1 The workflow and sample selection criteria of this study.
The clinical implications of MGMT promoter methylation have been extensively studied in IDH-wildtype or IDHheterogeneous cohorts. Therefore, we mainly focused on IDH-mutant cases and used IDH-wildtype cases as a comparison reference (Figure 1). A group of IDH-mutant GBM cases (n = 75) with methylation information from MGMT promoter CpG sites 75-78 was selected and compared with IDH-wildtype GBM cases (n = 173) for MGMT promoter methylation, age, and gender distribution. Among these 75 IDH-mutant cases, a group of cases (n = 50) receiving at least 3 cycles of TMZ treatment was used as cohort A to study the predictive value of MGMT promoter methylation levels in IDH-mutant GBM, and a group of IDH-wildtype cases (n = 99) was used as a comparison reference. Next, another cohort (cohort B) of 25 IDH-mutant cases receiving at least 3 cycles of TMZ, for which methylation information for MGMT promoter CpG sites 76-79 was available, was selected to validate the predictive value of MGMT promoter methylation. The clinical characteristics of cohorts A and B are summarized and compared in Table 1. Moreover, we compared the MGMT mRNA expression levels between IDH-mutant (n = 143) and IDH-wildtype (n = 129) cases. The clinical characteristics of all cases in this study are summarized in Supplementary Table S1.
The effects of IDH mutation on MGMT promoter methylation in GBM
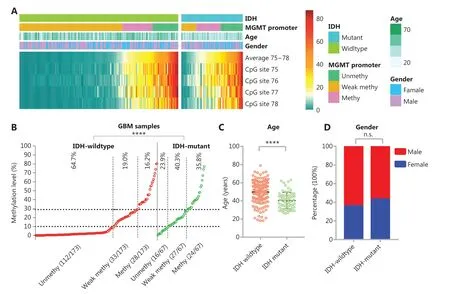
Figure 2 The effect of IDH mutation on MGMT promoter methylation in GBM. (A) Heatmap showing the methylation levels of CpG sites 75-78 in the MGMT promoter in GBM samples with different IDH mutant status. For the MGMT promoter, the average methylation level of CpG sites 75-78 is denoted unmethy (unmethylated), <10%; weak methy (methylated), ≥10% and <30%; or methy, ≥30%. (B) The distribution of average methylation levels of CpG sites 75-78 was compared between IDH-wildtype and IDH-mutant GBM. ****P < 0.0001 calculated by the chi-square test. (C) The age of IDH-wildtype and IDH-mutant patients with GBM was compared. ****P < 0.0001 calculated by the nonparametric test. (D) The gender distribution was compared between IDH-wildtype and IDH-mutant patients with GBM.
The methylation levels of CpG sites 75-78 are presented as a heatmap for IDH-wildtype and IDH-mutant GBM cases (Figure 2A). For IDH-wildtype GBM, a cutoff of ≥10% is usually used to define a “methylated” or “unmethylated” MGMT promoter according to the average methylation level, and a cutoff ≥30% is recommended to stratify a “weakly methylated” vs “methylated” promoters28,31. In our cohorts, we also observed that the OS and FPS of cases in the “weakly methylated” (≥10%, <30%) group differed from that of cases in the “unmethylated” (<10%) and “methylated” (≥30%) groups (Supplementary Figure S1). Thus, we divided the MGMT promoter methylation status into 3 levels in the heatmap: “unmethylated,” “weakly methylated,” and “methylated.” The proportion of unmethylated MGMT promoter cases in IDH-mutant GBM was significantly lower (23.9% vs. 64.7%) than that in IDH-wildtype GBM, whereas the proportion of methylated MGMT promoter cases in IDH-mutant GBM (35.8%) was similar to the sum of the proportions of weakly methylated and methylated MGMT promoter cases for IDH-wildtype GBM (35.2%) (Figure 2B). In agreement with the literature10,13, the patients with IDH-mutant GBM were significantly younger at diagnosis than IDH-wildtype patients with GBM at diagnosis (Figure 2C). There was no difference in the gender distributions of patients with IDH-mutant GBM and IDHwildtype GBM (Figure 2D).
MGMT promoter methylation is negatively correlated with MGMT mRNA expression in IDH-wildtype or IDHheterogeneous cases30,31,36. We also found that the expression of MGMT mRNA in IDH-mutant GBM (n = 143) was significantly lower (P < 0.0001) than that of IDH-wildtype GBM (n = 129) (Supplementary Figure S2A and S2B). In addition, we observed a negative correlation between MGMT mRNA expression and MGMT promoter methylation (averaged over CpG sites 75-78) in 41 IDH-mutant GBM cases, and significantly lower expression of MGMT mRNA in cases with higher (≥30%) MGMT promoter methylation (Supplementary Figure S3).
The predictive value of MGMT promoter methylation in TMZ-treated IDH-mutant GBM
We used Kaplan-Meier curves to compare the PFS and OS of TMZ-treated IDH-mutant patients with GBM with different methylation levels: <10%, ≥10% and <20%, ≥20% and <30%, and ≥30% (Figure 3A and 3B). The median PFS in months was 8.05 (<10%), 9.33 (≥10% and <20%), 11.00 (≥20% and <30%), and 18.37 (≥30%) (Figure 3A). The median OS in months was 12.43 (<10%), 11.80 (≥10% and <20%), 19.50 (≥20% and <30%), and 41.30 (≥30%) (Figure 3B). We also compared the PFS and OS of patients stratified by different cutoff values: ≥10%, ≥20%, and ≥30% (Figure 3C and 3D). Although these cutoff values were able to stratify the OS and PFS of patients, the methylation status determined by a single high cutoff value (≥30%) had the best ability to stratify both PFS and OS. With this cutoff, the PFS of methylated cases (≥30%) was significantly longer, at 18.37 months (P = 0.0024) than that of the unmethylated group (<30%), at 9.33 months; in addition, the OS of methylated cases, at 41.62 months, was significantly longer (P = 0.0007) than that of the unmethylated cases, at 13.77 months.
We also analyzed the PFS and OS in different groups of TMZ-treated IDH-wildtype GBM samples (Figure 3E and 3F). The median PFS in months was 10.00, 19.03, 16.76, and 12.43 months for methylation levels <10%, 10%-20%, 20%-30%, and >30%, respectively. The median OS in months was 14.97, 23.20, 22.63, and 28.00 for methylation levels <10%, 10%-20%, 20%-30%, and >30%, respectively. These results differed from those in IDH-mutant GBM cases, and the survival of patients was similar among different groups with methylation ≥10%. None of the cutoff values (≥10%, ≥20%, and ≥30%) stratified the PFS of patients (Figure 3G), and the cutoff ≥10% showed the lowest P value (P = 0.1397). A cutoff of ≥10% and ≥20% but not ≥30% significantly stratified the OS of patients, and a cutoff ≥10% showed a lower P value (P = 0.0346 vs. 0.0393) (Figure 3H).
The above findings suggested that MGMT promoter methylation has predictive value for both IDH-mutant and IDHwildtype GBM cases, but the optimal cutoff value for IDHmutant GBM is higher than that for IDH-wildtype GBM. To determine whether the MGMT promoter status (determined by cutoff ≥30%) might correlated with other clinical features in IDH-mutant GBM, we compared the clinical features between cases with or without MGMT promoter methylation in cohort A. No significant difference was observed between unmethylated and methylated cases in terms of age, gender distribution, tumor type (primary or recurrent/secondary), extent of resection, KPS scores, or TMZ cycles (Table 2). Univariate and multivariate Cox regression analyses were performed to determine whether the methylation status with a cutoff ≥30% was independently associated with the OS of IDH-mutant GBM cases in cohort A. Univariate Cox analysis indicated that MGMT promoter methylation status [unmethylated vs. methylated, P = 0.001, HR (hazard ratio) = 3.691 (1.689-8.063)] and tumor type [primary vs. recurrent/secondary, P = 0.005, HR = 0.366 (0.182-0.733)], but not age, gender, or extent of resection, significantly correlated with OS (Table 3). In the multivariate Cox analysis, MGMT promoter methylation status [unmethylated vs. methylated, P = 0.002, HR = 3.560 (1.600-7.920)] and tumor type [primary vs. recurrent/secondary, P = 0.010, HR = 0.384 (0.186-0.794)] remained significantly correlated with OS (Table 3).
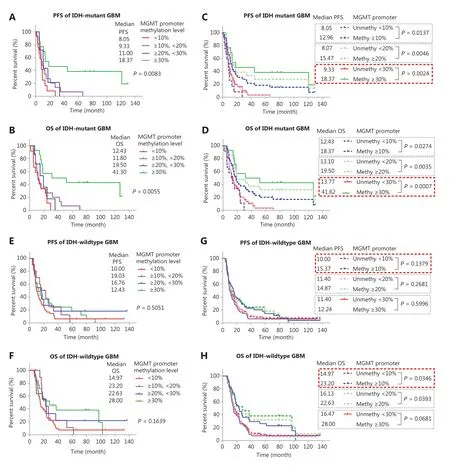
Figure 3 Survival analysis of IDH-mutant GBM with different MGMT promoter methylation levels. (A, B) Kaplan-Meier curves for PFS and OS of IDH-mutant patients with GBM in different methylation groups. (C, D) Kaplan-Meier curves for PFS and OS of IDH-mutant patients with GBM stratified by different cutoff values. (E, F) Kaplan-Meier curves for PFS and OS of IDH-wildtype patients with GBM in different methylation groups. (G, H) Kaplan-Meier curves for PFS and OS of IDH-wildtype patients with GBM stratified by different cutoff values. P-value calculated by the log-rank test. MGMT promoter methylation levels were calculated on the basis of the average methylation levels of CpG sites 75-78.
Therefore, we further analyzed the predictive value of MGMT promoter methylation status (cutoff ≥30%) in primary and recurrent/secondary GBM cases. The results revealed that MGMT promoter methylation significantly stratified PFS and OS in both the primary (Supplementary Figure S4A and S4B) and recurrent/secondary (Supplementary Figure S4C and S4D) GBM cases. In the primary IDH-mutant GBM cases, the median PFS in months was 14.90 (unmethylated, <30%) and 82.90 (methylated, ≥30%), and the median OS in months was 19.50 (unmethylated, <30%) and 127.10 (methylated, ≥30%). In the recurrent/secondary cases, the median PFS in months was 7.17 (unmethylated, <30%) and 13.40 (methylated, ≥30%), and the median OS in months was 10.64 (unmethylated, <30%) and 18.43 (methylated, ≥30%). These findings suggest that the predictive value of MGMT methylation status is independent of age, gender, extent of resection,and tumor type (primary or recurrent/secondary) in IDHmutant GBM.
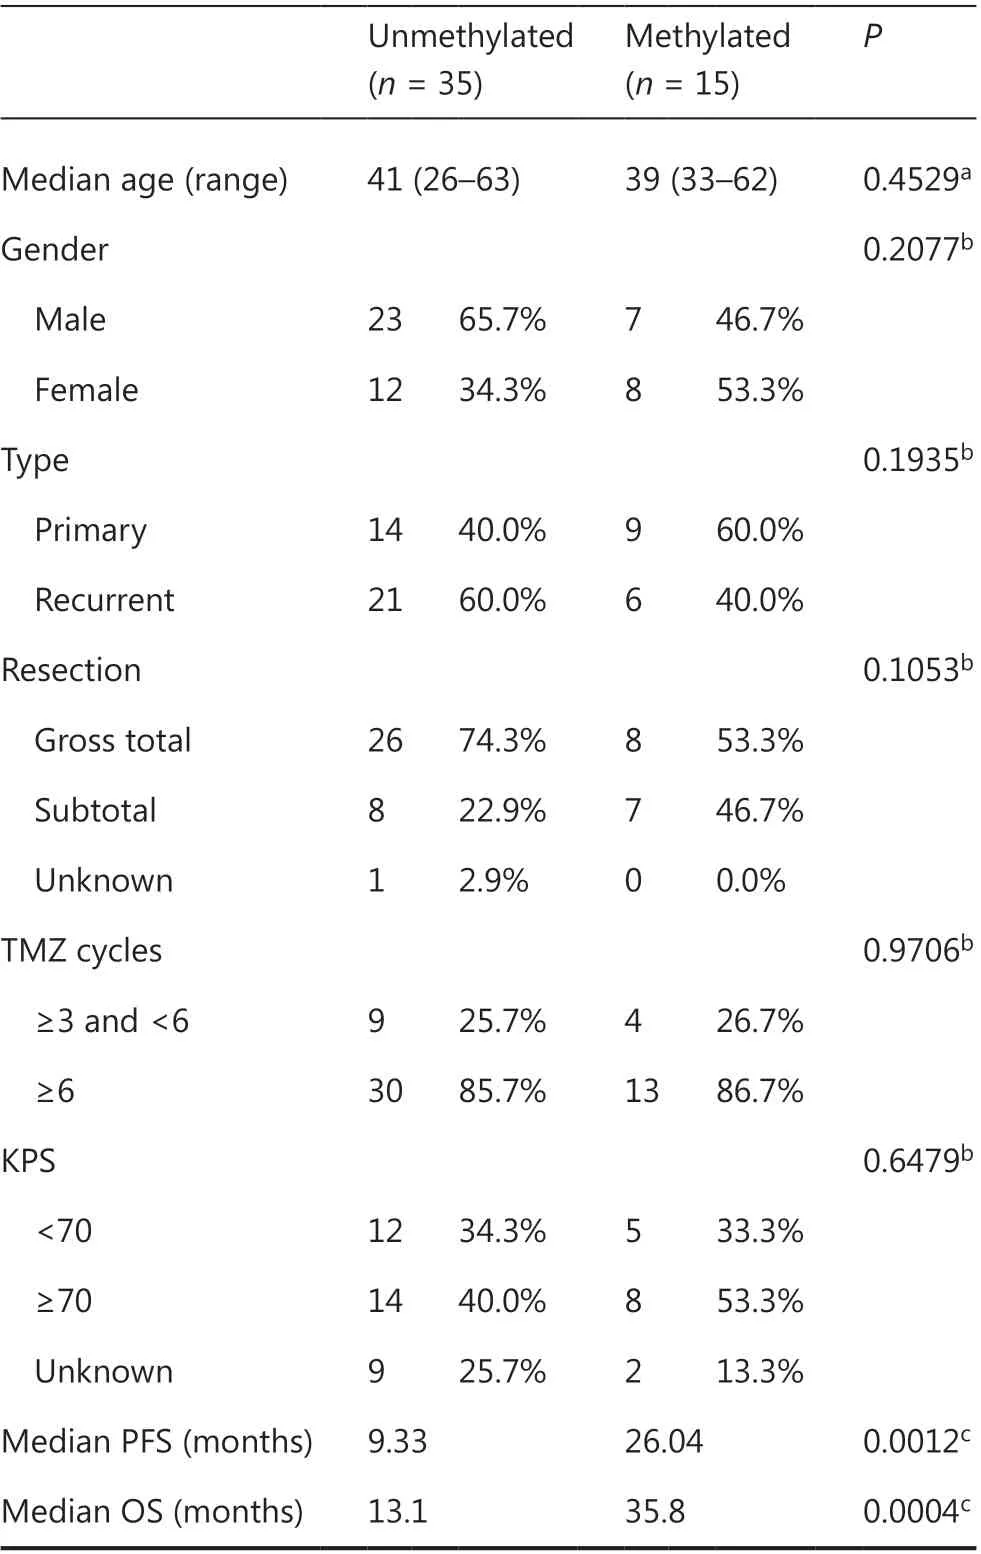
Table 2 Comparison of characteristics of IDH-mutant GBM samples with or without MGMT methylation (cutoff ≥30%) in cohort A
Validation of the predictive value of MGMT promoter methylation in another cohort of IDH-mutant GBM cases
We sought to validate the predictive value of MGMT promoter methylation in IDH-mutant GBM as well as the use of a higher MGMT promoter methylation cutoff value (such as ≥30%) for IDH-mutant GBM. We further compared PFS and OS in different groups in another 25 IDH-mutant GBM cases diagnosed after June 2016, with the MGMT promoter methylation levels calculated by using CpG sites 76-79 (cohort B) (Figure 4). The median PFS of cases with methylation ≥30% was 23.40 months, which was significantly longer than that in other groups: 7.05 (<10%), 8.53 (≥10% and <20%), and 5.77 (≥20% and <30%) (Figure 4A). Only the methylation status determined by a high cutoff value (≥30%) significantly stratified (P = 0.0261) the PFS of patients (Figure 4B), possibly because of the limited number of cases in cohort B. A similar result was observed in the OS of patients: the median OS in months was 8.57 (<10%), 12.03 (≥10% and <20%), 5.77 (≥20% and <30%), and 23.40 (≥30%). Only the methylation status determined by a high cutoff value (≥30%) significantly stratified (P = 0.0065) the OS of patients (Figure 4C and 4D).
Discussion
MGMT promoter methylation is widely used a biomarker to predict which patients with GBM will benefit from TMZtreatment5,25,29,37-39. According to the most recent WHO classification, GBM should be further classified as IDH-wildtype or IDH-mutant GBM, which have different genetic, epigenetic, and transcriptional characteristics6,9,14,40. In this study, we further confirmed that, compared with IDH-wildtype GBM cases, IDH-mutant GBM cases showed significantly higher MGMT promoter methylation but significantly lower MGMT mRNA expression. This finding is consistent with previous reports indicating that most IDH-mutant GBM cases are MGMT promoter methylated, according to the commonly used cutoff value for IDH-wildtype GBM23,30. Therefore, we showed that the extent of MGMT promoter methylation also had predictive value in IDH-mutant GBM receiving TMZ therapy, and that the optimal cutoff value of MGMT promoter methylation should be dramatically higher than that used for IDH-wildtype cases.

Table 3 Univariate and multivariate Cox regression analysis in cohort A
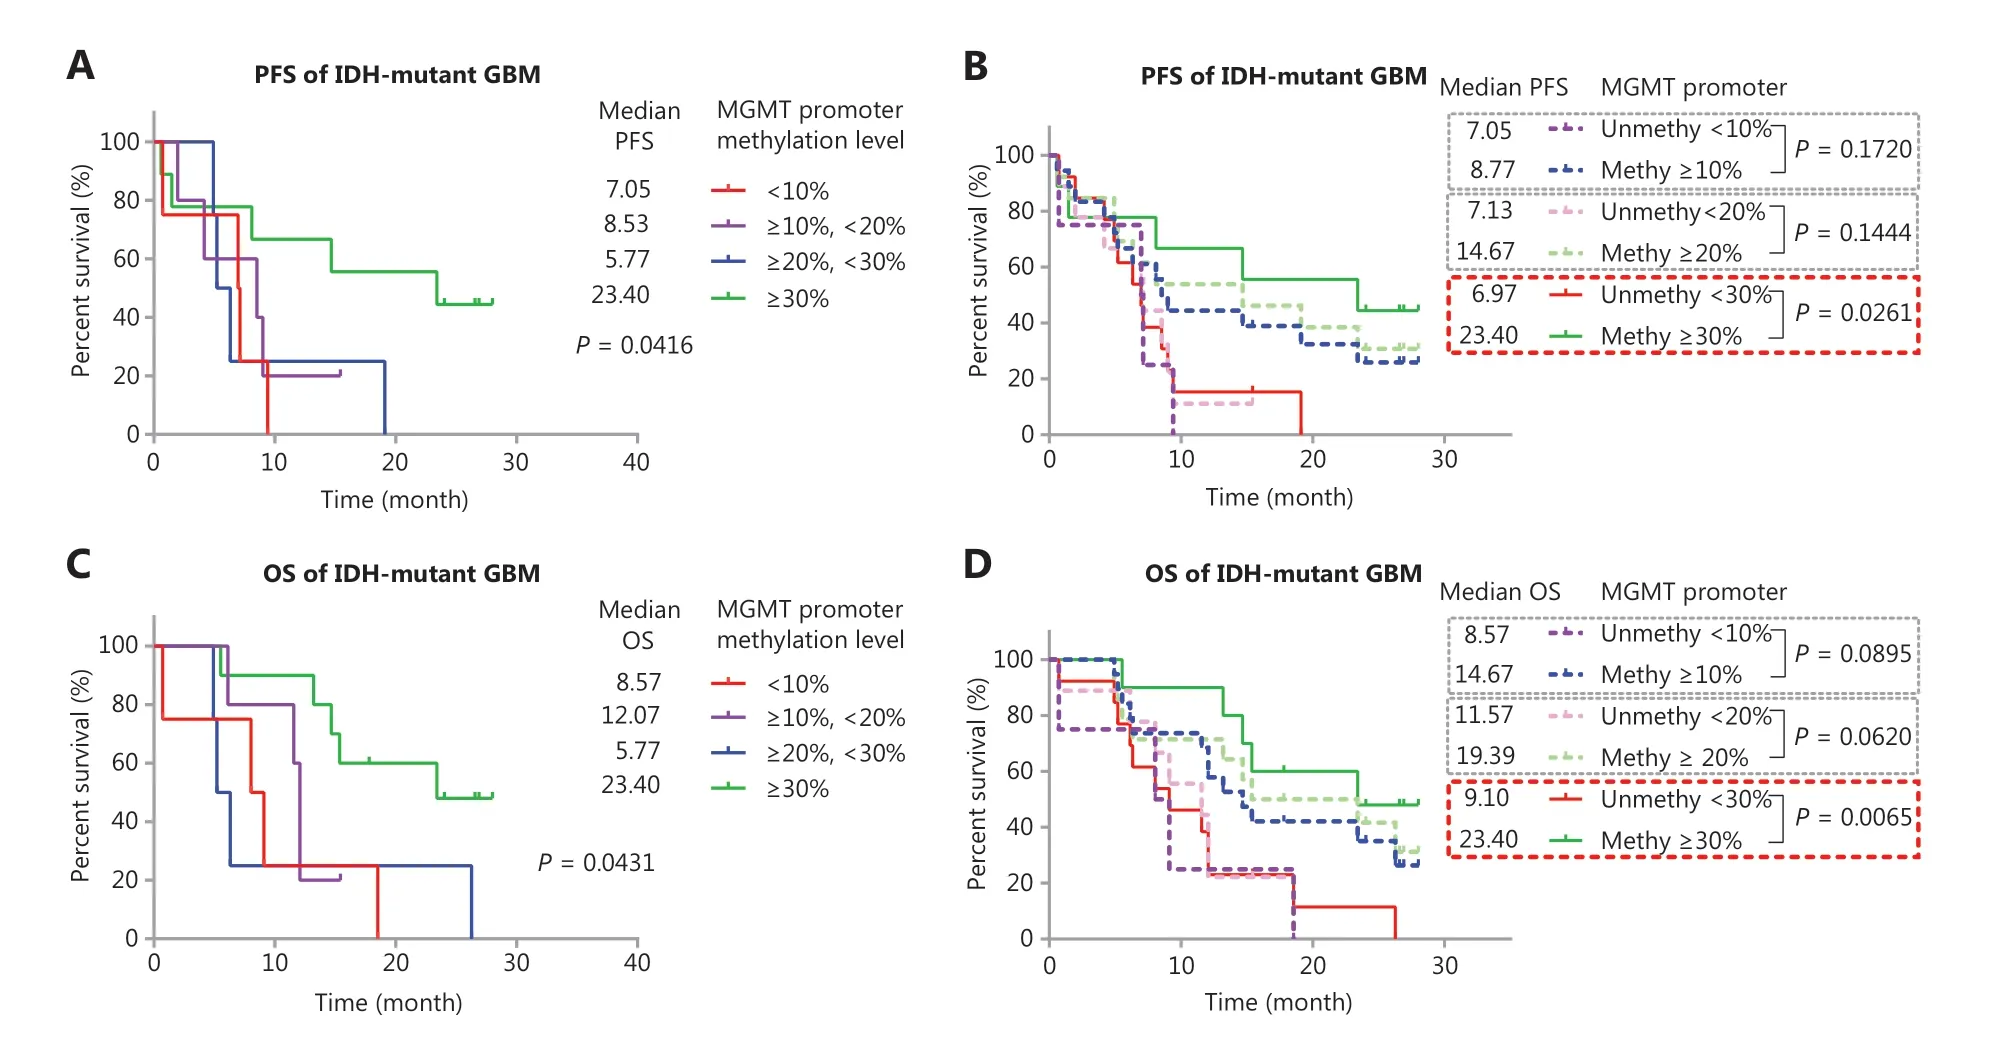
Figure 4 Validation of the predictive value of MGMT promoter methylation in another cohort of TMZ treated IDH-mutant GBM. (A) Kaplan-Meier curves for PFS of IDH-mutant patients with GBM in different methylation groups. (B) Kaplan-Meier curves for PFS of IDH-mutant patients with GBM, stratified by different cutoff values. (C) Kaplan-Meier curves for OS of IDH-mutant patients with GBM in different methylation groups. (D) Kaplan-Meier curves for OS of IDH-mutant patients with GBM, stratified by different cutoff values. P-value calculated by the log-rank test. MGMT promoter methylation levels were calculated on the basis of the average methylation levels of CpG sites 76-79.
The effect of IDH mutation on methylation of the MGMT promoter has been shown in LGG, and the methylation level of the MGMT promoter is significantly elevated in IDH-mutant LGG30. Here, we also demonstrated an elevation in MGMT methylation levels in IDH-mutant GBM cases. A previous study has reported that IDH-mutant status and MGMT promoter methylation status appear to be gender related, and that the methylated MGMT promoter is found more frequently in females, whereas IDH mutation is more often detected in males41. In the cohorts in this study, there was no significant difference in the gender distribution between IDH-mutant and IDH-wildtype GBM cases, thus suggesting that the differential methylation levels of MGMT promoters were indeed caused by different IDH-mutant statuses.
The methylation status of the MGMT promoter is widely classified as “methylated” or “unmethylated” through gel-based methylation-specific polymerase chain reaction or quantitative methods with determined cutoff values26. Scientific community consensus is lacking regarding how to determine the cutoff values for the quantitative detection methods of MGMT promoter methylation, including PSQ, semi-quantitative methylation-specific polymerase chain reaction, and methylation chip assay3,24,26,28. There are 98 CpG sites in the MGMT promoter region, and the methylation levels of CpG sites 72-90, localized in exon 1 and the subsequent intron 1, are thought to be most negatively correlated with MGMT expression42. We have reported that combinations of methylation at 4 or more CpG sites have equivalent predictive value for MGMT expression in gliomas and TMZ therapy response in GBM31. The high heterogeneity of each CpG site and the different principles of each test method yielding cutoff values should be determined and validated in different assays3,29. However, the use of a single invariant cutoff value is increasingly challenged in the quantitative detection of MGMT methylation, and determining “unmethylated” status and a potential “grey zone” through 2 cutoff values has been suggested3,27-29. Here, to study the predictive value of MGMT promoter methylation in IDH-mutant GBM more objectively, we also divided the cases into 3 methylation groups according to 2 reported cutoff values in GBM. We observed an overlap between the survival curves of cases with weakly methylated (10%-30%) and unmethylated (<10%) MGMT promoter in IDH-wildtype GBM. For IDH-mutant GBM, we found that ≥30% is a feasible cutoff for PSQ testing of MGMT promoter methylation, and we validated the predictive value in another cohort with different CpG sites tested. However, the determination of the optimal cutoff value and whether a “gray zone” interval exists remains to be determined in the future through study of a larger number of samples.
The predictive value of MGMT promoter methylation for the response to TMZ treatment could also be affected by other molecular characteristics, including chromosome variation, DNA alterations, RNA expression profiles, and even the immune microenvironment15,34,43-48. Recently, the critical role of noncoding RNA in regulating MGMT expression and TMZ-sensitivity has also been revealed43,44. Given the different molecular and RNA expression features existing among various subtypes of gliomas, the predictive value of MGMT promoter methylation in other types of glioma remains controversial, possibly because the cutoff value used in IDHwildtype GBM has also been used to assess the role of MGMT promoter methylation in other types of glioma25,26,30,38,49. In either PSQ or methylation chip assays, the MGMT promoters of most IDH mutant adult LGGs are interpreted as methylated on the basis of the cutoff value used for GBM (with most IDH-wildtype cases)23,38,49. We believe that specific cutoff values should be determined for each homogeneous glioma group, because the molecular characteristics of glioma differ in different pathological groups1,6,9,14. In a retrospective study of EORTC-22033 randomized phase III trial samples, MGMT promoter methylation was revealed to have predictive value in IDH-mutant grade II glioma treated with TMZ, but the cutoff value used in that study was dramatically higher than that commonly used in IDH-wildtype GBM30. Here, we also found that the cutoff of ≥10%, which is commonly used in IDHwildtype GBM PSQ testing, was not suitable for IDH-mutant GBM, probably as a consequence of the differing molecular features, such as chromosome 10 loss, between IDH-mutant and IDH-wildtype GBM2,29.
Initially, the predictive value of MGMT promoter methylation was focused on primary GBM cases. Recently, a study with a large cohort of matched primary and recurrent IDH-wildtype GBM has shown that MGMT promoter methylation status differs between primary and recurrent tumors, and MGMT methylation status remains predictive for TMZ response in tumor recurrence37. Because of the low frequency of IDHmutant GBM, whether the methylation characteristic of recurrent/secondary IDH-mutant GBM could be classified into the same group as primary IDH-mutant GBM is unclear50. We included both primary and recurrent/secondary IDH-mutant GBM in our cohort, and we demonstrated the predictive value of MGMT promoter methylation in both. In addition, multivariate Cox regression confirmed the independent association between MGMT promoter methylation status and OS of IDHmutant patients with GBM treated by TMZ. These findings support the need to re-test MGMT promoter methylation status in recurrent/secondary IDH-mutant GBM.
Because this was a retrospective study with cases from a single center, some limitations restrict the interpretation of our data. Nevertheless, we characterized the predictive value of MGMT promoter methylation in a relatively large number of IDHmutant GBM cases whose clinical features are well documented.
Conclusions
In conclusion, we demonstrate that the extent of MGMT promoter methylation has predictive value in both primary and recurrent/secondary IDH mutant GBM. We also recommend the use of higher cutoff value, such as ≥30% in PSQ testing, to interpret MGMT promoter methylation results in IDHmutant GBM.
Acknowledgments
The authors acknowledge all members of the CGGA network for their contributions.
Grant support
This study was funded by the National Natural Science Foundation of China (Grant Nos. 81903078 and 81773208), the Beijing Nova Program (Grant No. Z201100006820118), the National Key Research and Development Program of China (Grant No. 2018YFC0115604), the National Natural Science Foundation of China (NSFC)/Research Grants Council (RGC) Joint Research Scheme (Grant No. 81761168038), the Beijing Municipal Administration of Hospitals’ Mission Plan (Grant No. SML20180501), the CAMS Innovation Fund for Medical Sciences (Grant No. 2019-I2M-5-021), and the Public Welfare Development and Reform Pilot Project of the Beijing Medical Research Institute (Grant No. JYY 2019-5).
Conflict of interest statement
No potential conflicts of interest are disclosed.
杂志排行
Cancer Biology & Medicine的其它文章
- Competing endogenous RNAs in lung cancer
- The role and its mechanism of intermittent fasting in tumors: friend or foe?
- Association of systemic inflammation and body mass index with survival in patients with resectable gastric or gastroesophageal junction adenocarcinomas
- Exosome-mediated cellular crosstalk within the tumor microenvironment upon irradiation
- Patient-derived non-small cell lung cancer xenograft mirrors complex tumor heterogeneity
- BYSL contributes to tumor growth by cooperating with the mTORC2 complex in gliomas
