Regulating Electron Transport Band Gaps of Bovine Serum Albumin by Binding Hemin
2021-04-02ChuanliWuWenhuiLiangJingjingFanYuxianCaoPingWuChenxinCai
Chuanli Wu , Wenhui Liang , Jingjing Fan , Yuxian Cao , Ping Wu , Chenxin Cai ,*
1 Jiangsu Key Laboratory of New Power Batteries, Jiangsu Collaborative Innovation Center of Biomedical Functional Materials,College of Chemistry and Materials Science, Nanjing Normal University, Nanjing 210023, China.
2 College of Education, Nanjing Normal University, Nanjing 210023, China.
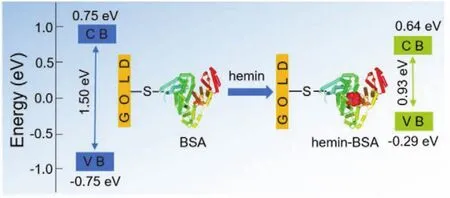
Abstract: The small size (nanoscale) of proteins and their favorable electron transport (ETp) properties make them suitable for various types of bioelectronic devices and offer a solution for miniaturizing these devices to nanoscale dimensions.The performance of protein-based devices is predominantly affected by the ETp property of the proteins,which is largely determined by the band gaps of the proteins, i.e., the energy difference between the conduction band (CB) and valence band (VB).Regulating the protein ETp band gaps to appropriate values is experimentally demanding and hence remains a significant challenge.This study reports a facile method for modulating the ETp band gaps of bovine serum albumin (BSA), via its binding with a foreign molecule, hemin.The formation of the hemin-BSA complex was initially confirmed by theoretical simulation (molecular docking) and experimental characterization(fluorescence and absorption spectra), which indicated that the hemin is positioned inside a hydrophobic cavity formed by hydrophobic amino acid residues and near Trp213, at subdomain IIA of BSA, with no significant effects on the structure of BSA.Circular dichroism (CD) spectra indicated that the BSA conformation remains essentially unaltered following the formation of the hemin-BSA complex, as the helicities of the free BSA (non-binding) and the hemin-BSA complex were estimated to be 66% and 65%, respectively.Moreover, this structural conformation remains preserved after the hemin-BSA complex is immobilized on the Au substrate surface.The hemin-BSA complex is immobilized onto the Au substrate surface along a single orientation, via the -SH group of Cys34 on the protein surface.Atomic force microscopy (AFM) images indicate that hemin-BSA forms a dense layer on the surface of the Au substrate with a lateral size of ~3.2-3.7 nm, which is equivalent to the actual size of BSA, ~4.0 nm × 4.0 nm × 14.0 nm.The current-voltage (I-V) responses were measured using eutectic gallium-indium (EGaIn) as the top electrode and an Au film as the substrate electrode, revealing that the ETp processes of BSA and hemin-BSA on the Au surface have distinct semiconducting characteristics.The CB and VB were estimated by analysis of the differential conductance spectra, and for the free BSA, they were ~0.75 ± 0.04 and ~-0.75 ± 0.08 eV, respectively, being equally distributed around the Fermi level (0 eV), with a band gap of ~1.50 ± 0.05 eV.Following hemin binding, the CB (~0.64 ± 0.06 eV) and VB (~ -0.29 ± 0.07 eV) of the protein were closer to the Fermi level, resulting in a band gap of ~0.93 ± 0.05 eV.These results demonstrated that hemin molecules can effectively regulate ETp characteristics and the transport band gap of BSA.This methodology may provide a general approach for tuning protein ETp band gaps, enabling broad variability by the preselection of binding molecules.The protein and foreign molecule complex may further serve as a suitable material for configuring nanoscale solid-state bioelectronic devices.
Key Words: Protein electron transport; Protein-based electronic device; Bovine serum albumin; Hemin
1 Introduction
The use of protein molecules as electronic components offers a solution to miniaturize electronic devices to nanoscale dimensions, which is essential for the future of the electronics industry because these types of circuits would have the benefits of reduced energy consumption and enhanced device speed and functionality1-5.The small size (nano-scale) of proteins and their effective electron transport (ETp) make them suitable for many types of bioelectronic devices1,6-8, including biosensors for biological molecule monitoring8-15, biomolecular transistors for data storage16, and biofuel cells for microscale implantable17,18.The properties of these devices are mainly affected by the ETp performance of the protein, which is largely determined by the protein’s band gaps,i.e., the energy difference between the conduction band (CB) and valence band (VB).From a practical and theoretical point of view, it is necessary to adjust the protein ETp band gaps to appropriate values to improve the performance of protein-related electronic devices and expand their application fields.
Although each protein has an inherent ETp and characteristic band gap, they can still be regulated to some extent by changing parameters that modulate ETp of the proteins, such as the conformational structure and core compositions.Sheves and Cahenetal.reported that the ETp of human serum albumin(HSA) is improved by noncovalently binding of retinoate19and hemin20.Richter and Cohenetal.21,22showed that the addition of a C60molecule can change the gate voltage of BSA-transistors.However, these groups did not explore how the ETp band gap of proteins changes after binding with foreign molecules.We studied the regulation of protein (enzyme) conformation to regulate the ETp characteristics of glucose oxidase and myoglobin23,24.However, the band gap and ETp features of these denatured proteins are not reflective of the intrinsic properties of the proteins.Mukhopadhyay and coworkers regulated the band gaps of the ferritin protein from ~0 to 1.17 V by replacing natural iron cores with other metal cores such as Mn, Cu, Ni, Co, and Zn25,26.Although core reconstitution methods can preserve the native conformation of proteins, they require complicated procedures for operation.Therefore, it is necessary to study a method for regulating the characteristics of ETp and to adjust the band gap of protein easily and conveniently.
Our previous work demonstrated that the ETp band gap of BSA was reduced by noncovalently binding it with cyanocobalamin (Vb12)27.However, the Vb12-bound BSA was immobilized on the surface of a silicon (111) substrate through the reaction of the -COOH groups of BSA and the -NH2group of the 3-aminopropyl trimethoxysilane (3-APTMS)modified on the Si surface.Because there is a high number of-COOH groups on the BSA surface, located at different positions28, the orientation of the immobilized BSA molecules on the Si surface could not be controlled well, which caused the obtainedI–Vcharacteristics of BSA to be an average of the ETp from different directions.Because protein orientation on the electrode surface plays an important role in ETp4,8,29,30, this effort sought to control the immobilized BSA on the substrate surface with the same orientation through the formation of an Au-S bond between the -SH groups of the cysteines (Cys34)on the BSA molecule and the Au substrate.BSA molecule contains 35 cysteines, however, 34 of them are linked to form 17 S-S bonds embedded in the inner cavity of the protein molecule31and are not available for the formation of Au-S bonds.Cys34 is the only cysteine residue that is located at the surface of the protein and does not participate in a disulfide bridge32.The surface-located Cys34 is favorable for forming an Au-S bond,leading to the protein film formation with controlled orientation.Moreover, we replaced the Hg top electrode with eutectic gallium-indium (EGaIn) to avoid Hg electrode amalgamating with Au film33.The work function of EGaIn (~4.2 eV) is close to that of Hg (~4.5 eV), but EGaIn is nontoxic and does not alloy with Au34.Therefore, the obtainedI–Vfeatures from the EGaIn top electrode and Au substrate electrode can reflect the ETp of BSA at one particular orientation.
2 Experimental
2.1 Preparation and characterization of the hemin-BSA
We chose hemin as the binding molecule.Hemin is the prosthetic group of many porphyrin-containing metalloproteins and serves as an electron sink during electron transfer or redox chemistry mediated by those proteins.Moreover, it also binds noncovalently to HSA35, and the structure of the hemin-HSA complex has been determined by X-ray diffraction36.Based on the structural similarity between HSA and BSA, hemin is also expected to bind BSA.For preparation of the hemin-BSA, BSA(5 μmol·L–1, Sigma-Aldrich) was allowed to interact with hemin(5 μmol·L–1) in phosphate buffer solution (PBS, 10 mmol·L–1,pH 7.4) for more than 4 h.The unbound hemin molecules were removed by dialyzing with 10 kDa cutoff against PBS buffer for at least 48 h to remove these unbound hemin molecules; the PBS buffer was changed every 12 h.The formation of the hemin-BSA was characterized with fluorescence spectra and absorption spectra, which were recorded on a Cary Eclipse fluorescence spectrophotometer (Varian) and a Cary 5000 UV-Vis-NIR spectrometer (Varian), respectively.BSA was excited at 295 nm in order to minimize the contribution from tyrosine.To evaluate the structural and conformational changes of BSA caused by binding with hemin, circular dichroism (CD) measurements were performed on a circular dichroism spectropolarimeter(Chriascan, Applied Photophysics).The Raman spectra of the hemin-BSA complex were measured on a Labram HR 800 microspectrometer (Jobin Yvon, France) with an excitation source of 785 nm and the laser power was 50 mW.All spectra were baseline corrected.
2.2 Immobilization of the hemin-BSA onto gold substrate
To measure theI–Vresponse, the hemin-BSA was immobilized on an Au film substrate surface.For preparation of the Au film substrate, the indium tin oxide (ITO) glass plate (20 mm × 20 mm, Changzhou Best Photoelectronics Technology Co.Ltd., China) were first cleaned by dipping it into a Piranha solution (a mixture of the 30% (volume percentage) H2O2and 70% H2SO4) at 80 ℃ for 30 min (Warning: the Piranha solution reacts strongly with organic compounds and should not be stored in closed containers.It must be handled with extreme caution!) and followed by rinsing with deionized water thoroughly and absolute ethanol in an ultrasonic bath and drying under a steam of nitrogen.Before sputtering Au, a layer of chromium (Cr) was first sputtered on glass slide to promote adhesion of Au (step a, Fig.1).Au film was then sputtered onto the ITO glass surface (step b, Fig.1).The Au and the Cr films had a thickness of 50 and 10 nm, respectively.The freshly prepared Au film surface was cleaned sequentially with deionized water, acetone and then annealed to obtain a relatively flat Au surface.Finally, the Au film substrate was immersed into a hemin-BSA solution (5 μmol·L–1, in a sealed vial) for 6 h for the hemin-BSA immobilization (step c, Fig.1), which proceedsviathe reaction of the -SH of the Cys34 on the surface of BSA and the Au film to form Au-S bonds, yielding a protein layer with a thickness of ~3.2 to 3.7 nm.After that, the hemin-BSA-coated Au substrate was washed thoroughly with distilled water to remove those unbound hemin-BSA molecules.The immobilization processes and the morphology of the protein on the Au surface were observed by atomic force microscopy(AFM) with a Nanoscope IIIa scanning probe microscope(Digital Instruments) in tapping mode (step d, Fig.1).

Fig.1 Illustration of the formation of the Au film on the ITO surface,the immobilization of hemin-BSA on the Au film surface, and configuration of the fabricated device for the I–V measurements.
2.3 I–V response measurements
I–Vresponses were recorded with EGaIn severed as a topcontact electrode using an Autolab PGSTAT302N electrochemical station (Metrohm) at an ambient temperature by employing a two-electrode system in the bias range of -2.5 to+2.5 V (step e, f, Fig.1).The EGaIn tip (the preparation of the EGaIn tip has been depicted in Supporting Information) was putted in contact with the hemin-BSA layer using the micromanipulator.The EGaIn tip converges with its reflection on the surface of the gold substrate indicated their contacts.
3 Results and discussion
Before recording theI–Vresponses, the formation of the hemin-BSA was confirmed.Molecular docking was first performed to theoretically predict the possibility of BSA interacting with hemin and the binding sites of hemin in BSA(the details for simulation are depicted in Supporting Information).Analysis of the docking structures revealed that hemin binding produces a convergent structure only in the IIA subdomain (Fig.2a).This binding site of hemin in BSA differs from the HSA molecule on which the hemin is believed to bind within subdomain IB36.After binding with BSA, the hemin is located inside a hydrophobic cavity (Fig.2b), formed by hydrophobic amino acid residues, such as Trp213 (0.23 nm, the nearest distance of hemin to amino residue), Glu152 (0.26 nm),Ser191 (0.24 nm), Arg194, 198, 217 (0.23, 0.29, 0.22 nm),His287 (0.24 nm), Cys288 (0.30 nm), Val292 (0.28 nm), and Lys294 (0.19 nm; Fig.2c), indicating that van der Waals interactions dominate the binding.Even though the hemin in the hydrophobic cavity is positioned near to the Trp213 (Fig.2d),the hemin binding does not significantly change the basic environment of Trp213.

Fig.2 (a) The most stable docking structure of the hemin molecule at subdomain IIA of the BSA molecule.The molecular structure of hemin is also depicted.(b) Bound hemin positioning inside the hydrophobic cavity composed of the hydrophobic amino acid residues in subdomain IIA of the BSA.Red represents negative charge, and blue represents positive charge.The surface potential ranges from -0.1e to 0.1e.(c) Illustration of the amino acid residues in the vicinity of the bound hemin.The hydrogen bonds are shown by dashed green lines.(d) Illustration of the relative position of the bound hemin in subdomain IIA of the BSA to the Trp213 residue.
The formation of hemin-BSA was then verifiedviaabsorption spectra, which showed that both hemin and BSA have significant absorptions in the UV-Vis region (Fig.3a).BSA exhibits two absorption peaks, located at ~215 and 278 nm (a1, Fig.3a).The peak at ~215 nm is the characteristic absorption of the protein framework conformation and corresponds to the peptide bond,and the peak at ~278 nm is from the absorption of the aromatic amino acids, such as Trp, Tyr or Phe, in the protein molecule37.Hemin displayed a broad characteristic absorption with a center at ~385 nm (a2, Fig.3a), corresponded to the porphyrin Soret band, as well as the Q-bands38.Hemin binding caused to an increase in the intensity of the peak at ~278 nm that is slightly blue shifted (~3 nm; a3, Fig.3a).Moreover, a new strong absorption peak at ~406 nm was observed.This new peak should be resulted from the Soret band of the hemin molecule bound with BSA, and has a significant red shift comparing with that for the free hemin (not binding with BSA).These findings suggest the formation of hemin-BSA, which was consistent with the theoretical predictions, and also imply that the protein molecule in hemin-BSA complex essentially retains its native structure.
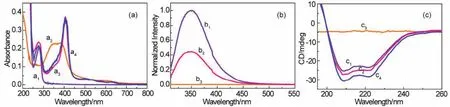
Fig.3 (a) Absorption spectra of free BSA (a1, 5 μmol·L-1), hemin (a2, 5 μmol·L-1), and hemin-BSA (a3, 5 μmol·L-1) in PBS, and the hemin-BSA immobilized on the Au substrate surface (a4).(b) Fluorescence emission spectra of BSA (b1, 5 μmol·L–1), hemin-BSA (b2,5 μmol·L-1), and hemin alone (b3, 5 μmol·L-1) in phosphate buffer solution (PBS, 10 mmol·L-1, pH 7.4).The spectra were recorded under excitation of 295 nm.(c) CD spectra of free BSA (c1, 1 μmol·L-1), hemin-BSA (c2, 1 μmol·L-1), and hemin (c3, 1 μmol·L-1) in PBS, and the hemin-BSA immobilized on the Au substrate surface (c4).
The formation of hemin-BSA was further supported by fluorescence spectroscopy.Excitation of the unbound BSA (free BSA) at 295 nm resulted in a strong fluorescence peak at ~350 nm (b1, Fig.3b), which is the characteristic fluorescence peak of BSA, corresponding to the Trp in a hydrophobic environment in the protein.The fluorescence quenching of BSA results from binding with hemin (b2, Fig.3b) at a 1 : 1 ratio of BSA to hemin.In the studied region, we did not observe any fluorescence signal of the hemin molecule (b3, Fig.3b).These results indicate the formation of hemin-BSA and were consistent with the results predicted by molecular docking and absorption spectrum results again.We further conjecture that, as expected from the simulation by molecular docking (Fig.2d), hemin is in the vicinity of Trp213 in the protein because the fluorescence of the BSA is mainly attributed to the Trp213.In addition, the fluorescence peak position of the protein almost remains unchanged after the formation of the hemin-BSA (b1, b2, Fig.3b), indicating that BSA in hemin-BSA complex essentially retains its native structure.
After theoretically and experimentally confirming the formation of hemin-BSA, we carried out CD spectral analysis to gain a better understanding of the structural and conformational changes in BSA induced by hemin binding.The CD spectra of BSA in the far-UV region showed two bands at ~208 and 222 nm (c1, Fig.3c), which are the characteristic of the α-helix structure39,40, corresponding to theπ-π* andn-π* transitions,respectively, implying that the native BSA is mainly characterized by an α-helix conformation, consistent with the previous reported results (the α-helix structure of the BSA is~67%)41.Compared with free BSA, the intensities of the two negative minima remained to be mostly the same for hemin-BSA(c2, Fig.3c), indicating that the helical structure of the protein remained stable after hemin was bound into the protein (in this far-UV region, hemin itself did not showed any CD response.See c3, Fig.3c).CD spectral analysis using the CDNN program(version 2.0) showed that the helicity of BSA in its native and hemin-BSA states was estimated to be 66 (1.0 μmol·L-1, 25 ℃)and 65%, respectively, confirming that BSA conformation remained essentially invariant after forming the hemin-BSA.
Next, immobilization of hemin-BSA on an Au film substrate and its ETp characteristics were investigated.Due to the presence of the -SH group of Cys34 on the surface of BSA,hemin-BSA can be immobilized on the Au substrate by an Au-S bond.The formation of Au-S bonds between the Au substrate and hemin-BSA are proved by the band of 270 cm-142,which is the characteristic Raman peak of the Au-S bond.Moreover, the “fingerprint region” between 200 and 2000 cm-1of the Raman spectrum provides secondary and tertiary structural information or the microenvironment of each functional group: the amide I band at 1646 cm-1, the CH2stretching band at 1448 cm-1, and the bands of hydrophobic residues such as Phe at 1006 cm-1and Tyr at 850 and 830 cm-1(curve b, Fig.4).These Raman also observed in the spectrum of the hemin-BSA in solution (curve a, Fig.4) except the peak of the Au-S bond, indicating the immobilization of the hemin-BSA on the Au substrateviathe Au-S bond.

Fig.4 The Raman spectra of hemin-BSA in solution (a) and immobilized on Au substrate (b).
The immobilization of the hemin-BSA on the Au substrate can also observed from the atomic force microscopy (AFM) images,which showed hemin-BSA could form a dense layer on the surface of the Au substrate (Fig.5a,b).These features were not observed on the surface of a pure Au substrate (without immobilization of proteins, Fig.5c,d), indicating that the interaction of the protein with the substrate led to the absorption of the molecule.The lateral dimension analysis based on the AFM image revealed that on the top Au electrode-sample convolution, the lateral size the protein was ~3.2-3.7 nm, which is equivalent to the actual size of ~4.0 nm × 4.0 nm × 14.0 nm7.These results demonstrate that hemin-BSA has been immobilized on the Au surface successfully.
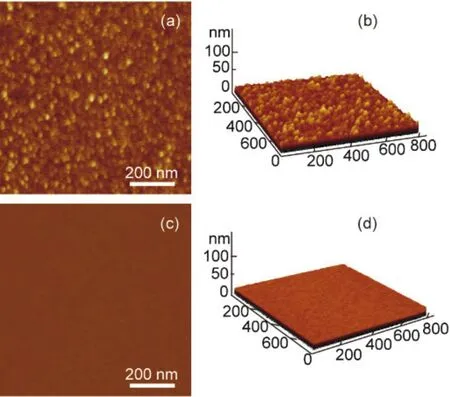
Fig.5 (a) AFM topography image of the hemin-BSA immobilized on the Au substrate surface and (b) its corresponding 3D image.(c) AFM topography image of Au substrate and (d) its 3D image.
Before performing the ETp experiments on hemin-BSA, we investigated whether the conformation structures of BSA immobilized on an Au substrate remained by measuring its absorption and CD spectra and comparing them with values recorded in solution.The resulting absorption spectrum showed peaks at ~276 and 406 nm (a4, Fig.3a), similar to the absorption of hemin-BSA in solution (a3, Fig.3a).Two negative bands appeared in the CD spectrum of the immobilized hemin-BSA (c4,Fig.3c) was also similar to those for the hemin-BSA in solution(c2, Fig.3c).Based on the absorption and CD spectral results, we conclude that the native conformation of BSA was retained after hemin-BSA was immobilized on the Au substrate surface.
The ETp characteristics of the BSA and hemin-BSA were investigated by recording theirI–Vresponses.According to theI–Vresponses (Fig.6a), the ETp processes of BSA and the hemin-BSA on the Au substrate surface have obvious semiconductor characteristics.I–Vresponses were derived from the protein ETp rather than its redox reaction because BSA (with no redox center) is electrochemically inactive.The current corresponding to pure hemin immobilized on the surface of the Au substrate (Fig.6b) was higher than the measured ETp current with hemin-BSA (Fig.6a).This means that hemin-BSA formed a less electronically conductive film on the Au substrate surface,consistent with our AFM observations.Compared to free BSA,the ETp current of hemin-BSA was higher by nearly an order of magnitude (Fig.6c), indicating the bind of hemin in BSA can significantly improve the ETp.
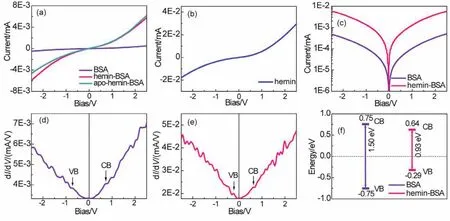
Fig.6 (a) I–V responses of free BSA, hemin-BSA, and apo-hemin-BSA immobilized on the Au substrate surface.(b) I–V responses of the hemin immobilized on the Au substrate surface.I–V responses presented here are the average of 15 different measurements on three separate samples (five measurements at different points on each sample).(c) Semi-logarithmic plot of the I–V response curves for free BSA and hemin-BSA immobilized on the Au substrate surface.(d and e) Differential conductance spectra of free BSA (d) and hemin-BSA (e).The vertical lines in (d) and (e) represent Fermi energies, which are aligned to 0 V.(f) Schematic illustration of the CB and VB band levels and the heights of the band gaps of BSA and hemin-BSA.The values of the CB and VB presented here are average values of the 15 measurements.
Hemin has a Fe ion redox center (Fig.2a).To check whether the enhancement of the ETp current of the hemin-BSA is caused by the Fe ion redox center, we employed the apo-hemin (i.e.,without Fe ion redox center) to bind the BSA, forming apohemin-BSA.The recordedI–Vresponse of the apo-hemin-BSA is depicted in Fig.6a, which indicates the ETp current of the apohemin-BSA is almost in the same as that of hemin-BSA,implying that the Fe ion center of the hemin hardly affects the ETp current of the BSA.This result suggests that the enhancement of the ETp current of bound BSA (Fig.6c) is not caused by the Fe ion redox center of the hemin, and further verify that theI–Vresponses in Fig.6a result from the ETp of protein,not from the electrochemical redox reaction.
Finally, we estimated the changes of ETp band gaps of BSA after binding with hemin.The differential conductance spectra,i.e., differential conductivity as functions of the sample bias voltage (dI/dVvsV), were plotted (Fig.6d,e).In these plots, the bias voltage of zero (V= 0) corresponds to the Fermi energy,negative (V< 0) and positive (V> 0) voltages indicate energies below and above the Fermi energy, respectively.According to WKB (Wentzel Kramers Brillouin) approximation43-45, dI/dVis a convolution of the surface DOS,i.e., is proportional to the density of states (DOS) of the semiconductor, and thus the DOS can be obtained from the dI/dVvsVcurves.The dI/dVbelow the Fermi energy indicates the occupied DOS (corresponding to VB)and the dI/dVabove the Fermi energy indicates the unoccupied DOS (corresponding to CB).Therefore, these plots can also be used to predict the CB and VB levels of BSA in hemin-BSA because the plots reflect the characteristics of each protein.The peaks in the negative voltage region of the DOS spectra can be expressed as the VB of the semiconductor, similarly, the position of CB is provided by the peak at the positive voltages.In this way, band gap values are calculated utilizing the position of CB and VB edges, and the influence of binding molecules on the protein can be determined based on the difference in band gaps.Fig.6d shows that the CB and VB of the BSA is ~0.75 ± 0.04(average of 15 measurements) and ~ -0.75 ± 0.08 eV (Fig.6d),respectively, and is equally distributed around 0 eV.The band gap is ~1.50 ± 0.05 eV.After binding with hemin, the protein CB(~0.64 ± 0.06 eV) and VB (~ -0.29 ± 0.07 eV) are closer to the Fermi levels (Fig.6e), resulting in a band gap of ~0.93 ± 0.05 eV (Fig.6f).The decrease in the band gap resulted to an increase in ETp, demonstrating that hemin molecules can effectively regulate the ETp characteristics and the transport band gap of BSA.In addition, the protein ETp band gap generally fell within the range of 0.8-2.6 eV25, which is effective for common semiconductor technologies (for example,p–njunction-based transistors), suggesting that controlling the electronic band gap of the protein may be further applied to suitable materials for constructing novel bioelectronic devices at nanoscale levels.
4 Conclusions
In conclusion, we developed a simple method for tuning the ETp band gap of BSA by binding with hemin.Both molecular docking and absorption spectroscopy results demonstrated that conformational changes caused by the binding of hemin to the IIA subdomain of BSA were negligible.I–Vcurves indicated that binding of BSA with hemin reduced the protein band gaps and significantly increased the ETp.These results could easily be extended to tune the ETp band gaps of other proteins by selecting the foreign binding molecules.More importantly, these protein bound with foreign molecules have possibilities to be used as ETp mediators in future nanoscale bioelectronic devices.
Supporting Information:available free of chargeviathe internet at http://www.whxb.pku.edu.cn.
杂志排行

物理化学学报的其它文章
- 基于血红素衍生的中空非贵金属催化剂氧还原反应电催化活性
- Photocathodic Protection on Stainless Steel by Heterostructured NiO/TiO2 Nanotube Array Film with Charge Storage Capability
- Influence of NaOH Concentration on Sodium Storage Performance of Na0.44MnO2
- 一类受生物启发的双膦双硒镍配合物的合成及其电催化产氢性能
- 基于非富勒烯电子受体的半透明有机太阳能电池
- ZrO2包覆高镍LiNi0.8Co0.1Mn0.1O2正极材料提高其循环稳定性的作用机理