Numerical simulation of laser-induced plasma in background gas considering multiple interaction processes
2021-03-22JunxiaoWANG王俊霄LeiZHANG张雷ShuqingWANG王树青MaogenSU苏茂根DuixiongSUN孙对兄JianghuaHAN韩江华GuofuXIA夏国富ChenzhongDONG董晨钟QiMIN敏琦WeiguangMA马维光LeiDONG董磊WangbaoYIN尹王保LiantuanXIAO肖连团andSuotangJIA贾锁堂
Junxiao WANG(王俊霄),Lei ZHANG(张雷),*,Shuqing WANG(王树青),Maogen SU (苏茂根), Duixiong SUN (孙对兄), Jianghua HAN (韩江华),Guofu XIA (夏国富), Chenzhong DONG (董晨钟), Qi MIN (敏琦),Weiguang MA (马维光), Lei DONG (董磊), Wangbao YIN (尹王保),*,Liantuan XIAO (肖连团) and Suotang JIA (贾锁堂)
1 State Key Laboratory of Quantum Optics and Quantum Optics Devices, Institute of Laser Spectroscopy,Shanxi University, Taiyuan 030006, People’s Republic of China
2 Collaborative Innovation Center of Extreme Optics, Shanxi University, Taiyuan 030006, People’s Republic of China
3 National Energy R&D Center of Petroleum Refining Technology(RIPP,SINOPEC),People’s Republic of China
4 Key Laboratory of Atomic and Molecular Physics & Functional Material of Gansu Province, College of Physics and Electronic Engineering,Northwest Normal University,Lanzhou 730070,People’s Republic of China
Abstract Laser-induced plasma is often produced in the presence of background gas, which causes some new physical processes.In this work,a two-dimensional axisymmetric radiation fluid dynamics model is used to numerically simulate the expansion process of plasma under different pressures and gases,in which the multiple interaction processes of diffusion,viscosity and heat conduction between the laser ablated target vapor and the background gas are further considered, and the spatio-temporal evolutions of plasma parameters (species number density, expansion velocity,size and electron temperature) as well as the emission spectra are obtained.The consistency between the actual and simulated spectra of aluminum plasma in 1 atm argon verifies the correctness of the model and the numerical simulation, thus providing a refinement analysis method for the basic research of plasma expansion in gases and the application of laser-induced breakdown spectroscopy.
Keywords: laser-induced plasma, radiation fluid dynamics model, diffusion, viscosity, heat conduction
1.Introduction
When a laser pulse of high power (≥108W cm−2) is focused on the solid target through a lens, the laser beam strongly interacts with the target, producing a high-temperature and dense plasma, and the plume expands along the directions perpendicular to and parallel to the target surface.The accurate establishment of the theoretical model of laser-induced plasma plume expansion makes the process of the plasma plume expansion standardized, which is helpful for people to deeply understand the dynamic process of plasma plume expansion.In vacuum, plasma plume can be regarded as an ideal fluid with no viscosity,so its expansion can be described by a Euler equation.In the past few decades, great progress has been made in experimental research and theoretical simulation of plasma evolution [1-8], which lays a good foundation for the standardization of expansion model of laser-induced plasma.
Compared with that in vacuum, laser-induced plasma is more often produced in the background gas,and its expansion process and conservation equations are undoubtedly more complex.Chen et al used the gas dynamics model to study the one-dimensional spatio-temporal evolution of Cu plasma in helium with 1 atmosphere pressure[9].Oumeziane et al used one-dimensional multi-species Euler equation with mass and energy source terms to calculate the evolution of copper plasma in helium gas [10].However, due to the free expansion of plasma in radial direction and the limited expansion in axial direction, the two-dimensional characterization in both axial and radial directions is more urgent.There has also been a lot of research in this area.For example,Ho et al calculated the two-dimensional distribution of temperature,pressure and velocity of the expanded aluminum plasma using the compressible and non-dissipative Euler conservation equations in argon[11].Gusarov et al proposed a two-stage gas dynamics model to simulate the expansion of laser ablated graphite plasma under 100 Pa helium gas,and studied the influence of type and pressure of background gas on the plasma [12].Mazhukin et al employed a radiation gas dynamics model to simulate the influence of laser intensity on the evolution of aluminum plasma in the presence of background gas [13].Itina et al studied the evolution of plasma in the oxygen background gas by using a mixed model.In the early stage,the diffusion and energy exchange between plasma plume and the background gas were ignored, and the gas dynamics method was used for simulation, while in the later stage, the mass diffusion and energy exchange were considered,and the Monte Carlo method was used for simulation[14].Shabanov et al used the axisymmetric Navier-Stokes equations to study the expansion of plasma in the argon background gas [15].The background gases in these studies are not only inert but also reactive.Considering that an inert gas is often needed to improve the film quality (pulsed laser deposition) and enhance the spectral line intensity (laser-induced breakdown spectroscopy),the plasma expansion in this background gas is investigated.However, it should be noted that since the binary plasma is produced by the collision between the laser ablated vapor species and the background gas,this interaction will cause some new physical processes,such as deceleration,thermalization of the ablated species and formation of shock waves.Therefore,the effects of mutual penetration,resistance and energy transfer on plasma expansion in background gas should also be considered in the model.
In this paper, a two-dimensional axisymmetric radiation fluid dynamics model including diffusion, viscosity and heat conduction processes is used to describe the expansion of laser-induced plasma.The model is used to theoretically simulate the spatio-temporal evolution of species number density, expansion velocity, electron temperature and emission spectrum of plasma produced by laser ablation of aluminum target under different pressures and background gases.The simulation results of plasma spectra are compared with the experimental results to verify the correctness of the model and numerical simulation,so as to provide theoretical support for future research.
2.Theoretical model
The expansion process of plasma in non-reactive background gas is expressed by the following equations of mass,momentum and energy conservation [16, 17]:
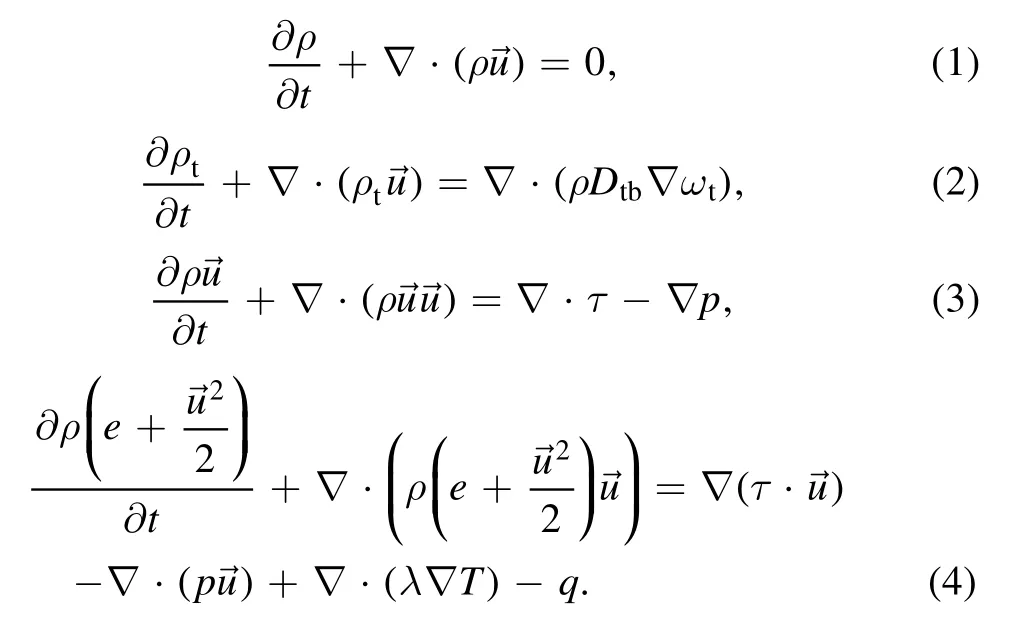
Here,ρ=ρt+ρbcorresponds to the total mass density consisting of the mass density of target vaporρtand background gasρb,ωtis the mass fraction of the target vapor,and u,p,q,eare respectively the velocity of the plasma plume,the local pressure, the radiation power loss, and the specific internal energy.The expression of binary diffusion coefficientDtb,thermal conductivityλand viscous stress tensorτcan be found in the literature [9, 17].
Since the vapor and the background gas follow the ideal gas law, there are the following relationships:

where T is the electron temperature,and nt,nb,necorrespond to the target vapor number density, the background gas number density, the electron number density respectively.
Assuming that the plasma is in a local thermal equilibrium state, by combining the Saha equations and the charge conservation equations of target vapor and background gas,the number densities of atom and ion in plasma can be calculated as:
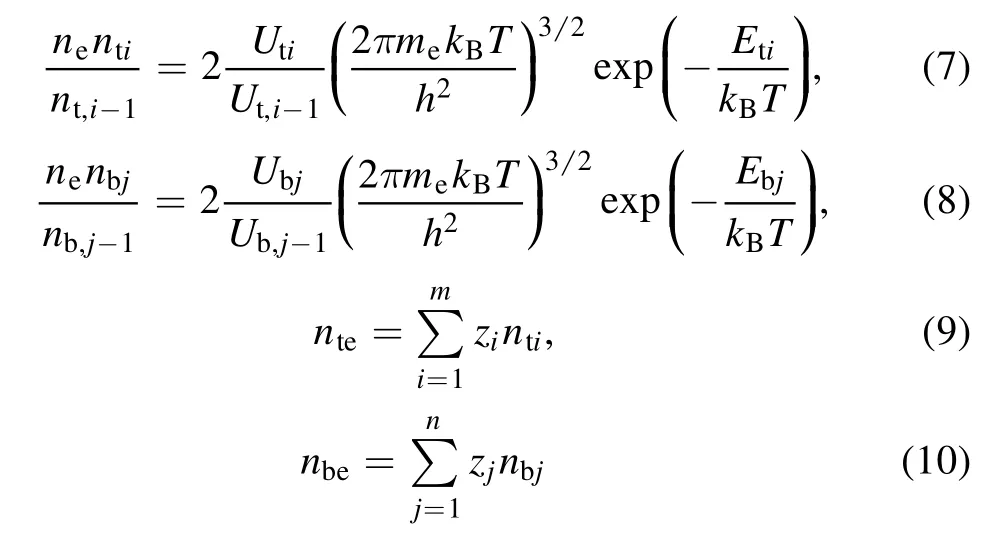
whereU,Eare respectively the partition function, the ionization potential, andzrepresents the charge number, andcorrespond to the atom, ion, electron number density from target vapor and background gas.
The intensity of emission line can be calculated by the following radiation transfer equation [18]:

where the blackbody radiation isthe total absorption coefficient isand the absorption coefficients of free-free, free-bound [19], and bound-bound [20] processes are respectively:
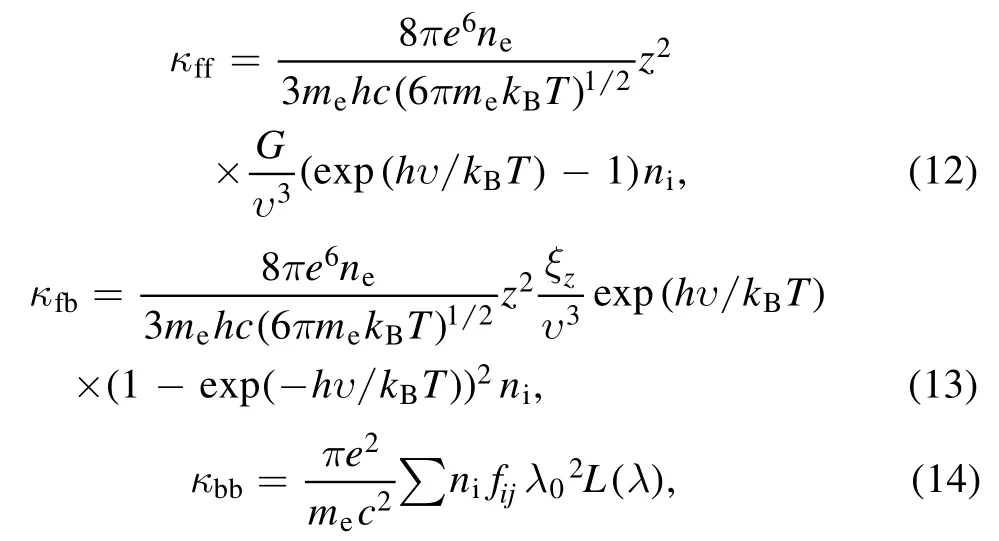
whereG,ξare the Gaunt factor, the electron number in the outermost shell,andniis the ion number density,andλ0is the central wavelength of spectral line.The oscillator strength of transition isand the normalized line profile function isHere,gare the transition probability from the upper energy leveljto the lower energy leveli, the degeneracy, andλΔ0is FWHM of spectral line in optically thin condition.
In solving the above model, the computational region is firstly divided into grids, and then the differential equations are converted into difference equations by using the numerical method of finite difference.Here, the explicit Lax-Wendroff combined with flux-corrected transport method[21]are used to deal with the discontinuity of the shocks, and the no-slip-wall condition is applied to the boundary of the computational region.As for the convergence of the difference scheme,we use the Courant-Friedrichs-Lewy condition to judge, and the time stepΔtand grid stepΔssatisfy the relationship:If the initial conditions of difference simulation are known, the species number density of vapor and background gas, expansion velocity and total energy of plasma can be calculated from equations(1)to(4).The Newton iteration method [9] is used to solve equations (6)-(10), to get the electron temperature and number density of atoms and ions.By solving equation (11),the spectral line integral intensity in a certain direction can be obtained.The temporal evolutions of plasma parameters can be calculated iteratively with a certain time interval as the step size.The initial conditions at the beginning of the laser pulse action are determined by the physical mechanism of lasertarget interaction.In the direction parallel to the target surface, the initial size of the plasma is the spot radius, while in the direction perpendicular to the target surface,the plasma is considered as a high-temperature and dense monatomic ideal gas,so its initial size is close to the mean free path of species motion [22].After the laser is finished, the initial size of plasma can be obtained by simulating the action of laser pulse through kinetic method[23,24].This method is based on the theory of fluid dynamics and combined with the self-similarity theory to obtain the relationship between plasma size and time.Then the forward difference method is used to obtain the plasma size after the laser pulse.In addition, the electron temperature of plasma can be calculated by the formula in[25],and the number density can be determined by the number of species vaporized at the laser spot [26].The initial radial and axial velocities of plasma are zero, and all the above calculations can be done on MATLAB.
3.Experiment
The Nd:YAG laser (Quanta-Ray INDI, 1064 nm, 7 ns, 1 Hz,50 mJ/pulse) was incident on an aluminum target (purity:>99.99%), which was in 1 atm argon, to create plasmas through the focusing of a plano-convex lens (focal length:50 mm).The sample is placed on another set of translation platform,so that each pulse can act on a new point.The argon was blown through the tubes on both sides of plasma at a flow rate of 5 l min−1to ensure that the plasma is always in the background of argon gas.The plasma plume was amplified 5 times by a plano-convex lens, and its spectrum was collected by an all-silica optical fiber into a grating spectrometer(Acton SpectraPro, spectral range: 290-410 nm, resolution:25.85 cm−1) that equipped with an ICCD (Princeton Instruments, PI-MAX4, exposure delay: 50, 100 ns, integration time: 10 ns).The final spectrum was obtained by averaging 50 spectra.The optical fiber was fixed on a motorized twodimensional translation platform (displacement precision:0.05 μm) to realize the axial spectral scanning of the plasma plume.
4.Results and discussions
In our work, when the laser started irradiating, it can be considered that the radial size was the spot radius(1 mm),and the axial size was the average free path of species motion(generally 10−3mm).Through the simulation of the isothermal expansion stage, the radial and axial sizes of the plasma after laser irradiation were 1 mm and 0.1 mm,respectively.For the laser power density of 2×10⁸W cm−2,the vapor density was about 3.5×1019cm−3and the electron temperature was about 1.9 eV at the center of the plasma.Moreover,the initial number density and electron temperature of the plasma follow the Gaussian distribution [27], so there are the relationshipsandwhereR0andZ0are the radial and axial sizes of the initial plasma after laser irradiation,andare the vapor density and electron temperature at the center of the initial plasma.In this paper,we considered the first-order and second-order ionization of Al and the first-order ionization of Ar.The grid step used in this calculation was 0.01 mm in both directions,and the time step was 0.1 ns.The emission spectrum, intensity distribution of spectral line,number density,expansion velocity and electron temperature of laser-induced aluminum plasma in argon were investigated and discussed in detail below.
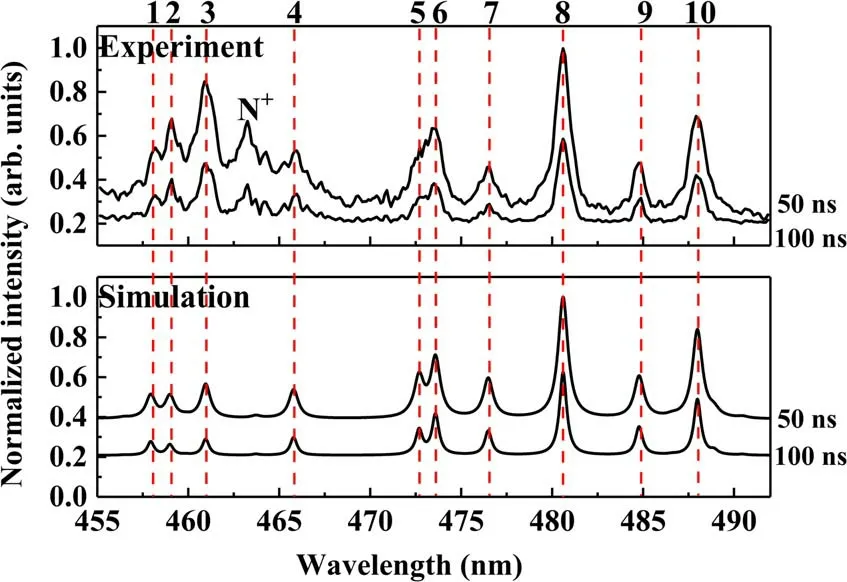
Figure 1.A comparison of experiment (above) and theoretical (below) normalized emission spectra under 1 atm argon.
4.1.Emission spectrum
Figure 1 shows a comparison between the experimental results and the theoretical simulation of the normalized emission spectrum in the 455-492 nm region at 50 ns and 100 ns(start timing at the end of laser irradiation)under 1 atm argon.The spectrum was obtained from one side to the other side of the periphery through the plasma center.As the plasma was still in the initial stage of formation, the background of continuous radiation was very strong in both experimental and theoretical emission spectra, and decreased significantly with time.Moreover, the spectral lines became weaker and narrower.The ten spectral lines that can be distinguished in the figure are all Ar+ion lines,which have been numbered by wavelength.However,due to the broadening of the spectral lines caused by instrument and collisions between particles, some spectral lines with very close wavelengths cannot be resolved.In general, the theoretical simulation of the emission spectrum calibrated is in good agreement with the experimental results,especially in positions and profiles of main peaks, so we believe that this model can be used to describe the plasma expansion under such conditions and can proceed with the simulation and discussion below.It should be noted that although the radiation of aluminum species has been taken into account in the simulation, due to the low emission intensity, no discernable aluminum spectral line is found in the figure.The envelope near 463 nm in the experimental spectrum was determined as some unexpected N+ion lines,because in the absence of the argon background gas,we still had very strong lines here, which were not the lines for aluminum as compared to the NIST database.The argon gas in our experiment was blown out through two tubes, so that the ambient gas around the plasma would be inevitably mixed with a small amount of air.The resulting vapor plasma would collide with a mixture of argon and nitrogen, allowing the ionic emission line of nitrogen to be observed.Moreover, at the initial stage of plasma, the ionic lines are strong and the line widths are wide.The simulation wavelengths of these lines and the energy level transitions given by NIST are listed in table 1.
4.2.Species number density
Background gas has a great influence on laser-induced plasma, so we have carried out theoretical simulation of plasma expansion under different pressures and gases, in order to clearly study the variation of plasma parameters.Figure 2(a)shows the change of total species number density of background gas with time(0-100 ns)at the edge of plasma under different argon pressures and gases in 1 atm.It can be seen that in the early stage of plasma after laser ablation, the total species number density of background gas at the edge of plasma increases gradually.This was caused by the interaction between the target vapor produced by laser ablation and background gas, which greatly increased the number density of background gas species.Moreover,with the increase of gas pressure,the interaction between target vapor and background gas became stronger, and the total species number density of background gas in the plasma plume also increased.In other inert gases,such as neon or krypton,the relationship between plasma species number density and pressure has a similar time evolution trend.At the same atmospheric pressure, the smaller the atomic mass,the greater the number density of the background gas.As the atomic mass decreases, the diffusion between vapor plasma and background gas becomes stronger.Figure 2(b)depicts the maximum number density of Al under different background gases in 1 atm.At the same time, the number density of Al vapor plasma decreases as the atomic mass of background gas decreases, which is due to the reduction of the binding effect on Al vapor plasma.The number density of Al vapor plasma is opposite to that of background gas in relation to atomic mass.It is also noted in[28]that the background gas with a larger atomic mass makes plasma denser.Figure 3 gives the axial evolution of total species number densities of Al and Ar at the plasma center under 1 atm argon at different time.Here, the solid and hollow points represent the species number density of Al and Ar,respectively.We can intuitively see that the maximum number density of Ar is almost in the front of the plasma, indicating that the background argon was pushed away by the target vapor.Here, the contact between vapor plasma and background gas causes the species to collide violently, producing either excited or ionized species of Ar.As the evaporation process stops,the vapor density decreases rapidly due to the lack of material supply,and the maximum location changes from near the target to near the plasma front.The maximum Ar number density is 0.3 mm from the surface at 50 ns and 0.45 mm at 100 ns.Before the plasma front, the number density of Ar tends to be 2.5×1019cm−3, which is equal to that of 1 atm argon at room temperature.

Figure 2.Temporal evolution of total species number density of background gas at the edge of plasma under different pressures and gases(a) and temporal evolution of maximum number density of Al under different gases (b).
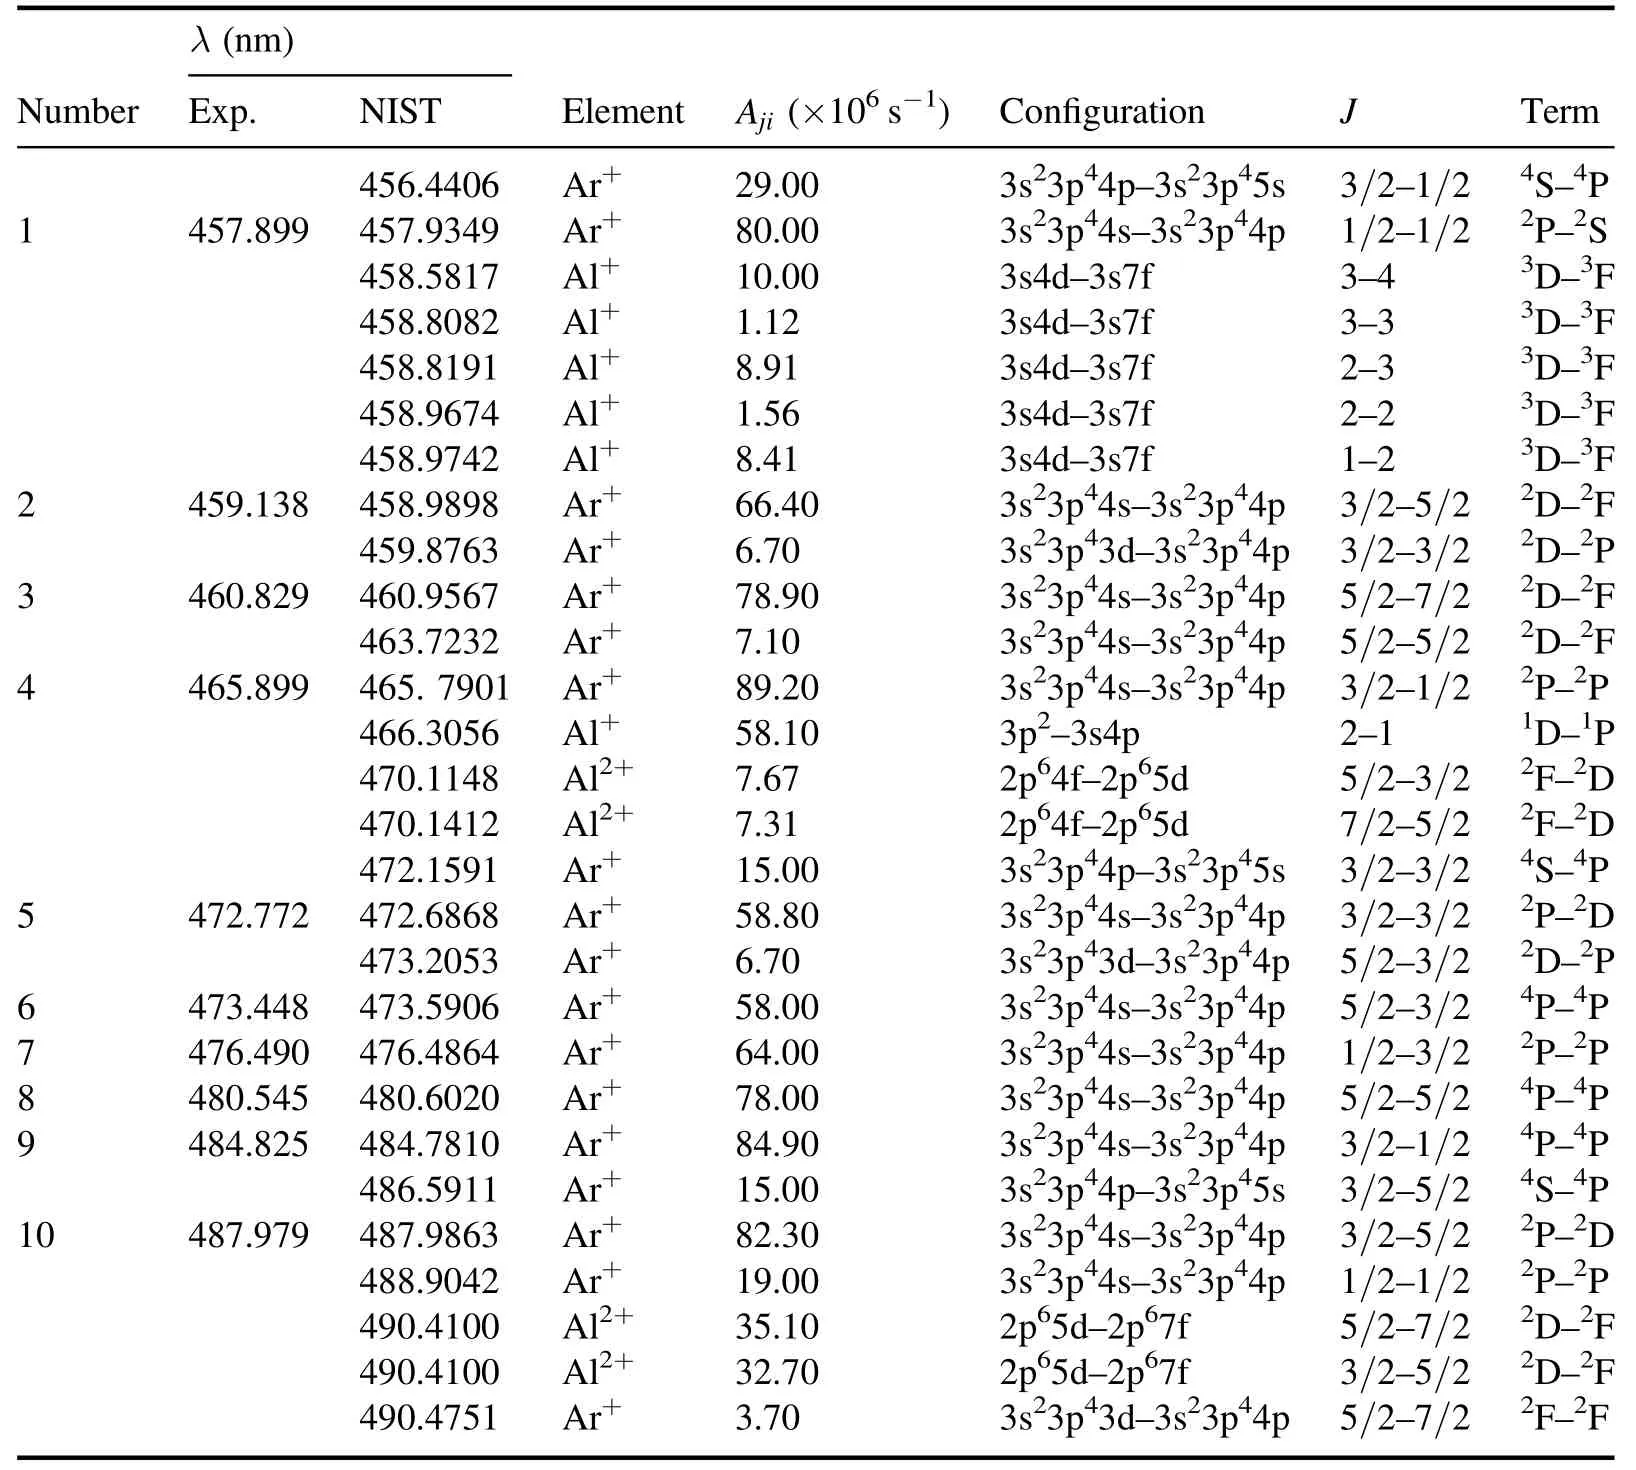
Table 1.Spectral lines information.
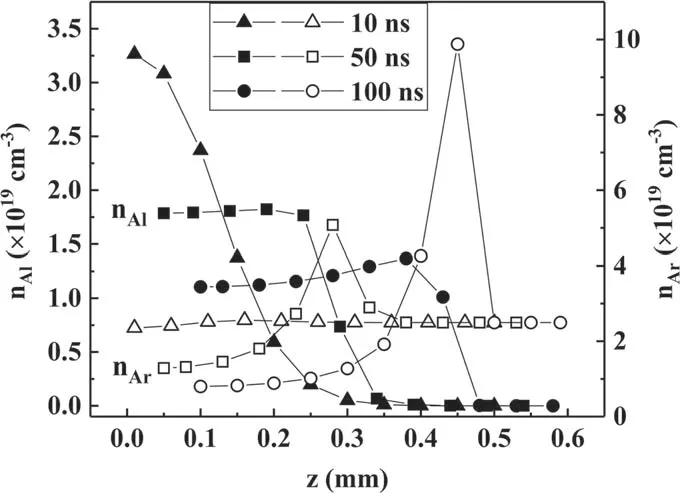
Figure 3.Axial evolution of total species number densities of Al(solid points) and Ar (hollow points) at the plasma center under 1 atm argon at different time.
When the vapor plasma expands into background gas,the resulting Rayleigh-Taylor instability affects the uncertainty of measurement signal.It occurs when the mass density of vapor plasma is higher than that of background gas.Here we used the Atwood numberto evaluate the instability of plasma [29].Figure 4 shows the temporal evolution of Atwood number at the interface under different pressures and gases.As can be seen, the Atwood number decreases monotonously with time and changes from instability to stability, and the plasma seems to be always stable under 1 atm argon.Moreover, the decrease of pressure and atomic mass of background gas can lead to an increase of instability time.Then we investigate the instability according to the temporal evolution of species number density.Figure 5 gives the species number density distributions of vapor plasma under 1 atm argon at different time, showing the migration of plasma species.It can be seen that with the outward expansion of the plasma, the location of the maximum species number density moves rapidly from the side of target surface to the vicinity of the shock wave.Although the plasma is stable during this period, the massive migration of plasma species can lead to the generation of initial instability and the further amplification.
4.3.Expansion velocity
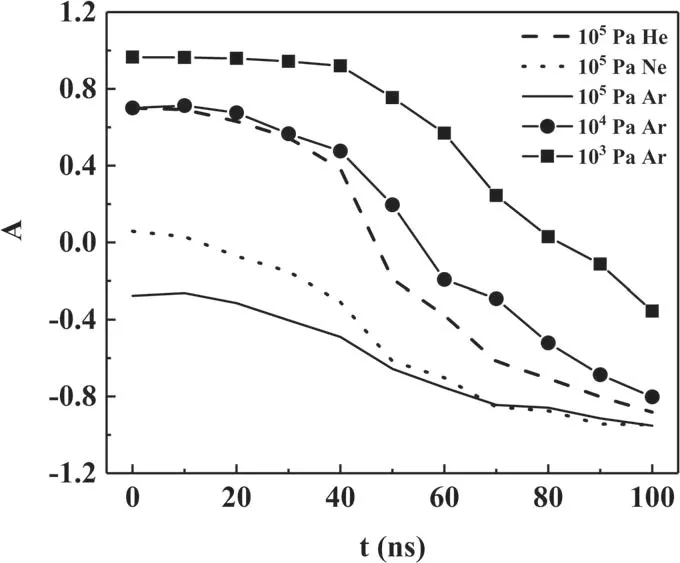
Figure 4.Temporal evolution of Atwood number at the interface under different pressures and gases.
Figure 6 shows the relationship between the radial and axial expansion velocities of plasma and the distance from the center of plasma at 100 ns under different argon pressures and vacuum.It can be seen that near the center of plasma, the relationship between the velocity and the distance is basically linear in both directions, while near the edge of plasma, it becomes nonlinear.In vacuum,the radial and axial expansion velocities of plasma increase monotonously with the increase of distance.But in argon, due to the direct contact between plasma and background gas, they first increase near the plasma center and then decrease near the plasma edge,where it transfers momentum and energy to the background gas,reducing its own momentum and energy.The decrease in velocity near plasma edge is found after using the expansion model.In addition, the radial and axial velocities in the background gas are smaller than those in the vacuum,and the larger the velocity, the more obvious the difference.For example, in 1 atm argon, the radial velocity at the edge decreases by half and the axial velocity by two thirds compared with that in vacuum.Figures 7(a) and (b) respectively show the temporal evolution of maximum expansion velocities at radial and axial directions under different argon pressures and different background gases in 1 atm.For the initial plasma, the axial expansion velocity of the edge is much higher than the radial expansion (about an order of magnitude), which is determined by the initial plasma conditions and initial plasma shape in particular.The pressure gradient in axial direction is much stronger than that in radial direction, resulting in a strong acceleration away from the target.This is the so-called ‘flip-over’ effect that especially pronounced in vacuum.In figure 7(a), under different argon pressures, the radial and axial maximum velocities of the plasma increased almost monotonously in the investigated time range.In a physical sense,after the pulsed laser is ended,the plasma continues to expand,converting its internal energy into kinetic energy, which results in an increase in the velocity of species in the plasma.Moreover, the lower the gas pressure is, the more the velocity of species in the plasma increases.In figure 7(b), the larger the atomic mass of the background gas, the smaller the plasma velocity.

Figure 5.Two-dimensional distributions of species number density of vapor plasma under 1 atm argon at different time.

Figure 6.Expansion velocities of plasma at different radial and axial positions at 100 ns under different argon pressures and vacuum.The line-symbol in the inset shows the change in edge velocity at 1 atm argon.
4.4.Size
Figure 8(a) depicts the theoretical simulation of the temporal evolution curves of radial(r,hollow points)and axial(z,solid points) sizes of Al plasma edge in 0-100 ns under different argon pressures.The comparison of evolution curves of plasma size under vacuum is also given.Here,the edge of the plasma is approximately taken as (1/e)1/2of the maximum plasma density.It can be seen that the axial size of the initial plasma is much smaller than the radial size(about an order of magnitude).In the direction parallel to the target, due to the low velocity, the net expansion distance of the plasma is much lower than that perpendicular to the target.When the argon pressure is lower than 1.0×10³Pa, the difference of radial size becomes no longer visible.During the expansion process, the laser-induced plasma collides with the ambient gas, which hinders and constrains the expansion behavior of the plasma.The larger the gas pressure is, the greater the resistance caused by the collision between the plasma plume and the background gas is,and the smaller the size of plasma is.This is consistent with the experimental results that the plasma size decreases monotonously with the increase of gas pressure [30].Figure 8(b) shows the temporal evolution curves of axial size of vapor plasma under different background gases in 0-100 ns at 1 atm.For the inert gases used, the axial size increases linearly with time after 10 ns.The smaller the atomic mass of background gas, the less binding to the vapor plasma, causing the axial size larger.Similarly,from the experimental comparison on expansion of aluminum plasma in helium, nitrogen and argon, it is concluded that the atomic mass of argon is the largest, and the size of plasma formed in argon is the smallest [30].
4.5.Electron temperature
Figures 9(a) and (b) respectively show the contour diagram under 1 atm argon and spatial evolution under different gases in 1 atm of plasma electron temperature at 100 ns.In figure 9(a), the one-dimensional power source theory proposed by Chen et al[31,32]was used in the axial simulation,giving the plasma velocity near the target surface.The basic core of the theory is to treat the plasma ejected from the target as the power source.After the pulsed laser irradiation, the whole plasma leaves the target surface at a high speed, and the plasma tail moves at a uniform speed in the direction perpendicular to the target surface.In this case, the speed is about 105cm s−1.Then we can calculate the distance between plasma and target surface at a certain delay.It is shown that the outer contour of the plasma is a radially elongated ellipsoid, and the electron temperature gradually decreases from the center to the periphery.It can be predicted that after a period of time, the plasma will become an axially elongated ellipsoid.After interacting with laser, the plasma leaves the target surface at high speed,which is in good agreement with the experimental results reported by others [33].The maximum electron temperature appears at the plasma center of 0.1 mm in the axial coordinate.Figure 9(b) shows that the plasma temperature decreases with the increase of axial distance.Near the shock wave, there is a slight increase in temperature,especially in the gas with small atomic mass.At the same atmospheric pressure, the vapor plasma is hotter in the background gas with larger atomic mass.This is because the heat conduction between them is weaker, resulting in a slower plasma temperature dissipation.
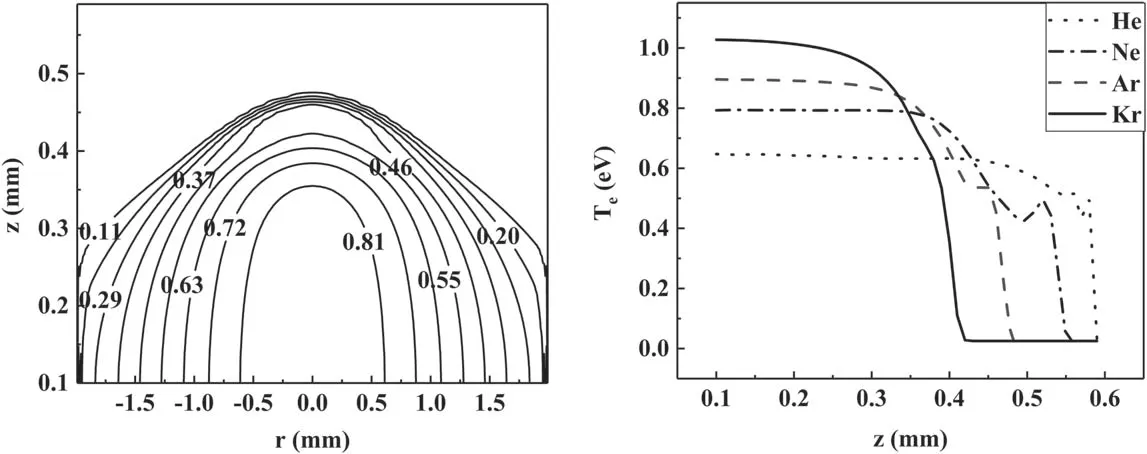
Figure 9.Contour diagram under 1 atm argon (a) and spatial evolution under different gases in 1 atm (b) of plasma electron temperature at 100 ns.
Figure 10 shows the temporal evolution curves of electron temperature in the center of plasma plume from 0 to 100 ns under different argon pressures and vacuum (a) and gases in 1 atm (b).In figure 10(a), during this period, the target surface and the plasma no longer absorb the external energy, and the plasma begins to expand adiabatically.It can be seen that all the curves show a gradual downward trend,as the plasma expands adiabatically, increasing in volume and decreasing in temperature.For the same delay,the higher the argon pressure is, the higher the electron temperature in the plasma center is.This means that as the gas pressure increases, the electron temperature decreases more slowly.This is because with the increase of external pressure, not only the plasma is confined and expansion is limited, but also the species density of gas increases,and the collision between Al vapor and background gas is enhanced, hence the high electron temperature persists longer.In figure 10(b), the plasma temperature also decreases with time under different gases.The atomic mass of background gas is smaller and its temperature is lower, which is the result of the increase of heat conduction and the decrease of collision frequency between aluminum plasma and background gas.From the above two figures, we can come to the conclusion that the high pressure gas or large atomic mass gas has a strong binding effect on the expansion of plasma, which can keep the plasma in a high-temperature state for a long time.This conclusion is also consistent with the previous experimental results [30, 34].

Figure 10.Temporal evolution of electron temperature in the center of plasma plume under different argon pressures and vacuum (a) and gases in 1 atm (b).
5.Conclusions
In this paper, a two-dimensional axisymmetric radiation fluid dynamics model is used to simulate the plasma expansion in the inert background gas by integrating the diffusion, viscosity and heat conduction processes between the laser ablated target vapor and the background gas.We use the radiation transfer equation to simulate the emission spectrum of the plasma, in which the influence of three absorption processes on the emission lines is considered.The theoretical simulation results are verified by the plasma spectrum collected in the experiment, which proves the correctness and reliability of this model.We also use this model to study the spatio-temporal evolution of the number density, expansion velocity,size and electron temperature of laser-induced aluminum plasma.The results show that both the size and expansion velocity of the plasma under different argon pressures are smaller than those in the vacuum due to the resistance caused by the collision with the background gas.This conclusion is also applicable to other inert gases.Different from the monotonous increasing trend of plasma edge expansion velocity in vacuum, it will decrease in the background gas.This is our finding when the interaction between plasma and background gas is taken into account, compared to other research that simulates the expansion of plasma in background gas.With the increase of background gas pressure,the expansion of plasma is limited and the number of species colliding with the laser ablated vapor increases,which makes the plasma temperature rise and the temperature gradient decrease.Similarly,the higher the atomic mass,the higher the plasma temperature.In this study, an increase in pressure or atomic mass of background gas leads to a smaller,denser and hotter plasma, and also shortens the instability time.In this way,it is possible to control the plasma expansion process by changing the parameters of background gas, such as pressure or gas type.In fact, the stability of the finite difference method used in this paper is not only related to the difference scheme itself, but also to the time and space step.To ensure the stability, we use a small time step to calculate the evolution of plasma parameters within 100 ns, which is a lot of computation.In this time range, the plasma is close to the local thermal equilibrium state.In the future,we will continue to study the evolution of plasma on a longer time scale.Moreover,we will model the plasma expansion in the reactive gas, which is sometimes necessary for the laser-induced breakdown spectroscopy technique.
Acknowledgments
This work was supported by National Key R&D Program of China (No.2017YFA0304203); National Energy R&D Center of Petroleum Refining Technology (RIPP, SINOPEC); Changjiang Scholars and Innovative Research Team in University of Ministry of Education of China (No.IRT_17R70); National Natural Science Foundation of China(NSFC) (Nos.61975103,61875108, 61775125, 11434007); Major Special Science and Technology Projects in Shanxi (No.201804D131036); 111 project (No.D18001); Fund for Shanxi ‘1331KSC’.
猜你喜欢
杂志排行
Plasma Science and Technology的其它文章
- In-situ reduction of silver by surface DBD plasma:a novel method for preparing highly effective electromagnetic interference shielding Ag/PET
- Preliminary study of an open-air watercontacting discharge for direct nitrogen fixation
- Simulations of standing wave effect, stop band effect,and skin effect in large-area very high frequency symmetric capacitive discharges
- Oblique propagation of nonlinear ionacoustic cnoidal waves in magnetized electron-positron-ion plasmas with nonextensive electrons
- Experimental study of ELM-induced filament structures using the VUV imaging system on EAST
- Nonlinear evolution and secondary island formation of the double tearing mode in a hybrid simulation
