Distribution pattern and geochemical analysis of rare earth elements in deep-ocean sediments*
2021-02-22JingxiLIChengjunSUNFenghuaJIANGFengleiGAOYifanZHENG
Jingxi LI , Chengjun SUN , , , Fenghua JIANG, Fenglei GAO , Yifan ZHENG
1 Key Laboratory of Marine Eco-environmental Science and Technology, Marine Bioresource and Environment Research Center, First Institute of Oceanography, Ministry of Natural Resources, Qingdao 266061,China
2 Laboratory of Marine Drugs and Bioproducts, Qingdao National Laboratory for Marine Science and Technology, Qingdao 266071, China
Abstract The content and distribution pattern of rare earth elements (REEs) in surface sediments from the Eastern and Western Pacific Ocean, the Northern and Southern Atlantic Ocean, and the Southwestern Indian Ocean were explored and the resources and geochemical characteristics of REEs in deep-ocean sediments from different oceans were studied. The total REE abundances (∑REE) in the different oceans ranged as follows: Eastern Pacific, 56.88-500.02 μg/g; Western Pacific, 290.68-439.94 μg/g; Northern Atlantic, 55.33-154.90 μg/g; Southern Atlantic, 40.83-69.30 μg/g; and Southwestern Indian Ocean, 20.24-64.76 μg/g. Their corresponding LREE (La-Eu)/HREE (Gd-Lu) average values were 5.18, 5.86, 9.01, 5.21, and 4.59, which indicated that the light REEs were all evidently enriched. δEu and δCe showed slight Eu-negative anomalies and significant Ce-positive anomalies in all sediments. Although the contents of REEs in the sediments varied among the different oceans, the distribution patterns of REEs were similar, and the correlation coeき cient was greater than 0.929 0. In the Eastern Pacific sediments, ΣREE showed a significantly positive correlation with Co, Cu, Zn, Mn, Mo and a weak correlation with Fe. In the Western Pacific and Southern Atlantic sediments, ΣREE presented no obvious correlation and a weakly negative correlation with Co, Cu, Zn, Mn, Mo and Fe, respectively. ΣREE in the Southwestern Indian Ocean sediments positively correlated with Cu, Zn, Mn, Mo, Fe, and had a weakly negative correlation with Co.
Keyword: rare earth elements (REE) geochemistry; distribution pattern; REE fractionation; marine sediment
1 INTRODUCTION
Rare earth elements (REEs) are of great geological, technological, and strategic interest and have been identified as crucial and strategic natural resources (German et al., 1990; Mills and Elderfield, 1995; Dubinin and Sval’nov, 2000; Hathorne et al., 2015). The global demand for REEs is increasing for greenenergy products and novel electronic devices (Hein et al., 2013; Szamalek et al., 2013). One of the possible sources of REEs are cobalt-rich sea mount ferromanganese crusts (Kato et al., 2011; Balaram et al., 2012; Bau et al., 2014; Abbott et al., 2015). These formations are unconventional ores abundant in the deep ocean. The chemical fractions of REEs in deepocean sediments strongly depend on redox or other environmental conditions because they control or influence the adsorption, desorption, complexation, or coprecipitation of chemical fractions (Nozaki and Alibo, 2003; Hara et al., 2009; Singh, 2009; Bai et al., 2015). Thus, REEs are present in several different fractions and associated with various geochemical characteristics (Zhang and Wang, 2001; Zhuang et al., 2005; Akagi et al., 2011; Basak et al., 2015; Liu et al., 2015). Ce and Eu are sensitive indicators of the redox conditions in the depositional environments because of their two oxidation states. Absolute REE concentrations in some naturally materials (e.g., North American shale composite and chondrite), which are usually used in the marine geochemistry, should be normalized to better observe REE fractionation processes (Lan and Shen, 2002; Nozaki and Alibo, 2003; Li et al., 2015).
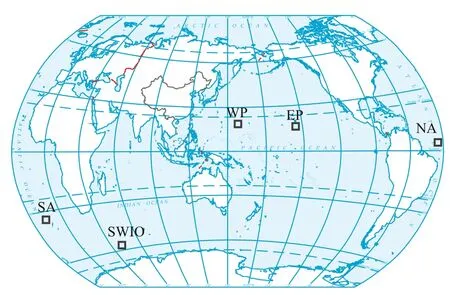
Fig.1 The research sea area
Some studies have so far reported that REEs are abundant in different ocean sediments, but most of these studies have focused on mineral exploration and assessment surveys (German et al., 1999; Szamalek et al., 2013). The distribution differences, distribution patterns, and correlation of REEs in sediments across oceans, such as the Atlantic, Indian, and Pacific oceans, are rarely reported. Therefore, this study was conducted to investigate the correlation of REEs in sediments of different oceanic plates by systematically analyzing the content and distribution patterns of these elements. The relationships between REEs and other mineralized metals in marine sediments in different oceans were also analyzed. This study could provide a basis for intensively studying of the deposition process and environmental behavior of REEs in deep-ocean sediments.
2 MATERIAL AND METHOD
2.1 Instruments and reagents
Inductively coupled plasma mass spectrometer (America, Agilent 7500a). Vacuum freezing dryer (America, Labconco Co.) and AL104 electronic analytical balance (Mettler-Toledo) were also used in the experiment. The samples were digested by a MARS microwave digestion instrument (America, CEM Co.). Pure water produced by a Milli-Qultra pure water treatment system (Milipore Co., 18.2 MΩ·cm) was used throughout the experiment.
Standard solution of rare earth elements (10 mg/L) and internal standard solution of Re (10 mg/L) (SPEX CertiPrep Co., America). Concentrated nitric acid (GR) and H2O2(GR) (Merck, Germany). Liquid argon (99.999%) and standard substance for REEs in sediments (Yellow Sea marine sediments, GBW07333).
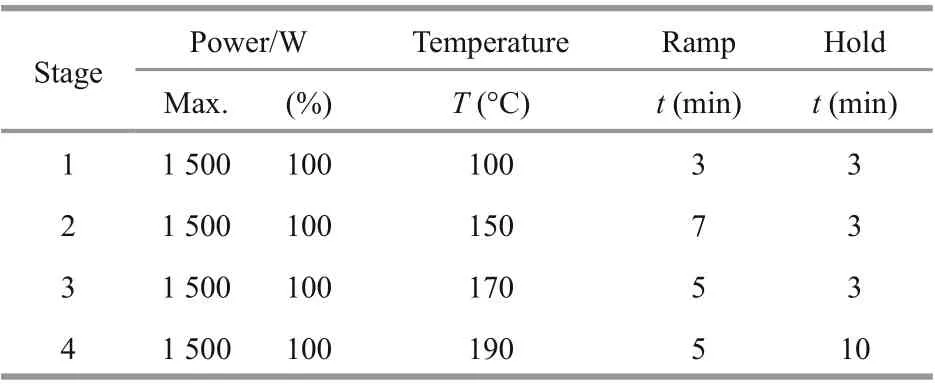
Table 1 The working parameters of microwave digestion
2.2 Study area and sample collection
In the present study, 46 surface sediment samples were collected from Eastern Pacific (10 stations), Western Pacific (10 stations), Northern Atlantic (3 stations), Southern Atlantic (8 stations), and Southwestern Indian Ocean (15 stations) in the ocean voyage (Fig.1), and they were used to study the distribution patterns and geochemical characteristics of REEs. All surface sediment samples were collected by box sampler, and then the sediment samples were frozen under -20 °C on the spot.
2.3 Sample preparation and measurement
The sediments were ground to fine powder using a pestle in an agate mortar after being dried to a constant weight at 60 °C. Then, 0.10-g powdered samples were digested by microwave system with a mixture of 6-mL HNO3, 2-mL H2O2and 1-mL HF in Teflon digestion vessels (CEM, digestion procedures in Table 1). Subsequently, the mass of digestion solution was fixed to 25 g with ultrapure water. The REE and other trace metal contents were determined using ICP-MS (Agilent ICP-MS 7500a). Meanwhile, 5-μg/L Re element was considered as the internal standard element.
The REE contents in certified reference materials (Yellow Sea marine sediments, GBW07333) were measured to verify the accuracy and precision of the analytical method. The results of the standard reference substance showed that the recoveries of all REEs ranged from 89.42% to 110.81%. The standard deviation was less than 9% ( n=3), confirming the good repeatability of the methods.
3 RESULT AND DISCUSSION
3.1 Concentration and eigenvalue of REEs in sediments
The REE contents of all the sediment samples are shown in Tables 2-4. The total REEs (ΣREE) of the surface sediments varied between 56.88 and500.20 μg/g in the Pacific sediments (20 stations), LREE ranged between 44.50 and 408.40 μg/g, and HREE varied between 12.38 and 91.80 μg/g. ΣREE of the surface sediments varied between 40.83 and 154.90 μg/g in the Atlantic sediments (11 stations), LREE varied between 34.17 and 142.22 μg/g, and HREE varied between 6.39 and 12.68 μg/g. The ΣREE of the surface sediments varied between 20.24 and 64.76 μg/g in the Indian Ocean sediments (15 stations), LREE varied between 14.04 and 56.86 μg/g, and HREE varied between 4.48 and 9.59 μg/g. The average values of ΣREE in the Pacific, Atlantic and Indian Ocean sediments were 326.14, 64.23, and 35.30 μg/g respectively, which showed that Pacific Ocean sediments were rich in REEs in the study areas. Liu (1982) studied the content and distribution of REEs in the deep sea sediments of the eastern Pacific Ocean. The results show that the content of total REEs in zeolite clay, siliceous clay and calcium siliceous clay were 472.58, 314.68, and 183.82 μg/g, respectively. The concentration range of REEs in the sediments of the Central Pacific Basin were from 57.42 to 804.40 μg/g (Shen, 1990), and Li et al. (2016) obtained the concentration range of total REEs in the sediments of the bay of Bengal was from 93.90 to 220.80 μg/g. Compared with the results of this study, the content of REEs in the adjacent marine sediments showed a similar order of magnitude. In our study, LREE (La-Eu)/HREE (Gd-Lu) ranged as follows: Pacific sediments, 3.59-6.75 (mean value, 5.52); Atlantic sediments, 4.88-11.21 (mean value, 6.24); and Indian Ocean sediments, 2.27-7.19 (mean value, 4.59). These results demonstrate that all sediments are enriched with LREE. A loss in HREE was also observed. Li et al. (2014) studied the LREE/HREE ratio in the seafloor hydrothermal products from the Southwestern Indian Ridge ranges, the ratio were from 2.06 to 6.16, which was similar to our study in Indian Ocean sediments.
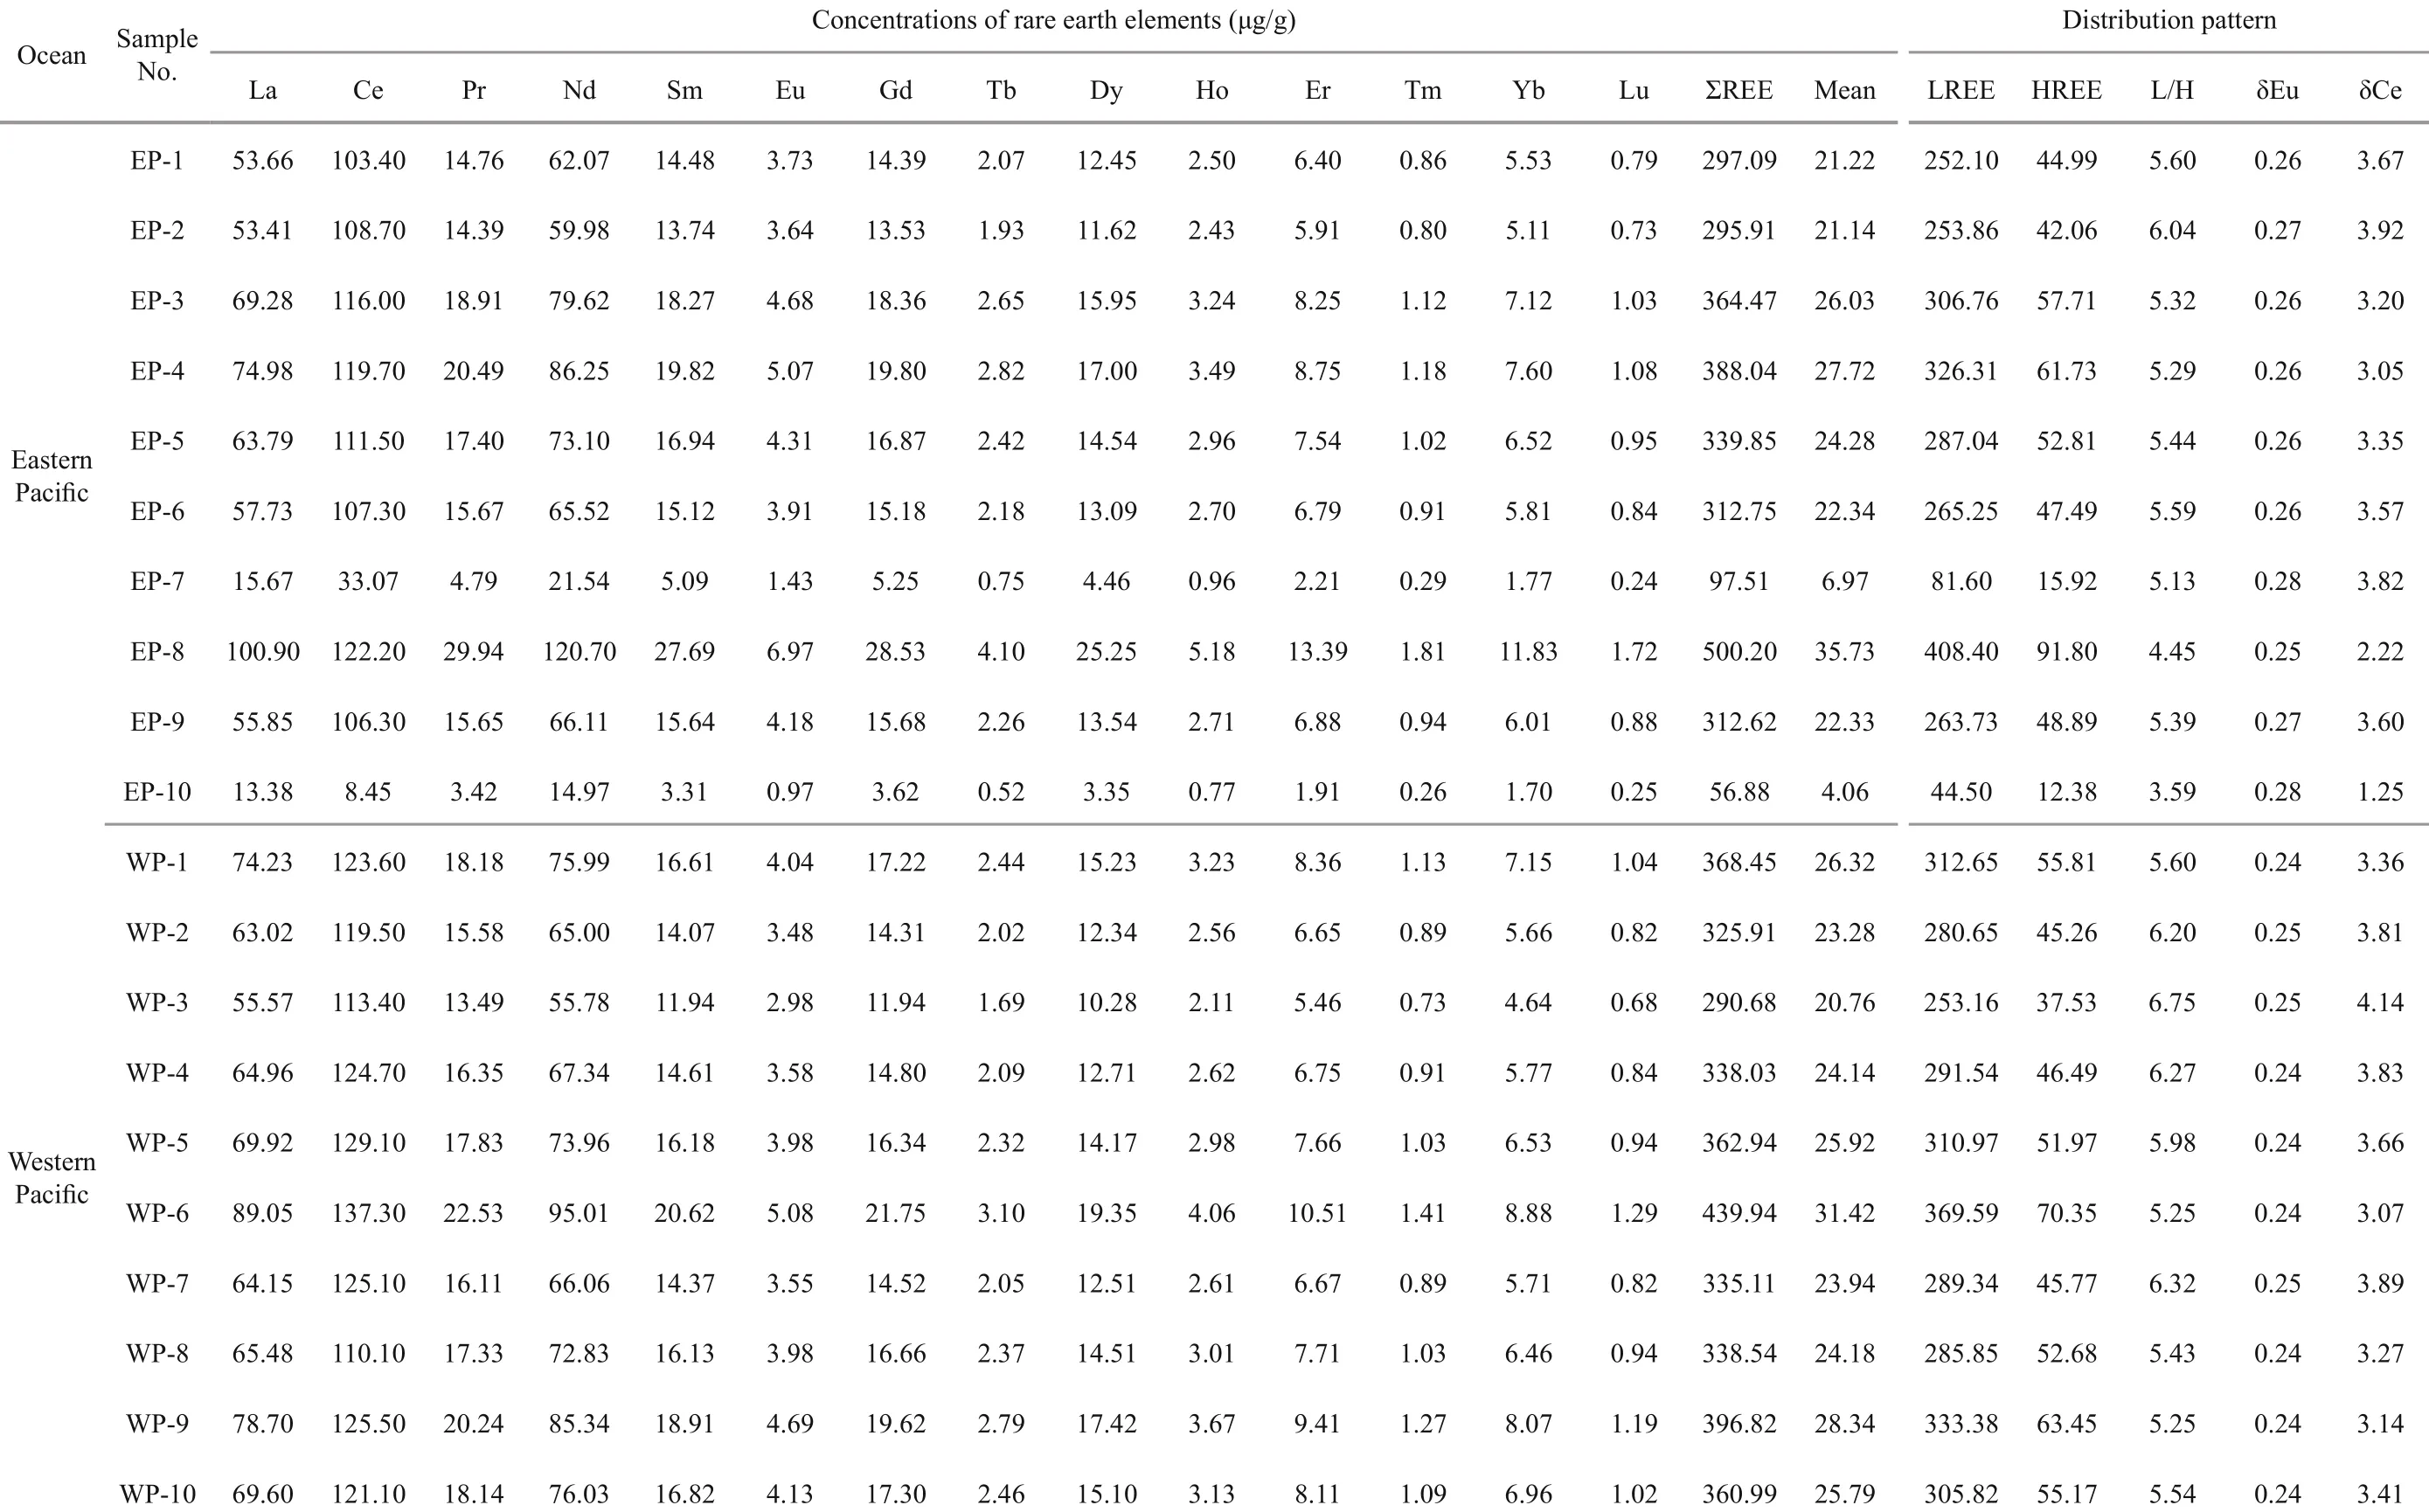
Table 2 The concentrations and distribution pattern of REEs in Pacific sediments

Table 3 The concentrations and distribution pattern of REEs in Atlantic sediments

Table 4 The concentrations and distribution pattern of REEs in Indian Ocean sediments
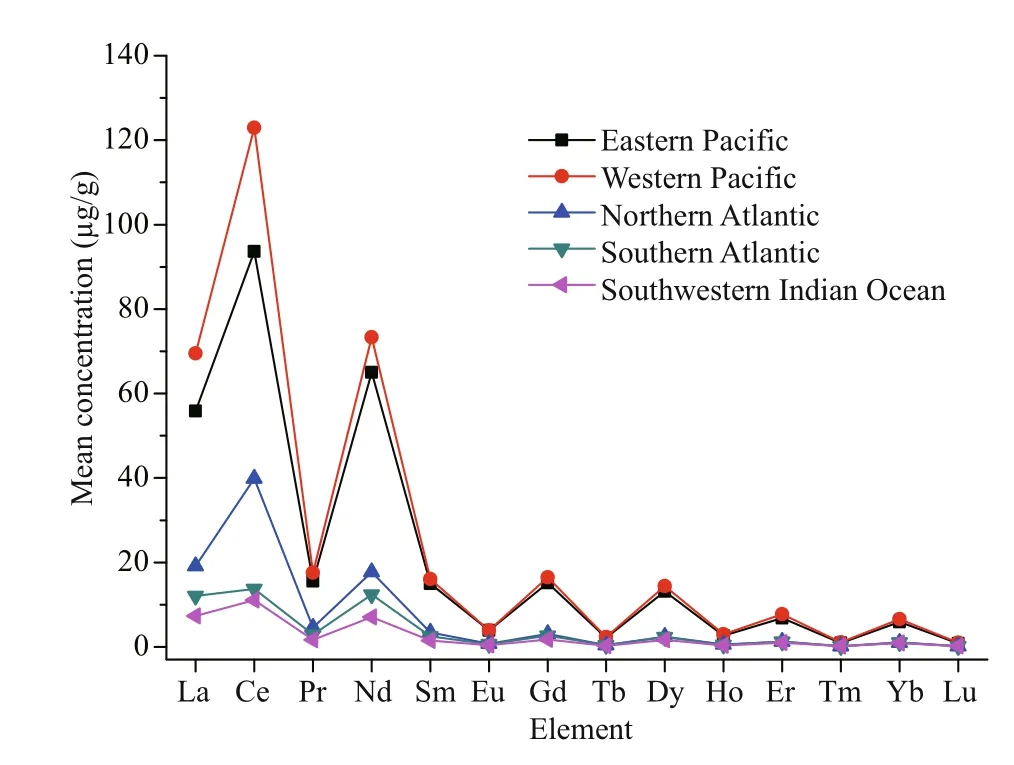
Fig.2 Average concentrations of REEs in different ocean sediments
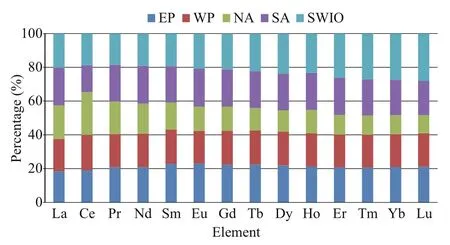
Fig.3 Distribution ratio of REEs
The Eu3+in the sediments can be reduced to Eu2+under strong reducing conditions. The Ce3+is easily transformed into Ce4+in seawater, such that iron or manganese oxides precipitate, leading to a negative Ce anomaly in seawater (Munksgaard et al., 2003; Mondal et al., 2012; Wang et al., 2014). Thus, δEu and δCe anomalies are important indices to study the alteration in the weathering degree and changing conditions of oxidation-reduction in the sedimentary zones. In this study, the mean values of δEu were 0.25 (RSD=5.33%), 0.26 (RSD=9.32%), and 0.26 (RSD=3.87%) in the Pacific, Atlantic, and Indian Ocean sediments. The values of δCe ranged as follows: Pacific sediments, 1.25-4.14 (mean value, 3.36); Atlantic sediments, 2.19-4.59 (mean value, 2.82); and Indian Ocean sediments, 2.51-12.15 (mean value, 3.28). These results indicate a positive anomaly of Ce in the oceans. Thus, all sediments were characterized by slight Eu-negative anomalies and significant Ce-positive anomalies.
3.2 Distribution characteristics and correlation
The variation in the distribution of REEs in the different marine sediments was consistent (Fig.2), but the concentration of REEs was higher in Pacific sediments than in the other sediments. The similarity between the Eastern and Western Pacific regions was higher than that between other regions. Figure 3 shows that the different marine sediments had different allocation proportions of REEs. High content ratios were as follows: La, 18.84%-22.80%; Ce, 26.03%-42.16%; and Nd, 18.79%-23.50%. Tb, Ho, Tm, and Lu had low content ratios of less than 1%.
The similarity in the patterns of the REE distributions in all sampling areas was determined through similarity calculation and comparison. The similarity coeき cient of the REE distribution patterns was 0.929-0.997(Table 5), which indicated that REEs had a high degree of similarity in marine sediments.
3.3 Distribution pattern of REEs
An abundance coeき cient curve of REEs could be established by using the normalized ratio of the REE contents in sediments, chondrite or other minerals. The distribution curve of REEs could be graphically represented to study their distribution patterns and inter-relationships in sediments (Ren et al., 2015). The coeき cient curve of the REE content could also display the changes in abundance between REEs with odd and even atomic numbers and map the geochemical differentiation of the sediments to the original rare earth composition. The LREE (Fig.4) showed evident negative slopes, which confirmed that the enrichment degree of the LREE was higher than that of the HREE. In all stations, Gd was highlighted by a weak positive anomaly as it separated from the REEs because of its alkaline level and the valence change in Gd with oxidation and reduction (Gd4+-Gd3+-Gd2+). Figures 4-5 show that the distribution patterns of REEs in all sediments were consistent, and the REE forms also exhibited obvious regularities. The REE distribution patterns indicated that the factors controlling the REE partitioning pattern were consistent.
3.4 Correlation of REEs with trace metals
The REE distribution patterns in marine sediments are largely controlled by the sediment provenance, hydrothermal fluxes, geochemical interactions between seawater and sediments and diagenetic processes (Dubinin, 2000; Yasukawa et al., 2014; Guo et al., 2016). Especially, the redox environment of sediments affects the adsorption and desorption of REEs and thedissolution of rare earth-rich particles, which leads to the re-differentiation of REEs (Himmler et al., 2013; Soyol-Erdene and Huh, 2013). The ratio relationship between redox sensitive elements in trace elements is an important information to measure sedimentary environment, and the content of trace elements in sediments is related to redox environment (Algeo and Maynard, 2004; Tribovillard et al., 2006). In order to explore the sedimentary mechanism of REEs, the relationships between concentration ratios of REEs vs. other elements are presented in Figs.6-9. In the Eastern Pacific sediments, ΣREE showed a significantly positive correlation with Co, Cu, Zn, Mn, and Mo, and a weak correlation with Fe. In the Western Pacific sediments, no obvious correlation was found between ΣREE and Co, Cu, Zn, Mn, Mo, Fe.

Table 5 The similarity degree of REEs contents (r )
In the Southern Atlantic sediments, ΣREE were weakly and negatively correlated with Co, Cu, Zn, Mn, Mo, and Fe, and their correlation values were from -0.397 9 to -0.047 4. The total mean concentration of ΣREE in the Southwestern Indian Ocean sediments was positively correlated with Cu, Zn, Mn, Mo and Fe but was weakly and negatively correlated with Co. Especially, Zn and Mo had higher correlation coeき cients with ΣREE, the value of r were 0.725 3 for Zn-ΣREE and 0.847 6 for Mo-ΣREE. The correlations could indicate that the ΣREE composition in the sediment was or was not controlled by lithogenic mineral composition. The weak correlation demonstrated that the ΣREE composition was hardly controlled by the lithogenic mineral composition in the Southern Atlantic sediments. In other marine sediments, the lithogenic minerals were obviously different.

Fig.6 Correlations and linear regressions between ΣREE and Co, Cu, Zn, Mn, Mo, and Fe in Eastern Pacif ic sediments
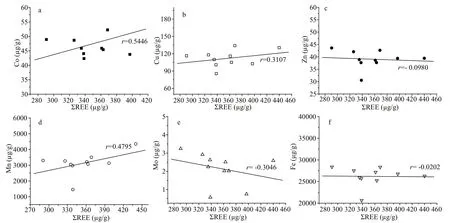
Fig.7 Correlations and linear regressions between ΣREE and Co, Cu, Zn, Mn, Mo, and Fe in Western Pacif ic sediments
4 CONCLUSION
The contents and distribution patterns of REEs in sediments of the different oceans were analyzed. The normalized values of the REE geochemical parameters and the correlation between REEs and other trace elements were also studied. Differences were found in the contents of REEs in different ocean sediments. The light REEs were all evidently enriched. All sediments were characterized by slight Eu-negative anomalies and significant Ce-positive anomalies. The correlation between REEs and other trace elements varied in different ocean sediments. The results could provide a basis for further studying the geochemical characteristics and environmental effects of rare earths in marine environments.

Fig.8 Correlations and linear regressions between ΣREE and Co, Cu, Zn, Mn, Mo, and Fe in Southern Atlantic sediments
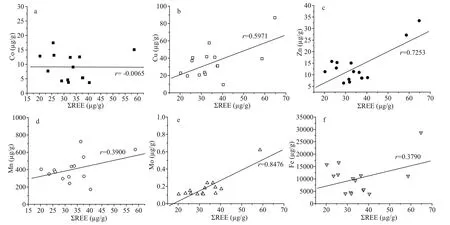
Fig.9 Correlations and linear regressions between ΣREE and Co, Cu, Zn, Mn, Mo, and Fe in Southwestern Indian Ocean sediments
5 DATA AVAILABILITY STATEMENT
The datasets generated and analyzed during the current study are available from the corresponding author on reasonable request.
6 ACKNOWLEDGMENT
We would like to thank the Project for Overseas Innovative Talents of the Taishan Scholars, China. We were also very grateful for the great support of the oceanic voyage.
杂志排行
Journal of Oceanology and Limnology的其它文章
- Influence of sequential tropical cyclones on phytoplankton blooms in the northwestern South China Sea*
- Simulated perturbation in the sea-to-air flux of dimethylsulfide and the impact on polar climate
- Performance of ecological restoration in an impaired coral reef in the Wuzhizhou Island, Sanya, China*
- Investigating factors driving phytoplankton growth and grazing loss rates in waters around Peninsular Malaysia
- Effects of oxytetracycline dihydrate and sulfamethoxazole on Microcystis aeruginosa and Chlamydomonas microsphaera*
- Reproductive cycle of Ophiopholis mirabilis (Echinodermata: Ophiuroidea) in Zhangzi Island area, northern Yellow Sea*
