Application of an ice-ocean coupled model to Bohai Sea ice simulation*
2021-02-22BinJIAXueenCHEN
Bin JIA, Xue’en CHEN
College of Oceanic and Atmospheric Sciences, Ocean University of China, Qingdao 266100, China
Abstract The HAMSOM (Hamburg Shelf Ocean Model), a high-resolution regional ice-ocean coupled model, was applied to investigate the seasonal evolution of Bohai Sea ice for winter 2015/2016. HAMSOM was initialized with monthly climatological temperature and salinity data from WOA13 and driven by hourly meteorological data obtained from the NCEP above the sea surface and tides at the open boundary. The ice model used here is a modified Hibler-type dynamic-thermodynamic sea ice model based upon viscous-plastic rheology. The ice extent, concentration, area, thickness, length of ice season as well as the distance between the top of Liaodong Bay (North China) and the outer ice edge line were simulated and compared with the observed data. Three types of modeling experiments were carried out to investigate the effects of wind, tide, and both wind and tide on Bohai Sea ice. The results show that wind, as both a dynamic and a thermodynamic factor, has a significant impact on the ice thickness, ice area, and ice-freezing and ice breakup dates as well as the ice velocity, while tides are a dynamic factor that influences only the ice velocity. During the severe ice period, the wind speed intensity increased by 25%, the average ice thickness thickened by approximately 4.0 cm in Liaodong Bay, approximately 2.1 cm in Bohai Bay and approximately 2.5 cm in Laizhou Bay, and the total ice coverage area and total ice actual area increased by about 2×10 4 km 2 and 1.4×10 4 km 2, respectively. While the tidal amplitude intensity increased by 25%, the average ice velocity increased by approximately 0.1 m/s.
Keyword: Bohai Sea ice; ice-ocean coupled model; effects of wind and tides
1 INTRODUCTION
The Bohai Sea is a semi-enclosed sea in northern China in the East Asian monsoon region and includes Liaodong Bay, Bohai Bay, Laizhou Bay, the Central Basin and the Bohai Strait. The Bohai Sea and North Yellow Sea are the lowest-latitude seas where ice can form in winter (Wang et al., 2000). Sea ice in the Bohai Sea is seasonal. The ice season often starts by the end of November or the beginning of December and lasts until the middle or the end of March of the following year. Sea ice sometimes severely obstructs shipping, and activities of offshore oil and gas exploration at the sea, in which the coastal areas are an important economic development zone in China (Bai and Wu, 1998; Li et al., 1999). In recent decades, Arctic Sea ice has undergone ongoing loss (Simmonds, 2015). The influence of Arctic warming on the midlatitude atmospheric circulation system has attracted attention (Luo et al., 2017; Yao et al., 2017). Climate changes in the polar regions are completely connected to mid-latitude atmospheric circulation, causing changes to the regional climate system (Collins et al., 2018; Screen et al., 2018), which may influence the climate system of the Bohai Sea. Therefore, sea ice in the Bohai Sea may be affected by polar climate change. Moreover, the Bohai Sea region has a large number of daunting environmental and resource challenges. Unreasonable development has caused ecological and environmental problems such as frequent red tides, heavy metal and oil pollution, eutrophication of water bodies, and a sharp decline in biodiversity in the Bohai Sea (Dong, 2012; Zheng and Liu, 2019). The Bohai Sea has considerable sea ice reserves. Desalinated water can replace some of the water used for ecological and industrial purposes. The development and utilization of sea ice resources has broad prospects and high feasibility (Meng et al., 2016). Therefore, a comprehensive understanding of the dynamic and thermodynamic processes and evolution of the Bohai Sea ice is crucial.
Wu et al. (1998) proposed a sea ice model for three types of ice thickness distributions for operational forecasting based on the dynamic framework of Hibler (1979) and the thermodynamic framework of Parkinson and Washington (1979); Li et al. (1999) coupled this sea ice model with ECOM-si, which was proposed by Blumberg and Mellor (1987). Based on the Arctic ice-ocean coupled model (Wang et al., 2005), Liu (2013) investigated sea ice in the Bohai Sea and North Yellow Sea. Su et al. (2003) coupled the sea ice model proposed by Wu et al. (1998) with the POM ocean model and analyzed the ice parameters of the Bohai Sea for 1998/1999 and 2000/2001 (Su et al., 2005). Liu et al. (2011) analyzed the ice conditions of the Bohai Sea for 1997/1998 to 2008/2009. In this work, an ice-ocean coupled model that comprises the Hamburg Shelf Ocean Model (HAMSOM) and a dynamic-thermodynamic sea ice model written by Backhaus et al. (2008), are used to investigate the ice process of the Bohai Sea in 2015/2016. This sea ice model is based on the dynamic frameworks of Hibler (1979) and Connolley et al. (2004) and the thermodynamic framework of Semtner (1976). Unlike the previous coupled models, it considers salinity variations induced by evaporation, precipitation and river runoff. In addition, the highest horizontal resolution of the existing Bohai Sea ice simulation is 3.7 km×2.8 km (approximately 2′-3′) (Liu et al., 2011). In this paper, the horizontal resolution of the coupled model increases to 1′×1′, approximately 1.8 km in the meridional (north-south) direction and 1.5 km in the zonal (east-west) direction, which can capture the structure and influence of smaller-scale eddies.
The well-developed ice-ocean coupled models help us deepen our understanding of the Bohai Sea ice. The dynamic and thermodynamic interactions between the sea ice, ocean and atmosphere have a significant impact on the prediction of the temperature, salinity and velocity of the ocean, the atmospheric circulation and the movement and evolution of sea ice. Here, we focus on the research status of dynamic mechanisms and interactions. Wang et al. (1985) performed a comparative experiment of the wind speed adaptation factor. It was found that in the case of northerly wind, the increase in the wind adaptation factor leads to an increase in wind speed, increasing the ice thickness at the windward shore of the three bays and extending the outer ice edge in Liaodong Bay; however, the increase in the wind adaptation factor has a little effect on the outer ice edge in Laizhou Bay and Bohai Bay. Li et al. (1999) studied the impact of tides on the Bohai Sea ice and noted that tides are the main component of the current in the Bohai Sea and play a leading role in driving ice, causing the reciprocating motion of ice. Su et al. (2003) found that the influence of the driving of the combination of wind and tides on the outer ice edge is larger than that driven by wind and tides alone. By comparing the ice velocity distributions for different wind directions at different times, it is found that when the wind direction is consistent with the tidal current flow, the velocity of the drift ice is increased. When the tidal current direction is opposite to the wind direction, the velocity of the drift ice is reduced or even reversed. At the same time, the influence of sea ice on the ocean is also explored. By comparing the surface current velocity of the simple ocean model and the coupled model, it can be found that sea ice can reduce and delay the maximum water flow velocity under the ice and make the surface water flow velocity more sensitive to wind. Regarding the effect of waves on sea ice, Liu et al. (1993) found that the non-linear effect of waves causes the ice edges to be steeper. The outer ice edge is more curved, and the fracture of the ice caused by the waves may accelerate the melting of the sea ice and the degradation of the ice edge. Zhang et al. (2016) studied the effect of sea ice on the surface waves of the Arctic Ocean and found that the simulated surface waves are ideal when the model includes ice-induced wave attenuation and the blocking effect of ice on the surface-forcing mechanism. In this paper, on the basis of previous articles, multiple comparative experiments were performed to further explore the influence of wind and tides on Bohai Sea ice to compare the responses of different ice parameters to wind and tides.
This paper is organized as follows. Section 2 describes the ice-ocean coupled model. To show the applicability of HAMSOM to the Bohai Sea, the simulated ice parameters are verified in Section 3. Then, the exploration and comparison of the effects of wind and tides on the Bohai Sea ice are made in Section 4. The conclusions are given in Section 5.
2 ICE-OCEAN COUPLED MODEL
2.1 A brief description of the coupled model
HAMSOM is a three-dimensional, baroclinic, coupled ice-ocean model for Cartesian coordinates that uses an Arakawa C-grid with a semi-implicit numerical scheme. The numerical framework of the ocean model was described by Backhaus (1985). The applications of this model in Chinese waters are mainly concentrated on the Bohai Sea and the South China Sea (Huang et al., 1998; Cai and Wang, 1999; Wei et al., 2001). The ice model presented here is a two-class (ice and open water), viscous-plastic model that takes into account both the dynamic and thermodynamic properties of sea ice. The fundamental sea ice equations, thermodynamic properties and rheology were introduced in detail by Ólason and Harms (2010) and Olason (2016).
The dynamic coupling between ice and ocean occurs through the ice-ocean drag, which is calculated by the ice model. The ice-ocean drag inputs the velocity information from the ocean model to the ice model, reflecting the advection and transmission of sea ice. Thermodynamic coupling between ice and ocean occurs, in general through radiative and heat fluxes. The ocean model transmits the shortwave radiation level, temperature, salinity and surface water velocity to the ice model, while the ice model transmits the SST to the ocean model. Thus, both the ice model and the ocean model take into account the temperature, salinity and velocity of the ocean, and the ocean model also takes into account the changes in temperature and salinity caused by sea ice.
2.2 Model configuration
The latitude and longitude range of the simulated area is 37°N-41.25°N, 117.25°E-122.5°E. The ice process of the Bohai Sea is simulated from November 1, 2015 to March 31, 2016, with a time step of 60 s and a horizontal grid resolution of 1′×1′. The model uses the z (vertical) coordinate, with 12 layers of thicknesses 6 m, 6 m, 6 m, 2 m, 2 m, 2 m, 2 m, 2 m, 10 m, 10 m, 10 m and 10 m.
The external data are sourced as follows:
1) The topography data are interpolated from the high-precision data in the Bohai Sea area provided by the Beihai Branch of the Ministry of Natural Resources of China. The tidal range of the near-shore area of the Bohai Sea is approximately 3 m, which can reach 5 m at the top of Liaodong Bay and Bohai Bay, so wet points with depths of less than 5 m may become dry during low tides. To ensure that each wet point does not become a dry point during any tide, the wet points with a water depth of less than 5 m are set to 5 m.
2) The harmonic constants of eight main tidal constituents at the open boundary are extracted by the MATLAB toolkit Tide Model Driver (TMD) provided by the Oregon State University (OSU) Tidal Data Inversion software (Padman and Erofeeva, 2005).
3) The initial temperature and salinity fields use the monthly climatological temperature and salinity data from the 2013 World Ocean Atlas (WOA13) with a resolution of 0.25° (Johnson and Boyer, 2015).
4) The surface atmospheric forcing fields are interpolated from the hourly climate forecast data provided by the National Centers for Environmental Prediction (NCEP) Climate Forecast System (CFS) with a resolution of 0.2°, including the 2 m air temperature, wind speed, cloud cover, precipitation rate, and specific humidity (Saha et al., 2011).
3 VERIFICATION AND ANALYSIS OF THE ICE EVOLUTION PROCESS
The ocean model HAMSOM was first validated based on barotropic tide, temperature, and salinity observations in the Bohai Sea. Reasonable results show that the model has high applicability in the Bohai Sea. The sea ice evolution process of 2015/2016, which was a typical heavy ice year, is investigated using the ice-ocean coupled model with a high resolution. Ice parameters such as the ice extent, concentration, area, thickness, length of ice season as well as the distance between the top of Liaodong Bay and the ice edge line will be analyzed. Over time, the number of ways to obtain measured sea ice data have gradually increased, and the acquisition methods have gradually improved. Karvonen et al. (2017) present new empirical methods to retrieve sea ice information using synthetic aperture radar (SAR) imagery, a microwave radiometer, and a thermodynamic sea ice model. Satellite remote sensing data, such as those from MODIS, AVHRR, and GOCI, are widely used to monitor sea ice conditions in the Bohai Sea (Yuan et al., 2012; Yan et al., 2019). The observation data for the verification of ice parameters in this paper are from satellite remote sensing data and in situ observation data.
3.1 Ice-freezing date, ice-ending date and length of ice season
Table 1 shows the comparison between the simulation results and the measured data of ice-freezing date, ice-ending date and length of ice season. The simulated ice-freezing date is consistent with the observed measurement, while the simulated ice-ending date is 8 days ahead of the true date. The satellite images show that there was only a trace of sea ice in Liaodong Bay at the beginning of March, and its thickness was too thin to be monitored. We speculate that the minimum water depth, which is set to 5 m in the model, is much larger than the actual depth, causing the model to fail to capture the thinner ice located in the shallowest shore water and calculating an early ice-ending date.

Table 1 Comparison of the simulated ice-freezing date, ice-ending date and length of ice season with the observed data
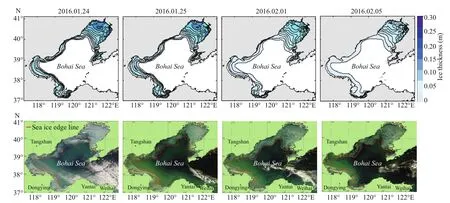
Fig.1 Simulated ice coverage (top) and satellite images (bottom) on January 24 and 25, February 1 and 5, 2016
3.2 Ice extent, ice area and ice coverage area
To verify the simulated sea ice extent, four satellite images mostly free from clouds (January 24 and 25, and February 1 and 5) are selected. Comparing the simulated ice extent and ice edge line of Bohai Sea with those in the satellite images (Fig.1), we can find that the simulated results are in fairly good agreement with the actual results of the satellite images.
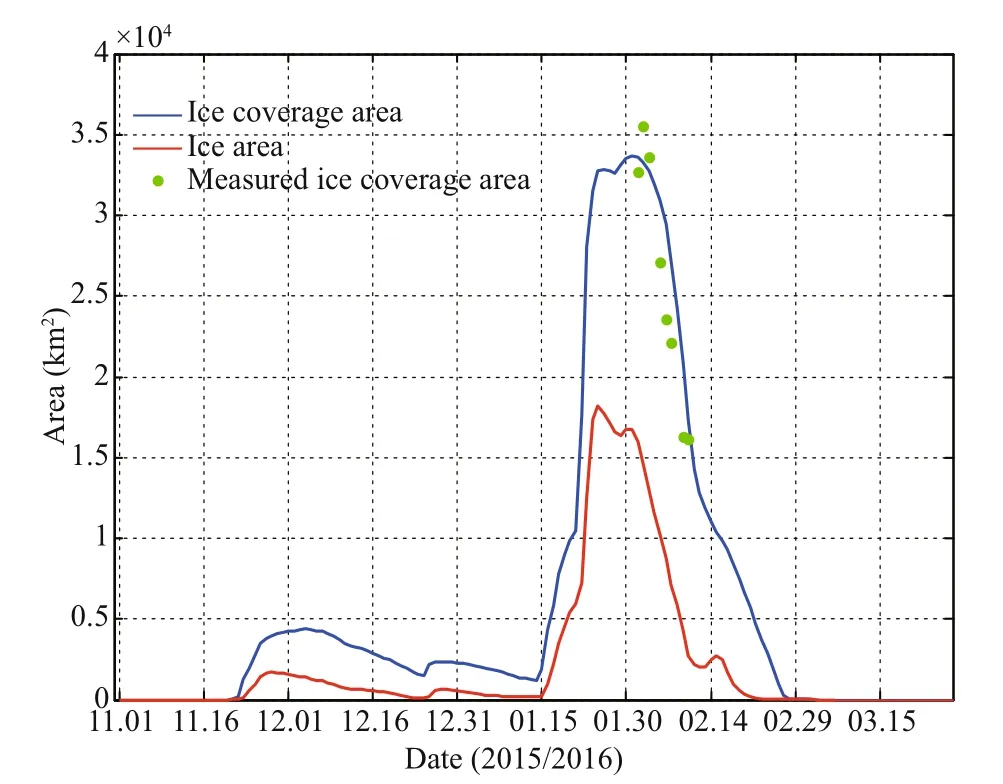
Fig.2 Time series of the sea ice area and sea ice coverage area in the Bohai Sea
To quantitatively describe the ice in the Bohai Sea, the definitions of the ice coverage area and ice area are introduced (Liu et al., 2011). The ice coverage area refers to the sum of the area of each grid point where sea ice appears, regardless of its concentration, while the ice area refers to the sum of the area of each grid point where sea ice appears multiplied by its concentration. Figure 2 shows the time series of the ice coverage area and ice area during the winter of 2015/2016. The simulated ice coverage area reaches its peak during mid-to-late January to mid-February, and the simulation results are in agreement with the actual measurements, indicating that the model can reproduce the trend in the ice coverage area.
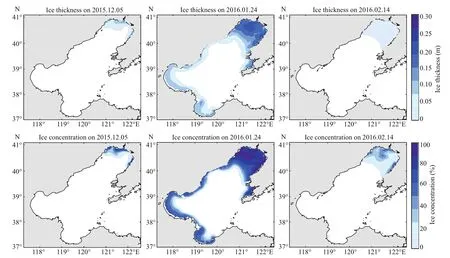
Fig.3 Simulated ice thickness (top) and ice concentration (bottom) of the Bohai Sea on December 5, 2015, and January 24 and February 14, 2016
The growth period, severe period and ablation period for Bohai Sea ice are defined based on the ice coverage area. We consider that the ice coverage area of the severe period is greater than or equal to 2×10⁴km2, the period before the severe period is the growth period, and the period after the severe period is the ablation period. Therefore, the severe period for Bohai Sea ice is from January 23 to February 9, the growth period for Bohai Sea ice is from November 23 to January 22, and the ablation period for Bohai Sea ice is from February 10 to March 1. Obviously, the growth epoch of Bohai Sea ice is longer than the melting epoch.
3.3 Ice thickness and ice concentration
To describe the distribution of Bohai Sea ice during its growth period, severe period, and ablation period in detail, the ice thickness and ice concentration of three selected days: December 5, January 24, and February 14, are shown in Fig.3.
In early winter, the shallow water in the Bohai Sea is fully mixed vertically. The formation of sea ice generally starts from shallow water along the coast and then gradually expands towards deep water. An increase in the ice concentration basically corresponds to increasing ice thickness and decreasing epoch. The ice thickness and ice concentration of the three bays gradually decrease from the top of the bays to the open sea. During the ice growth period, sea ice began to emerge from the top of Liaodong Bay, followed by Bohai Bay and Laizhou Bay. During the severe ice period, the coverage of sea ice reached a maximum, and the ice concentration at the top of Liaodong Bay reached 80% or more. Then, the sea ice in Bohai Bay began to melt first, followed by Laizhou Bay and Liaodong Bay during the ice ablation period.
3.4 The distance between the top of Liaodong Bay and the outer ice edge
The minimum distance between the top of the bay and the ice edge from the water interior (or the ice edge distance in short) can reflect the sea ice extent and quantitatively describe the ice developing in the Bohai Sea. Normally, Liaodong Bay, whose icefreezing date, ice-ending date and length of ice season are the same as those of the entire Bohai Sea, has the most severe ice condition among the three bays. Therefore, the time series of the ice edge distance of Liaodong Bay is the focus here.
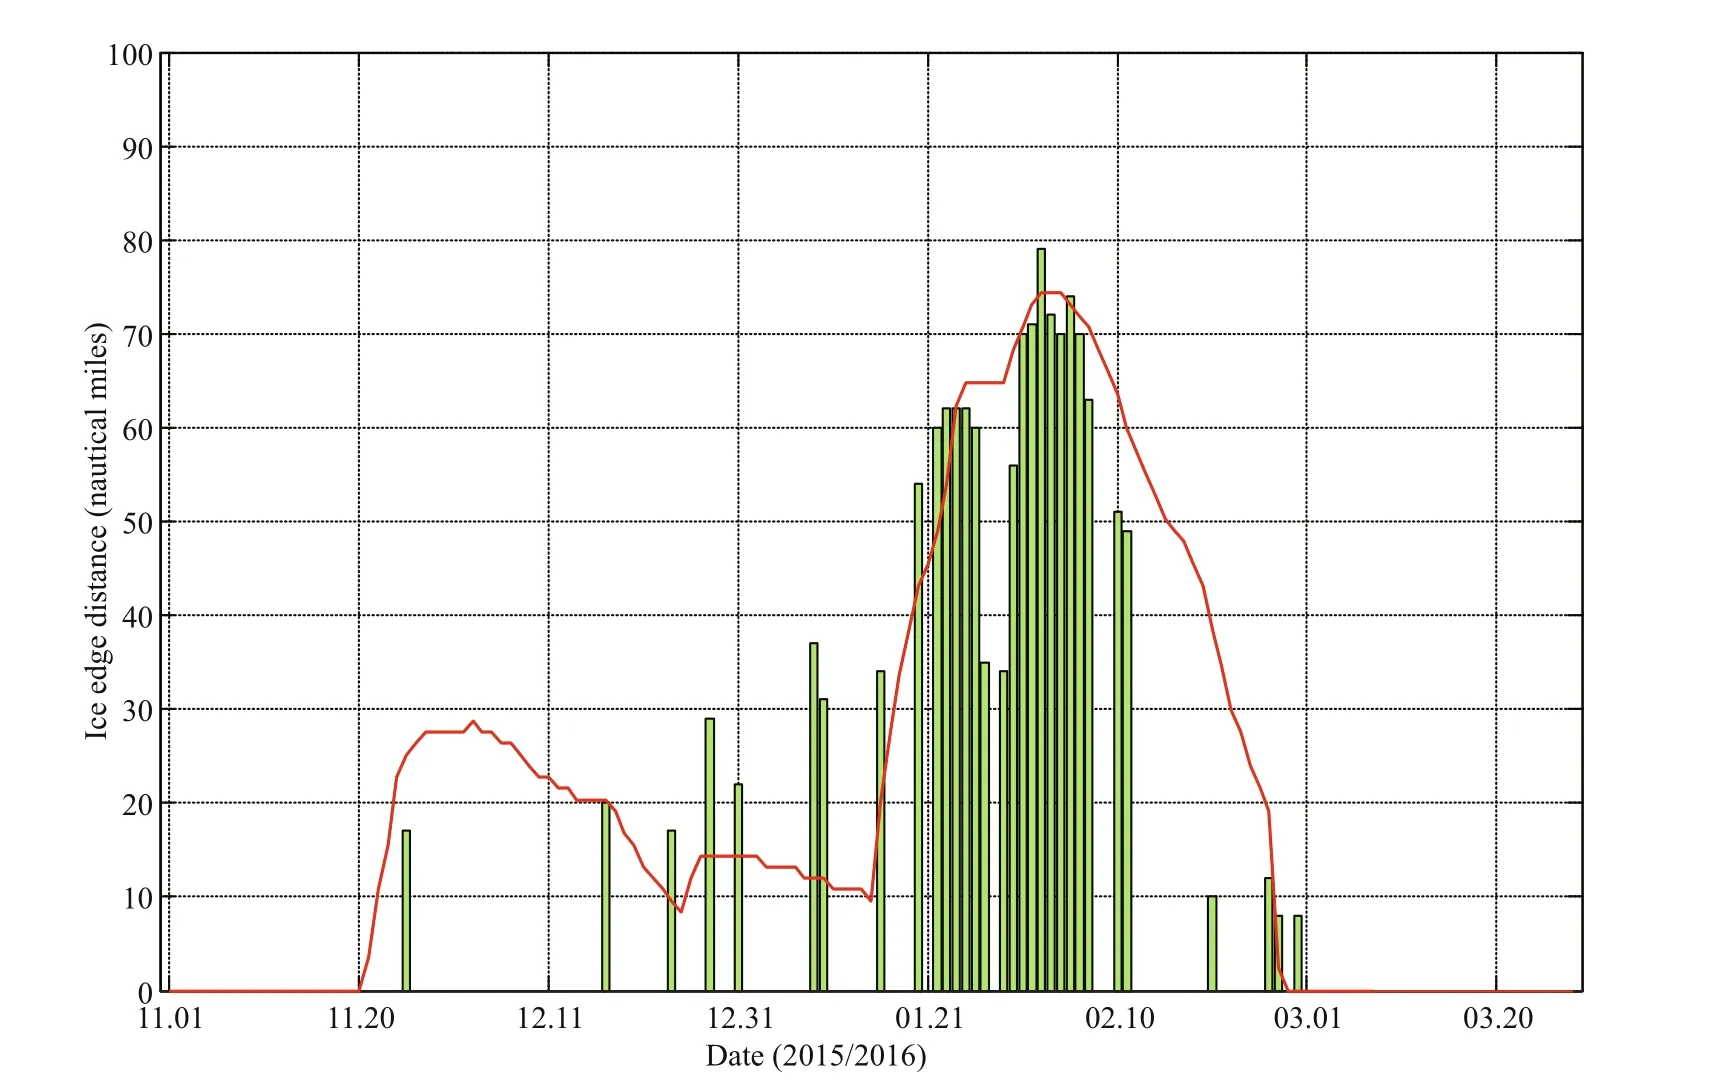
Fig.4 Time series of the distance between the top of the bay and the outer ice edge in Liaodong Bay
The variation in the ice edge distance over time is plotted in Fig.4. The trend in the ice edge distance of Liaodong Bay calculated by the model results is basically consistent with the observed trend. However, the predicted distance from the model is less than that observed distance from the end of December to the end of the next January and is slightly greater than that observed from early February to mid-February. The reason for this difference may be due to the deviation in the model input atmospheric forcing field.
4 EFFECT OF WIND AND TIDES ON BOHAI SEA ICE
4.1 Comparative experiments with different driving fields
The external forces of sea ice consist of air and water stresses, the Coriolis force, internal stress and the sea surface height gradient force. From this perspective, the effect of the atmosphere on sea ice is mainly realized as that of wind on sea ice, while the effect of the ocean on sea ice is mainly realized as that of current (mainly composed of tides in the Bohai Sea) on sea ice. Tides have a leading role in the instantaneous ice drift in the Bohai Sea (Li et al., 1999; Su et al., 2003). Here, we performed three types of modeling experiments; they all simulated the ice evolution process during the winter of 2015/2016, and the difference is the driving field. The first experiment is driven by the combination of wind and tides, the second experiment is driven only by wind, and the third experiment is driven only by tides.

Fig.5 Ice trajectories of the three experiments
Figure 5 shows the ice trajectories of an ice point located at (40.25°N, 121.15°E) during the period of a tidal cycle (approximately 12 hours) for the three comparative experiments. The black line, which represents the ice trajectory driven by wind and tides, is similar to the red line, which represents that driven only by tides; they all reverse during a tidal cycle. This finding indicates that the tidal current plays an important role in the drift path and velocity of ice, which is the main cause of the open elliptical gyration path of the ice. The influence of wind on the movement of ice is very small, resulting in movement in only one direction (seen from the blue line). Although wind has little effect on the inner ice area, it is still the main driving factor for ice displacement. Moreover, the ice point trajectory driven by both wind and tides is the superimposition of the simple wind-driven and tide-driven trajectories.
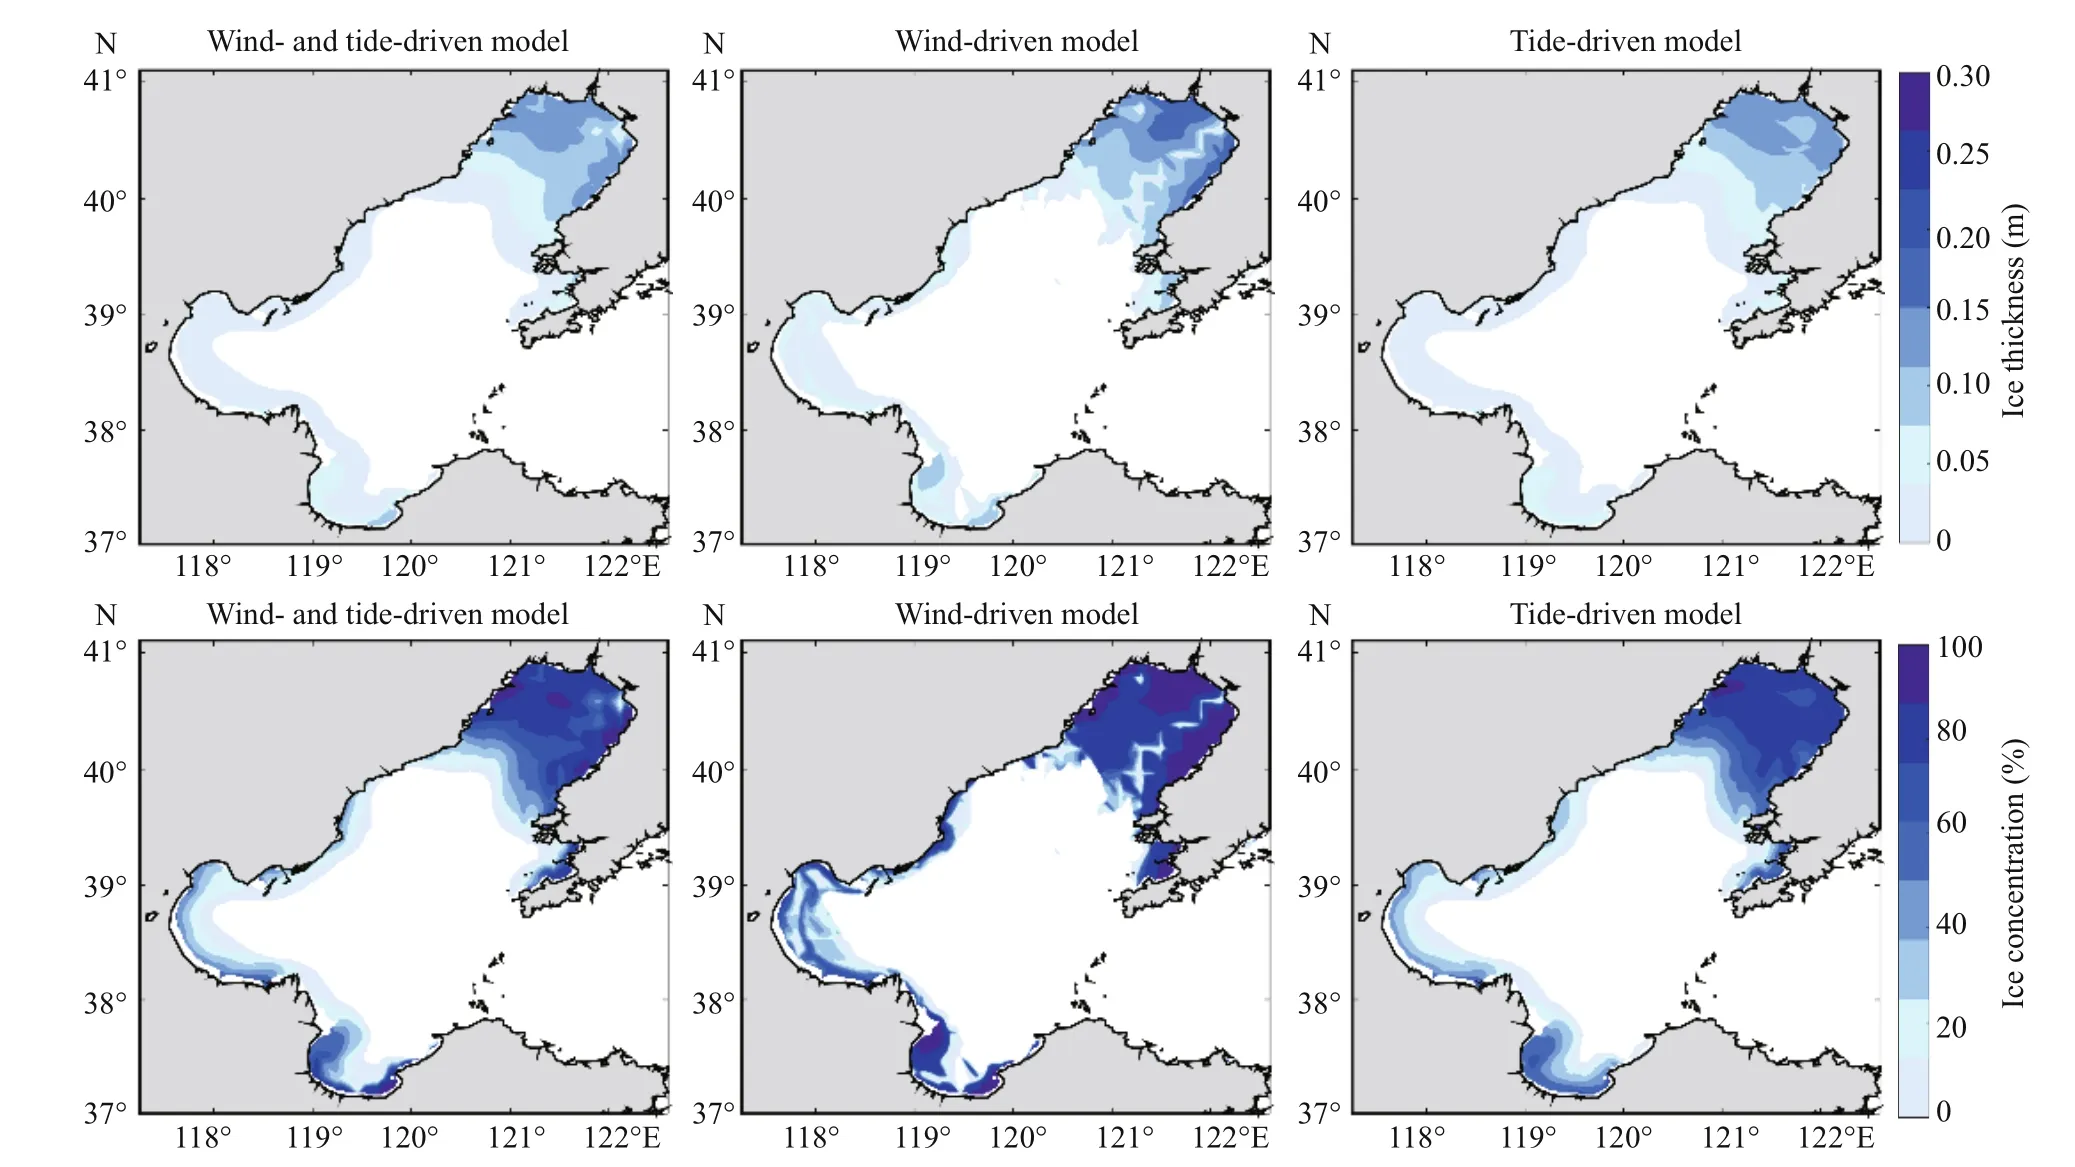
Fig.6 Ice thickness distribution (top) and the ice concentration distribution (bottom) on February 2, 2016, for the different models
We can see from the distribution of the ice thickness and ice concentration (Fig.6) that the simple winddriven sea ice is more fragile, especially in Liaodong Bay. Under the simple wind-driven model, two northsouth inter-ice leads appear in the middle of Liaodong Bay, and an east-west inter-ice lead appears in Laizhou Bay, causing ice to accumulate towards the shore, contrary to the situation in which the ice thickness contours coincide with the water depth contours under the simple tide-driven model. Compared with the situation driven only by tides, the ice thickness and ice concentration on the east coast of Liaodong Bay driven only by wind increased by approximately 5-10 cm and 20%-30%, with approximately 5 cm and 10% increases in the middle area of the north coast of Liaodong Bay and approximately 5 cm and 30% increases on the west and east coasts of Laizhou Bay, respectively, which indicates that wind is the main dynamic factor leading to sea ice breakage. In addition, the outer edge of sea ice driven only by tides is very similar to that driven by the combination of wind and tides. However, the simple tide-driven ice thickness is thinner, and the ice concentration is smaller. The reason may be that wind is also a key factor affecting the thermodynamic changes in sea ice. In general, the distributions of the ice thickness and ice concentration driven by wind and tides are the superimposition of the simple wind-driven and simple tide-driven thickness and concentrations, respectively.
The ice coverage area and ice area of the three experiments are also compared here (Fig.7), and they were found to reach peaks at the end of January and early February. The simple tide-driven sea ice coverage is the largest, the wind- and tide-driven sea ice coverage is the second largest, and the simple wind-driven sea ice coverage is the smallest. For the ice area, the situation is the opposite: simple winddriven ice area is the largest, wind- and tide-driven ice area is the second largest, and simple tide-driven ice area is the smallest. The ice concentration from the simple tide-driven model is the smallest and that from the simple wind-drive model is the largest. Moreover, the delay in the ice-ending date and the slowest melting speed of sea ice from the wind-driven model illustrate that wind can indeed affect the growth and melting of ice as a thermodynamic factor, while the reciprocating motion of ice caused by tides accelerates ice melting.
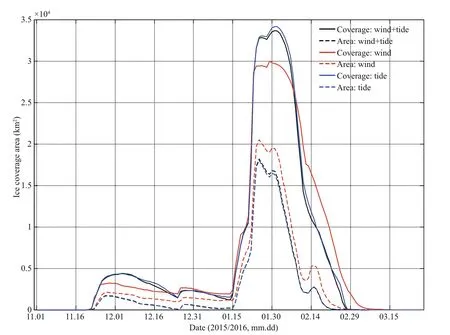
Fig.7 The time series of the ice coverage area (solid line) and the ice area (dotted line) from the different models
4.2 Experiments with different wind and tide intensities
In this part, we performed two groups of experiments in which the driving f ields had different intensities. In the f irst group of experiments, we changed the wind speed intensity to 5 categories: the normal wind speed, 0.5, 0.75, 1.25 and 1.5 times the wind speed. The same changes were made to the tidal amplitude in the second group of experiments. Figure 8 shows the main ice thickness in the three bays with different intensities of driving f ields. It is obvious that there is a good positive correlation between the ice thickness and wind speed based on the f igures in the left column; the wind speed intensity increased by 25%, and the average ice thickness during the severe ice period thickened by approximately 4.0 cm in Liaodong Bay, approximately 2.1 cm in Bohai Bay and approximately 2.5 cm in Laizhou Bay. The iceending date remains almost constant under different wind speeds, but there is a large change in the icefreezing date, especially in Bohai Bay and Laizhou Bay. After increasing the wind speed intensity, the ice-freezing date of Bohai Bay is advanced to the end of November, and the ice-freezing date in Laizhou Bay is also driven ahead by 1.5 times the normal wind speed. Therefore, as a pivotal inf luencing factor, wind speed has a signif icant impact on the ice thickness and ice-freezing date of Bohai Sea ice. In contrast, the curves in the f igures in the right column almost coincide, indicating that changes in the tidal amplitude have little effect on the ice thickness.
We can draw a similar conclusion from Fig.9, which shows the time series of the ice coverage area and ice area in the Bohai Sea for different intensities of the driving fields. It can be seen from the figures in the left column that the ice coverage area/ice area is obviously positively correlated with the wind speed; as the wind speed intensity increased by 25%, the ice coverage area and ice area increased by approximately 2×10⁴km2and 1.4×10⁴km2, respectively, during the ice severe period. Almost coincident curves in the figures in the right column indicate that the changes in the tidal amplitude have little effect on the ice coverage area and ice area. However, in the severe ice period, the tidal amplitude intensity is weakly negatively correlated with the ice coverage area and ice area, while in the ice ablation period, the smaller the tidal amplitude intensity is, the larger the ice coverage area, which means a slower ice melting speed, indicating that the tidal amplitude plays a weak role in promoting sea ice melting.
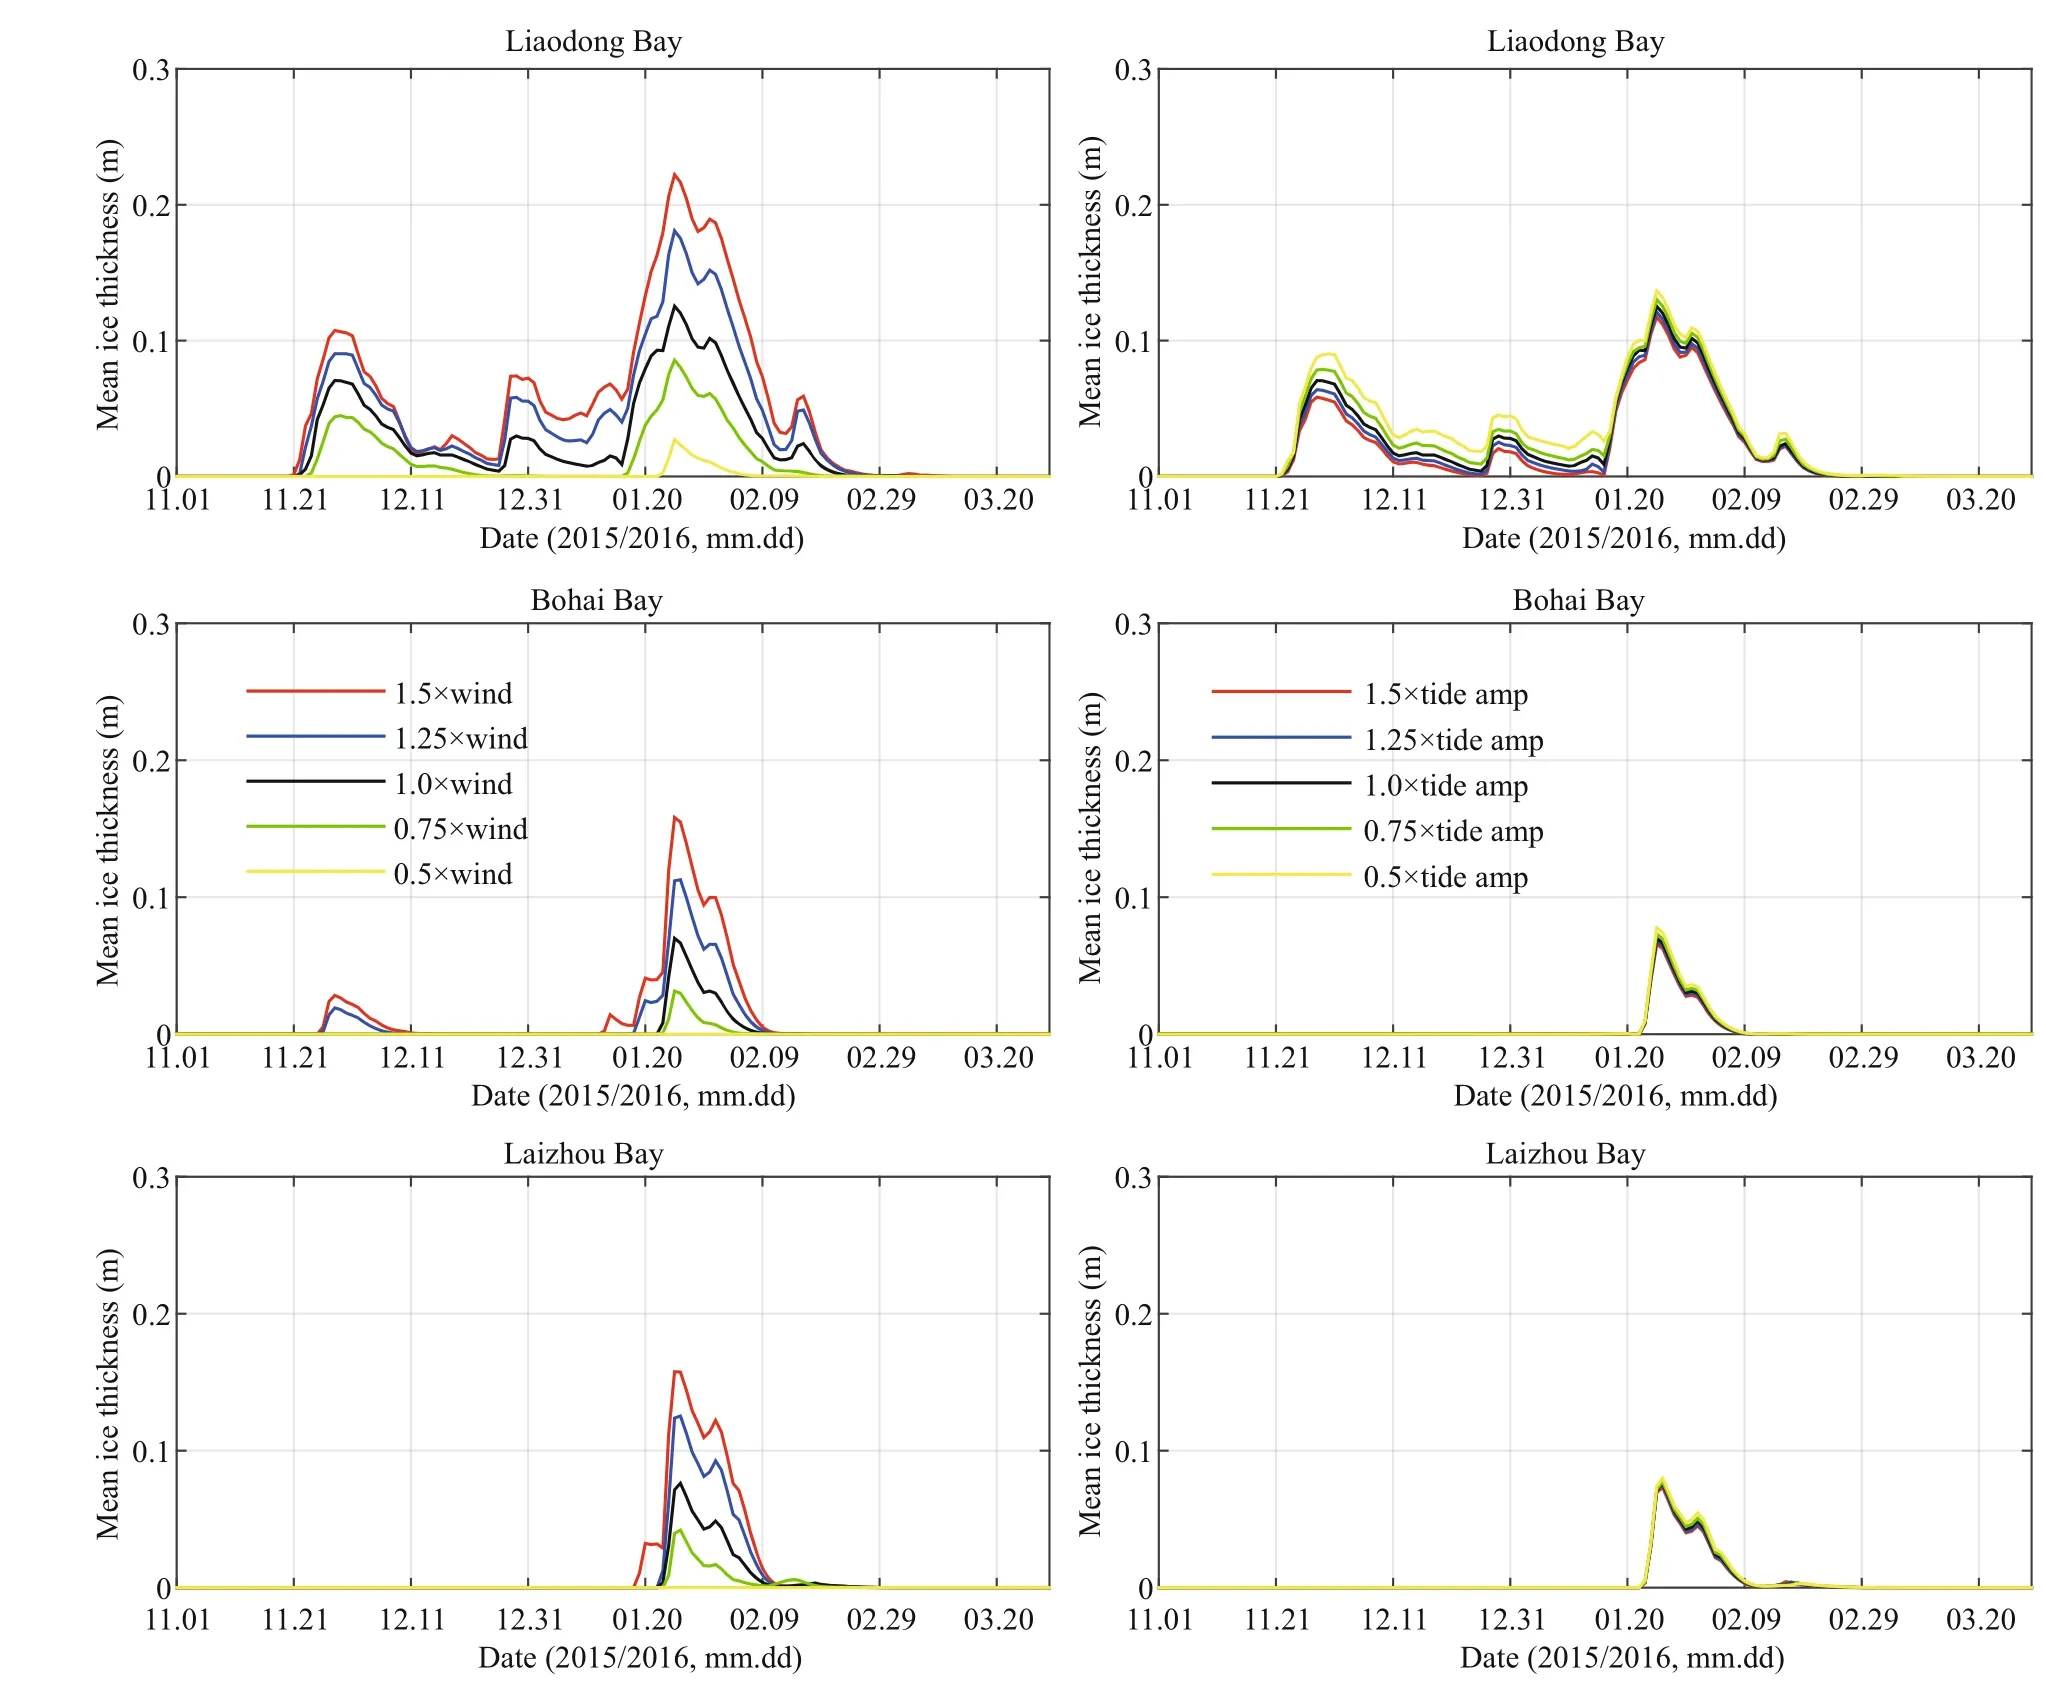
Fig.8 Mean ice thickness of Liaodong Bay (top), Bohai Bay (middle), and Laizhou Bay (bottom) driven by different wind speed intensities (left column) and tidal amplitudes (right column)
We explore the effects of different intensities of the driving fields on the ice velocity by analyzing its probability density distribution (Fig.10). Because the hourly ice velocity data of the whole length of ice season are too large, the data from January 29 (01:00) to January 31 (24:00) are selected here. The left figure shows that the wind speed is basically positively correlated with the ice velocity. However, the ice velocity driven by 1.25 times the normal wind speed is very close to that driven by 1.5 times the normal wind speed, and the average ice velocity driven by 1.25 times the normal wind speed is slightly more than that driven by 1.5 times the normal wind speed, illustrating that there is a non-linear positive correlation between wind speed and ice velocity. The right-hand figure shows that the stronger the tidal amplitude intensity, the more the ice velocity increases, while the weaker the tidal amplitude intensity, the more the ice velocity decreases, which shows that there is a good positive correlation between tidal amplitude intensity and ice velocity. After quantitative calculations, the tidal amplitude intensity increased by 25%, and the average ice velocity increased by approximately 0.1 m/s.
5 SUMMARY AND CONCLUSION
The purpose of this study is to apply an ice-ocean coupled model that comprises HAMSOM and a dynamic-thermodynamic sea ice model to Bohai Sea ice modeling. To more concretely describe thecoverage area and outer sea ice edge, the horizontal resolution of the coupled model increases to 1′×1′, approximately 1.8 km in the meridional (north-south) direction and 1.5 km in the zonal (east-west) direction, which can capture the structure of smaller-scale eddies. This change makes it possible to consider the effect of headland-produced smaller-scale eddies on the dynamic deformation and variation in heat transfer of sea ice. Further study is worth pursuing.
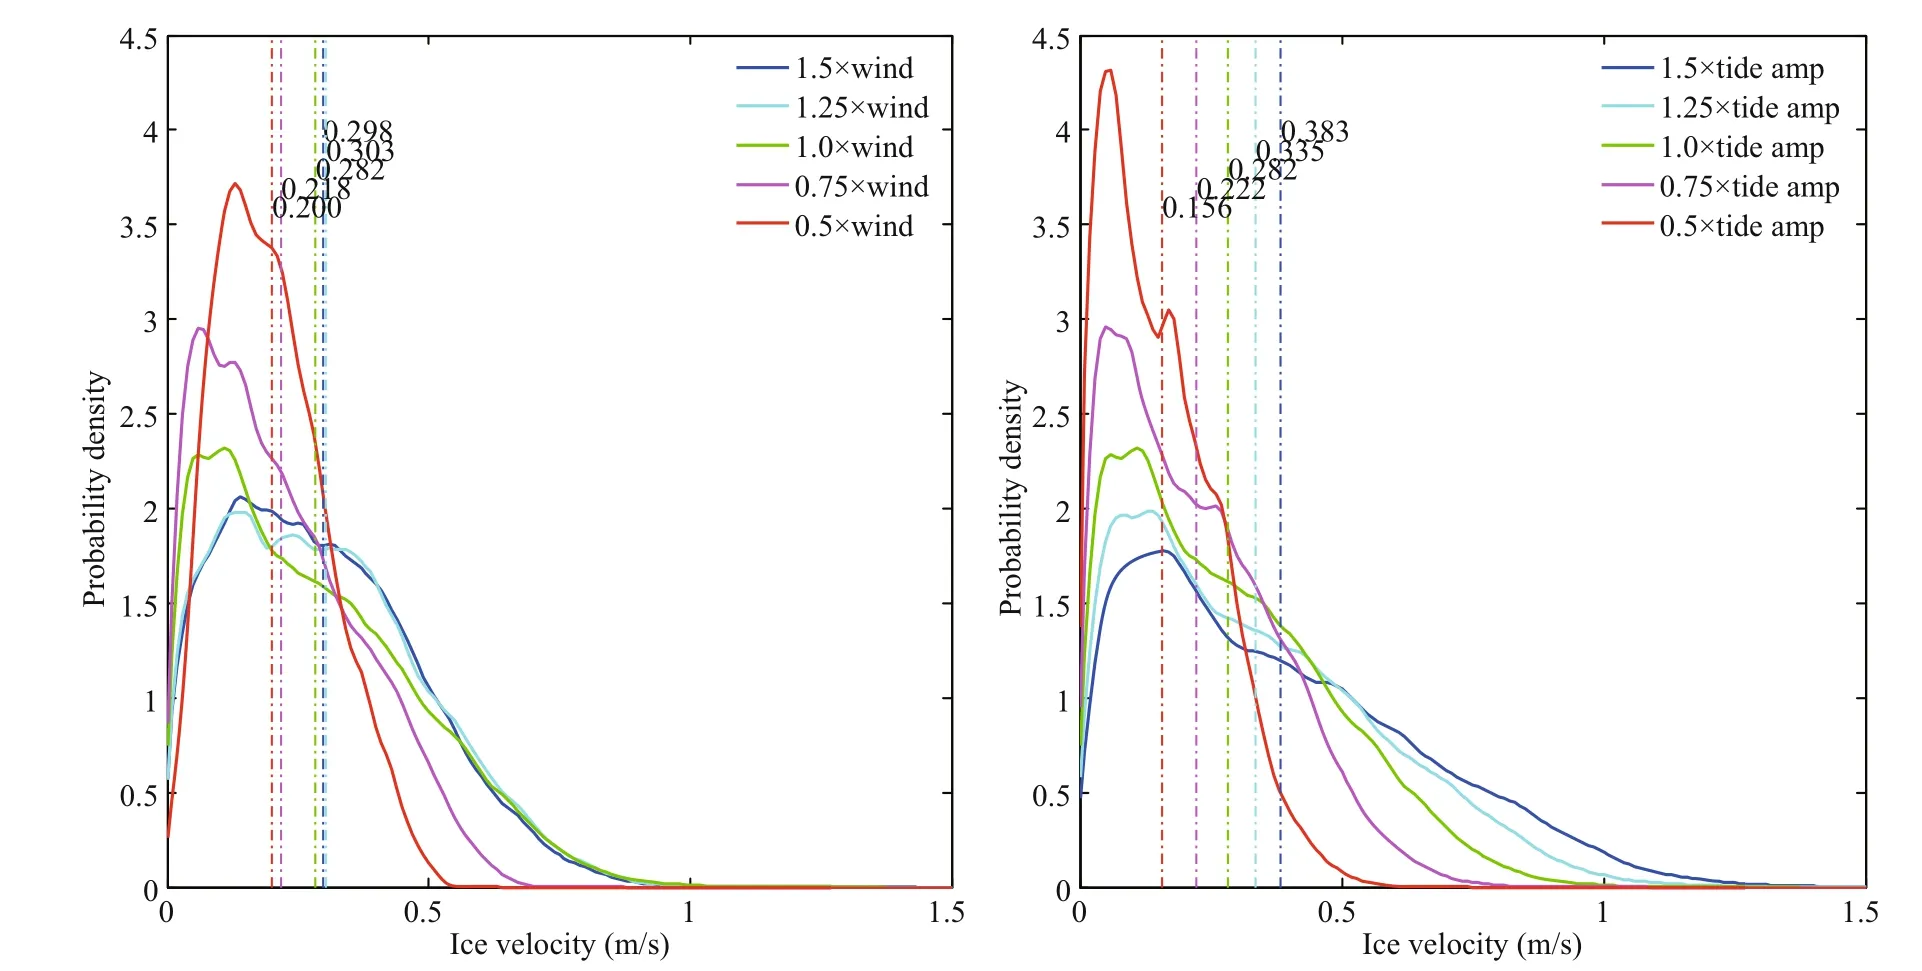
Fig.10 Probability density distribution of the ice velocity driven by different wind speed (left) and tidal amplitude (right) intensities
The model performance for the sea ice evolution process in the Bohai Sea during the winter of 2015/2016 is examined by comparing the simulated results of ice parameters and the observed values. Overall, the simulated results agree with the observations but are not as accurate for the ice edge distance from the end of December to the end of the next January. In other words, the simulated sea ice evolution process is too sensitive to air temperature. The verification of the simulated ice parameters gives us more confidence in the conclusions of further influence mechanism research on the dynamic factors associated with Bohai Sea ice. Three types of modeling experiments were carried out to investigate the effects of 1) wind, 2) tides and 3) both wind and tides on Bohai Sea ice. It was found that tides are the main cause of the open elliptical gyration path of ice, while wind results in ice movement in one direction, causing the ice displacement and breakage. Multiple sets of experiments with different intensities of the driving fields (wind speeds and tide amplitudes) were performed to compare the effects of wind and tides on Bohai Sea ice. The results show that the magnitude of the wind speed has a significant impact on the ice thickness, ice area, and ice-freezing and breakup dates as well as the ice velocity. During the severe ice period, the wind speed intensity increased by 25%, the average ice thickness thickened by approximately 4.0 cm in Liaodong Bay, approximately 2.1 cm in Bohai Bay and approximately 2.5 cm in Laizhou Bay, and the ice coverage area and ice actual area increased by approximately 2×10⁴km2and 1.4×10⁴km2, respectively. However, the tide obviously influences only the ice velocity and has little effect on the ice thickness and ice area. The tidal amplitude intensity increased by 25%, and the average ice velocity increased by approximately 0.1 m/s. Thus, we consider that wind is both a dynamic and a thermodynamic factor and tide is only a dynamic factor for sea ice.
This study is just the first step. Further work needs to be done on thermodynamic air-ice-ocean interactions and the influence mechanism of smallerscale movements (waves) on Bohai Sea ice. In recent years, the response of high- and mid-latitude climate systems to polar sea ice change has indeed been a hot spot of great research value. Many studies have demonstrated that extreme cold in the mid-latitudes are linked to Arctic warming and Arctic sea ice loss, and some studies suggest that they are unrelated (Li and Luo, 2019). While coinciding with Arctic surface warm anomalies in recent decades (1997-2017), the Siberian High has significantly intensified, the East Asian Jet Stream has expanded westward, and an apparent Rossby wave has propagated from the Arctic to East Asia, suggesting an atmospheric teleconnection between the mid-latitudes and the Arctic (Xu et al., 2019). However, Luo et al. (2019) found that in recent years, East Asian cold extremes can even occur without large negative sea ice concentration anomalies, and the magnitude of the background potential vorticity gradient is an important controller of Arctic/mid-latitude weather linkages. We believe that it is worthwhile to study the impact of Arctic warming on the mid-latitude climate system and its impact on Bohai Sea ice.
6 DATA AVAILABILITY STATEMENT
The data that support the findings of this study are available from the corresponding author upon reasonable request.
7 ACKNOWLEDGMENT
Thanks should be given to the National Super Computing Center in Jinan, China, for providing the computing resources and Ms. LIU Xin for the computing support. We thank Dr. Thomas Pohlmann from the University of Hamburg, Germany, for providing the HAMSOM codes with ice model as well as his helpful suggestions. We would also like to thank Mr. LI Wenguo from the University of Hamburg, Germany, and Dr. CHEN Xinping from the Ocean Disaster Reduction Center of the State Oceanic Administration for the discussions during the research. We are grateful the comments and suggestions from three anonymous reviewers that helped to improve the manuscript significantly.
杂志排行
Journal of Oceanology and Limnology的其它文章
- Influence of sequential tropical cyclones on phytoplankton blooms in the northwestern South China Sea*
- Simulated perturbation in the sea-to-air flux of dimethylsulfide and the impact on polar climate
- Performance of ecological restoration in an impaired coral reef in the Wuzhizhou Island, Sanya, China*
- Investigating factors driving phytoplankton growth and grazing loss rates in waters around Peninsular Malaysia
- Effects of oxytetracycline dihydrate and sulfamethoxazole on Microcystis aeruginosa and Chlamydomonas microsphaera*
- Reproductive cycle of Ophiopholis mirabilis (Echinodermata: Ophiuroidea) in Zhangzi Island area, northern Yellow Sea*
