The effects of Er3+ion concentration on 2.0-μm emission performance in Ho3+/Tm3+co-doped Na5Y9F32 single crystal under 800-nm excitation*
2021-01-21BenliDing丁本利XiongZhou周雄JianliZhang章践立HaipingXia夏海平HongweiSong宋宏伟andBaojiuChen陈宝玖
Benli Ding(丁本利), Xiong Zhou(周雄), Jianli Zhang(章践立),Haiping Xia(夏海平),†, Hongwei Song(宋宏伟), and Baojiu Chen(陈宝玖)
1Key Laboratory of Photo-electronic Materials,Ningbo University,Ningbo 315211,China
2State Key Laboratory on Integrated Optoelectronics,College of Electronic Science and Engineering and College of Physics,Jilin University,Changchun 130012,China
3Department of Physics,Dalian Maritime University,Dalian 116026,China
Keywords: 2.0-μm emission,Er3+/Ho3+/Tm3+,energy transfer,Na5Y9F32 single crystal
1. Introduction
In recent decades, ~2.0-μm infrared laser single crystals based on Tm3+and Ho3+as the central luminous ions have been received extensive attention owing to their both prominent physical–chemical properties and high emission efficiency beneficial from periodic lattice field structure of threedimensional symmetry.[1–4]Previously studied single crystals were mainly concentrated on oxide ones.[5]The oxide single crystals have drawbacks of the low transmittance in the range of infrared and low luminous efficiency due to high matrix phonon energy.[6]In contrast,the fluorides have attracted substantial attention because of its lower phonon energy and higher transparency. The Na5Y9F32is a newly developed fluoride single crystal.[7]It possesses excellent thermal stability,higher optical transparency in the range of infrared and optical performance, and is easy for trivalent rare-earth ions to replace the Y3+ions. These excellent properties make it very suitable as potential laser matrix for 2.0-μm infrared laser devices. Compared with the cubic NaYF4crystal, Na5Y9F32crystal may possess better thermal stability. Although both Na5Y9F32and cubic NaYF4crystals belong to fluorite cubic system,in which Na3+and Y3+ions are randomly distributed in the cationic positions in the center of the cube, there are still obvious differences in crystal structure resulting into their different properties. For the Na5Y9F32crystal,the dodecahedrons and octahedrons are formed by coordinated by 8 and 6 numbers of F-ions. Both Na+and Y3+are located in the dodecahedral sites, while the octahedrons are in vacant. The octahedral vacancies may provide a possible buffer space for the ion vibration resulting into the thermal stability.[8]While for cubic NaYF4,the cation sites are mainly occupied by Na+and Y3+,adjacent to F-,and each Na+or Y3+is coordinated by 8 number of F-ions to form a dodecahedron.[9]
As we all know, the energy level transition of Ho3+:5I7→5I8or Tm3+:3F4→3H6can obtain ~2.0-μm emission.For Ho3+ion-doped single crystal, the operation of tunable laser can extend to ~2.1 μm, while for Tm3+-doped single crystal,the tunable range can only be extended from 1.85 μm to 2.03 μm. Moreover,Ho3+ion generally has a higher emission cross section and a longer lifetime of higher laser energy levels compared to Tm3+ion,and these features are conducive to low-threshold and efficient laser operation.[10,11]However,there is still a tough task due to the lack of suitable absorption bands for Ho3+ion that cannot directly absorb the most common commercial laser diodes at the pumping beam of 800 nm or 980 nm.[12]Therefore,some corresponding sensitizers such as Er3+,Tm3+,and Yb3+ions are taken into consideration to absorb pumping energy effectively due to they have strong absorption band near 800-nm wavelength (Er3+or Tm3+ion)and near 980-nm wavelength(Er3+or Yb3+ion).[13]Previous researches have demonstrated that single crystal co-doped or tri-doped with sensitizer ions and Ho3+can lead to an increase in emission intensity of 2.0 μm,and the energy transfer mechanisms between Ho3+ion and sensitizer ions have also been studied in Ho3+/Er3+, Ho3+/Yb3+, Ho3+/Tm3+co-doped,and Ho3+/Er3+/Yb3+tri-doped single crystals.[14–17]Nevertheless,there is no investigation about the 2.0-μm emission of fluoride single crystal tri-doped with Er3+/Tm3+/Ho3+.
In this work, we report the further enhanced 2.0-μm emission by addition of Er3+in the Tm3+/Ho3+co-doped Na5Y9F32single crystals. The 2.0-μm emission characteristics and energy transfer mechanism were analyzed. The absorption cross sections and emission cross sections were determined to evaluate the spectral performance.ions concentrations in Na5Y9F32single crystals were recorded by ICP (Inductive Coupled Plasma Emission Spectrometer).Table 1 illustrated the doping concentrations of Tm3+,Ho3+,and Er3+ions in the raw materials and the measured concentrations of Tm3+, Ho3+, and Er3+ions in the synthesized crystal. A Bruker D8 Advance(Germany)was used to record the x-ray diffraction(XRD).A Cary 5000 UV/VIS/NIR spectrophotometer(Agilent Co.,America)was used to measure the absorption spectra. The emission spectra and decay curves of the prepared single crystals were obtained by an FLSP 920-type spectrometer(Edinburgh Co.,England). All of the above measurements were performed at room temperature.
2. Experimental
An improved Bridgman method was used to grow the Na5Y9F32single crystals under the condition of using KF as a flux.The commercial KF,YF3,NaF,HoF3,ErF3,and TmF3powders with 99.99% high purity were prepared as raw materials to grow Na5Y9F32single crystals according to the following molar composition: 30 NaF-18 KF-(50.2-χ)YF3-χ(χ =1, 2, 3) ErF3-0.8 HoF3-1 TmF3. The 0.8-mol% Ho3+singly doped, 0.8-mol% Ho3+/1-mol% Tm3+co-doped, 0.8-mol%Ho3+/0.5 mol%Er3+co-doped, χ-mol%(χ =1,2, 3)Er3+/0.8-mol%Ho3+/1-mol%Tm3+tri-doped Na5Y9F32single crystals were denoted as NYF-H,NYF-HT,NYF-HE,and NYF-HTEχ, respectively. The specific growth processes of Na5Y9F32single crystal were described in Ref.[7].
The obtained single crystals were cut and then polished to the thickness of 2 mm for the spectral and optical measurements as shown in Fig.2(e). The real Tm3+,Ho3+,and Er3+
3. Results and discussion
3.1. EDS and XRD analyses
Figures 1(a)and 1(b)show the scanning electron microscope(SEM)image and energy dispersive x-ray spectroscopy(EDS) analysis of the NYF-HTE0.5 crystal. It can be seen from the SEM image of Fig.1(a)that the polished single crystal shows a smooth surface at a magnification of 10000. The EDS analysis of Fig. 1(b) shows that the composition of the single crystal is very close to the nominal Na5Y9F32composition and the Na5Y9F32single crystal is mainly composed of F, Na, Y, Ho, Er, Tm and a small amounts of K. The detection of K ion signal in the EDS analysis is believed due to a small amount of K residue as a flux in crystal growth. Figures 1(c)–1(h)display the color mappings of all the elements in the NYF-HTE0.5 crystal.
Figures 2(b)–2(d) show the XRD patterns of NYF-H,NYF-HE, and NYF-HTE0.5 crystals. According to the PDF cards(27-1428),as shown in Fig.2(a),the diffraction peak position of the obtained single crystal sample doped with Er3+,Ho3+,Tm3+ions completely matches the diffraction peak position of the standard Na5Y9F32. In addition,the cell parameters can be calculated by[18]
The calculated cell parameters of the NYF-HTE0.5 single crystals are a=b=c=0.5545 nm from the measured XRD pattern.
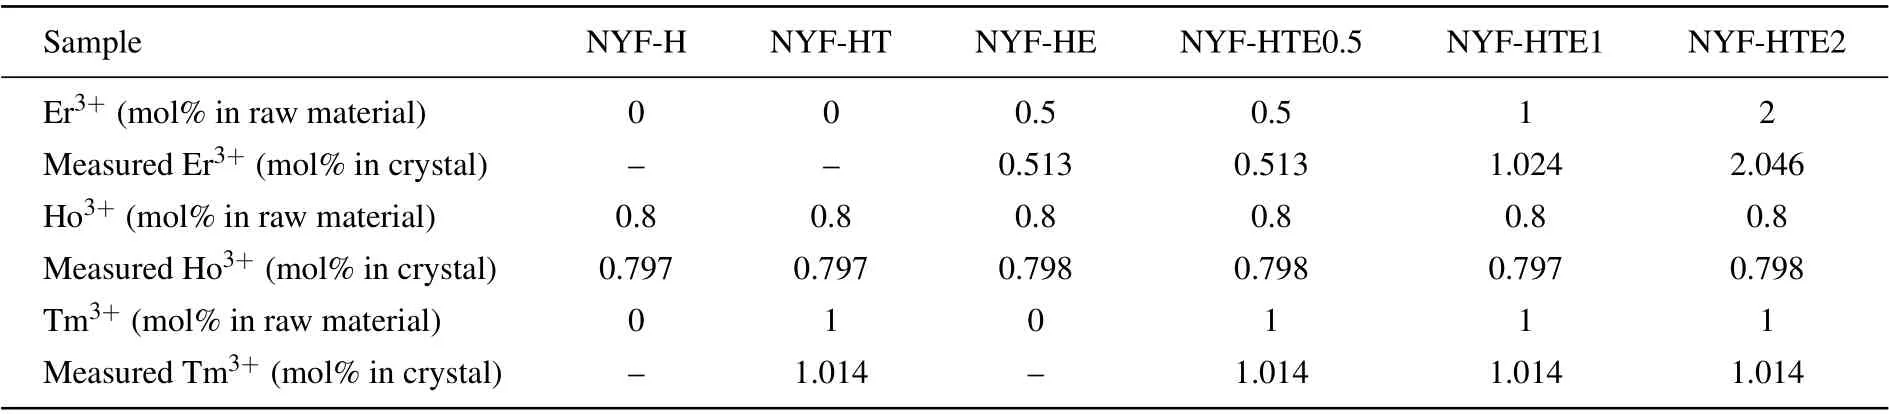
Table 1. Molar fractions of Er3+,Ho3+,and Tm3+ in raw material and measured concentrations of Er3+,Ho3+,and Tm3+ ions in Na5Y9F32 single crystals.

Fig. 1. (a) The SEM image of the NYF-HTE0.5 crystal; (b) the EDS analysis of the the NYF-HTE0.5 crystal,and(c)–(h)elemental mappings for the NYF-HTE0.5 crystal.
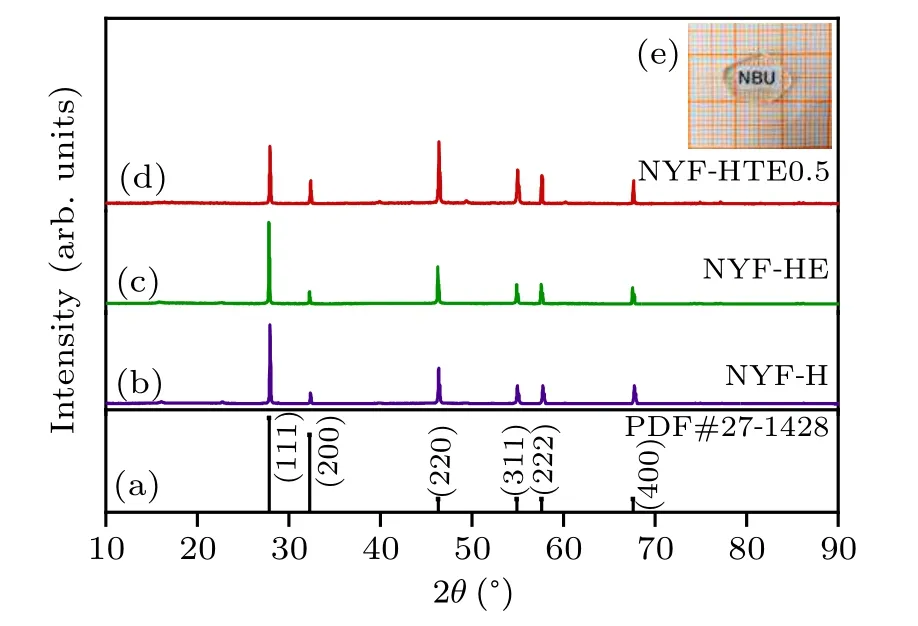
Fig.2.XRD patterns of(a)the standard data for Na5Y9F32 crystal;(b)NYFH crystal; (c) NYF-HE crystal; (d) NYF-HTE0.5 crystal; (e) the photos of NYF-HTE0.5 crystal polished slices.
3.2. Absorption spectra and absorption cross section spectra
Figure 3 illustrates the absorption spectra of the NYFH, NYF-HE, and NYF-HTE0.5 crystals in the wavelength of 400 nm–2200 nm. In order to eliminate the influence of sample thickness,the absorbance is converted into absorption coefficient α according to the following formula:

where A and L are the absorbance and the thickness of the single crystal,respectively. The absorption bands of Ho3+,Er3+,and Tm3+are also labeled in Fig.3, which is consistent with transitions from the ground state to higher energy levels. For Ho3+singly doped NYF-H crystal,the absorption peaks corresponding to the Ho3+ion transitions from the5I8ground state to the higher levels5G5,5F1/5G6,5F3,5S2/5F4,5F5,5I6,5I7located in the characteristic wavelength of 413,446,480,535,642,1153,1929 nm,are observed. While for the Ho3+,Er3+co-doped NYF-HE one, it can be observed the Er3+characteristic absorption consisting of seven main bands centered at 485, 516, 538, 639, 800, 973, 1515 nm, which is attributed to the Er3+transitions from4F13/2to4F2/7,4H11/2,4S3/2,4F9/2,4I9/2,4I11/2,4I13/2, respectively besides the absorption bands of Ho3+ion. In addition to the absorption peaks of Er3+and Ho3+, there appear new four absorption bands at 681, 798, 1197, and 1637 nm which is attributed to the transitions from3H6to3S2,3,3H4,3H5, and3F4of Tm3+ion in the Ho3+,Tm3+,and Er3+triply doped NYF-HTE0.5 crystal.It can be confirmed from Figs.1 and 2 that the Ho3+, Tm3+,and Er3+rare-earths ions are effectively introduced into the crystal lattices of Na5Y9F32crystals. In addition, there appear strong absorption bands at 800 nm(Er3+:4F15/2→4I9/2and Tm3+:3H6→3H4)and 980 nm(Er3+:4F15/2→4I11/2)which are very favorable for using commercial LEDs at 800-nm and 980-nm wavelengths as pumping sources.[19]
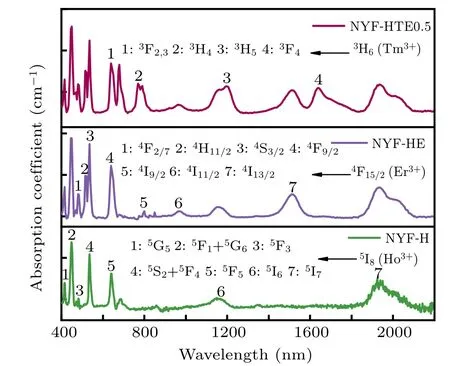
Fig.3. Optical absorption spectra of NYF-H,NYF-HE,NYF-HTE0.5 crystals.
The absorption and emission cross sections at 2.0 μm are usually measured to clarify the energy transfer mechanism between the Er3+, Tm3+, and Ho3+ions. According to the absorption spectra of Na5Y9F32single crystal illustrated in Fig. 3, the absorption cross section at 2.0 μm can be calculated by[20]

where I0and I are intensity of the incident optical and optical intensity throughout the crystals, respectively. L, N, and α are the thickness of the crystal, the concentration of rare earth ion, and the absorption coefficient, respectively. Figure 4 illustrates the calculated absorption cross sections of the Ho3+:5I7→5I8transition. As shown in the figure,the maximum absorption cross sections of NYF-HTE1 crystal reaches 2.86×10⁻²¹cm2.
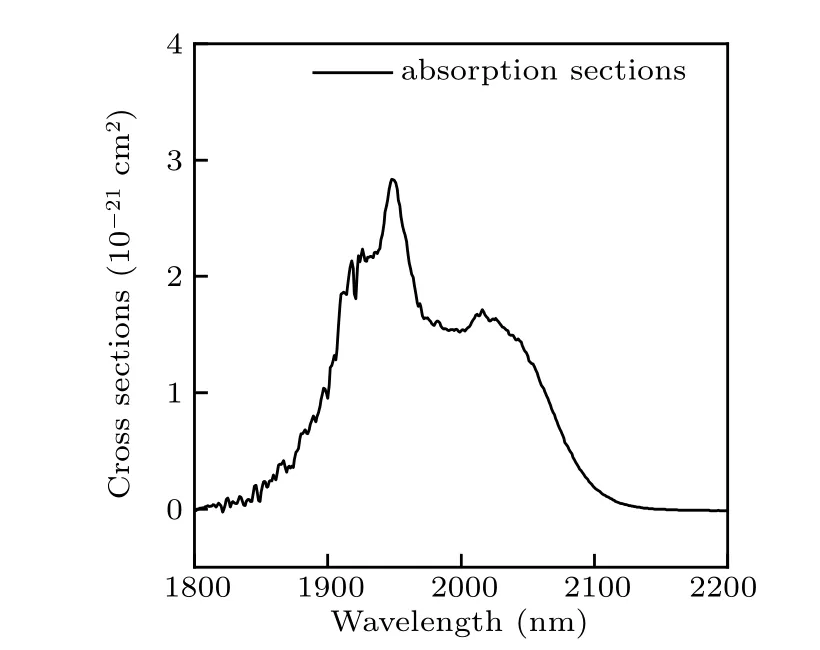
Fig.4. Absorption cross-section spectra of the Ho3+ : 5I7 →5I8 transition in NYF-HTE1 crystal.
3.3. Emission spectra and emission cross section spectra
Figure 5(a) illustrates the fluorescence spectra of χEr/0.8Ho/1Tm(χ =0,0.5,1,and 2)doped Na5Y9F32crystals in the range of 1400 nm–2200 nm under excitation at 800 nm,and figures 5(b)and 5(c)show the intensity at 2.0 μm,1.47 μm, 1.53 μm, and 1.64 μm as change of the Er3+concentrations. Figures 6(a) and 6(b) display the fluorescence spectra of χEr/0.8Ho/1Tm (χ = 0, 0.5, 1, and 2) tri-doped Na5Y9F32crystals in the 2500 nm–2900 nm band and the intensity at 2.7 μm and 2.8 μm as change of Er3+concentration.In addition, the relative fluorescence intensity of the ordinate in Figs. 5(a) and 6(a) is the fluorescence intensity obtained by measurement. As shown in Fig. 5(a), there are main four emission peaks centered at 2 μm,1.64 μm,1.53 μm,1.47 μm,while in Fig. 6(b), two peaks at 2.7 μm and 2.8 μm. The intensity of emission bands at 1.64 μm, 1.53 μm is extremely weak in all four samples as shown in insert of Fig.5(a). The emissions at 2.0 μm and 2.8 μm come from the transitions of Ho3+:5I7→5I8and Ho3+:5I6→5I7, respectively. The emissions at 1.53 μm and 2.7 μm correspond to the transitions of Er3+:4I13/2→4I15/2and Er3+:4I11/2→4I13/2, respectively. The other emissions at 1.47 μm and 1.64 μm arise from Tm3+:3H4→3F4and Tm3+:3F4→3H6transitions,respectively. As shown in Figs.5(b),5(c),and 6(b),by contrast of NYF-HT and NYF-HTEχ (χ =0.5,1,and 2)crystals,it is apparent that the 1.53-μm,1.64-μm,2.0-μm,2.7-μm,and 2.8-μm emission intensities of Na5Y9F32crystals increase gradually as increase of Er3+concentration from 0 mol%to 1 mol%,and it reaches maximum when the Er3+concentration is about~1 mol%,it decreases abruptly with Er3+concentration ranging from 1 mol%to 2 mol%. However,the fluorescence intensity of 1.47 μm gradually decreases as increase of the Er3+ion concentration. In addition, the peak intensity ratio values of 2.0 μm to 1.64 μm and 2.0 μm 1.53 μm in NYF-HT and NYF-HTEχ crystals are also shown in Table 2. The 2.0-μm fluorescence of NYF-HTE1 crystals possesses the maximum intensity in the present study, and the peak intensity ratios of 2.0 μm to 1.64 μm and 2.0 μm to 1.53 μm return to 50.22 and 59.09. It strongly indicates that the energy in Tm3+:3F4(1.64 μm)and Er3+:4I13/2(1.53 μm)levels mostly transfers sufficiently to the Ho3+:5I7level by emitting 2.0-μm emission. Besides, the values of the I2.0/I1.53, I2.0/I1.64become larger as the concentration of Er3+ion increases until the Er3+concentration reaches 1 mol%. Therefore,the Er3+ion is considered as an efficient sensitizer for improving 2.0-μm emission in Ho3+,Tm3+co-doped Na5Y9F32crystals,and the optimum doping combination concentrations of Er3+,Ho3+,and Tm3+are about 1 mol%,0.8 mol%,and 1 mol%.

Fig.5. (a)Emission spectra of NYF-HT,NYF-HTEχ (χ=0.5,1,2)crystals pumped at 800-nm LD, (b) the relationships between the 2.0-μm intensity and the concentration of Er3+, (c) the relationships between the 1.47-μm,1.53-μm,and 1.53-μm intensities and the concentration of Er3+.

Fig. 6. Emission spectra of NYF-HT, NYF-HTEχ (χ =0.5, 1, 2) crystals pumped at 800-nm LD, (b) the relationships between the 2.7-μm, 2.8-μm intensities and the concentration of Er3+.
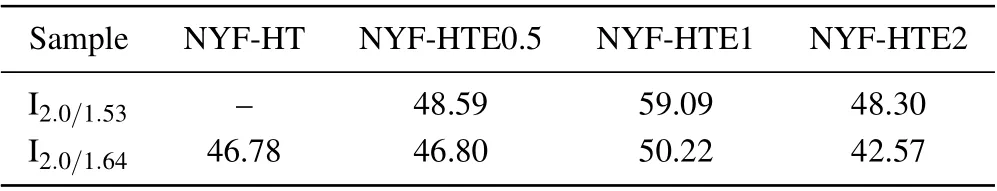
Table 2. The intensity ratios of I2.0/I1.53,I2.0/I1.64 in NYF-HT,NYF-HTEχ(χ =0.5,1,2)crystals.
The emission cross section can be obtained from the calculated absorption cross section by using the McCumber formula as follows:[21]

where Zland Zurepresent the partition functions of the lower level (Ho3+:5I8) and the upper level (Ho3+:5I7), respectively; T, K are room temperature and the Boltzmann constant, respectively; h, λ, c, and Ezldenote Planck constant,transition (Ho3+:5I7→5I8) wavelength, light velocity, and zero-line energy,respectively.
Figure 7 illustrates the calculated emission cross sections of the Ho3+:5I7→5I8transition. As shown in the figure,the maximum emission cross sections of NYF-HTE1 crystal reaches 5.26×10⁻²¹cm2. The obtained emission cross section of Na5Y9F32single crystal is larger than those in tellurite glass (4.52×10⁻²¹cm2),[22]fluoride glass (2.47×10⁻²¹cm2)[23]and germanate glass(4×10-21cm2).[24]The laser effect would benefit from the Na5Y9F32single crystal of high emission cross-section as host material, indicating that the Er3+/Ho3+/Tm3+tri-doped Na5Y9F32single crystal is a potentially useful material for 2.0-μm applications.
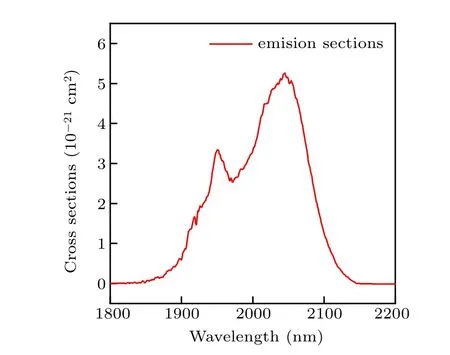
Fig.7. Emission cross-section spectra of the Ho3+: 5I7 →5I8 transition in NYF-HTE1 crystal.
3.4. Gain cross section spectra
On the basis of the obtained absorption cross section and emission cross section, the optical gain coefficient g(λ) as a function of population inversion for the upper laser state can be calculated and defined as[25]
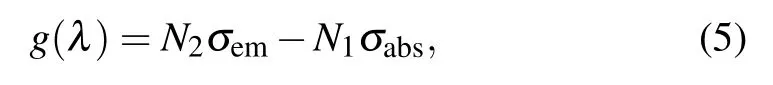
where N2and N1are the population inversion volume-densities of the upper level(Ho3+:5I7)and lower level(Ho3+:5I7),respectively. The inversion volume-density of total population is N=N2+N1,and therefore the gain cross section spectrum G(λ)can be estimated by

where P is the proportion of population inversion, and 0 ≤P ≤1. Figure 8 shows the gain cross sections of Ho3+:5I7→5I8transition in NYF-HTE1 crystal based on a function of differentP values and wavelengths. The value of P increases gradually from 0 to 1, with an increment of 0.1. As shown in Fig.8,a positive gain is obtained when P >0.3. It is confirmed that the gain band extends to longer wavelength and the gain coefficient increases with the increased value of P. In addition,it can be noticed that the pumping threshold of 2.0-μm laser is lower,which is advantageous for the 2.0-μm laser.
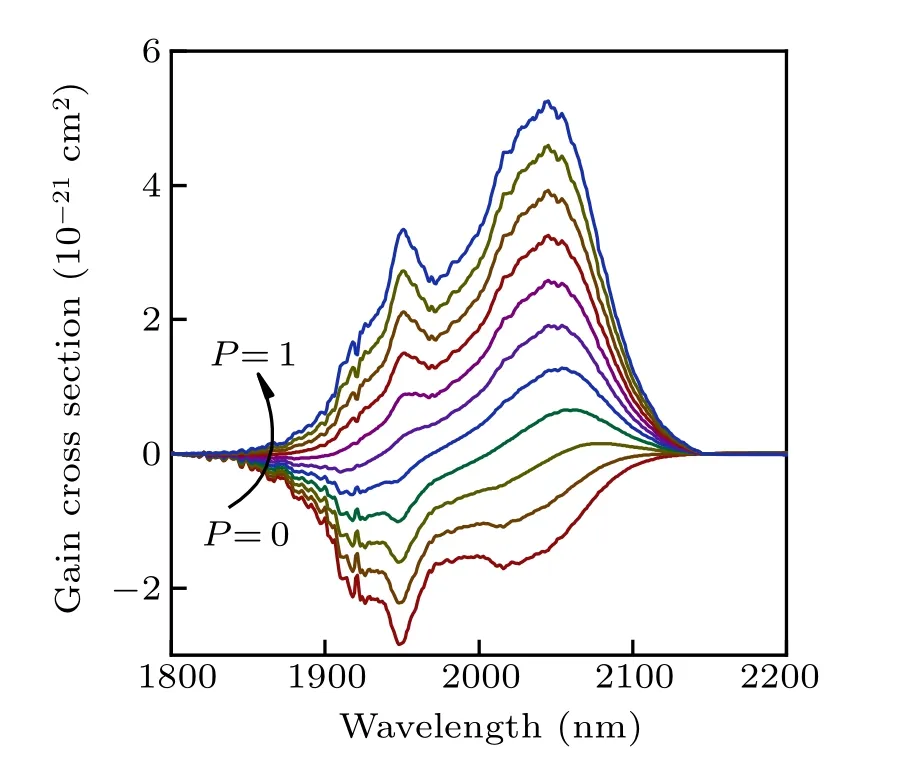
Fig.8.Gain cross-section spectra of the Ho3+:5I7 →5I8 transition in NYFHTE1 crystal.
3.5. Energy transfer mechanics and fluorescence decay curves
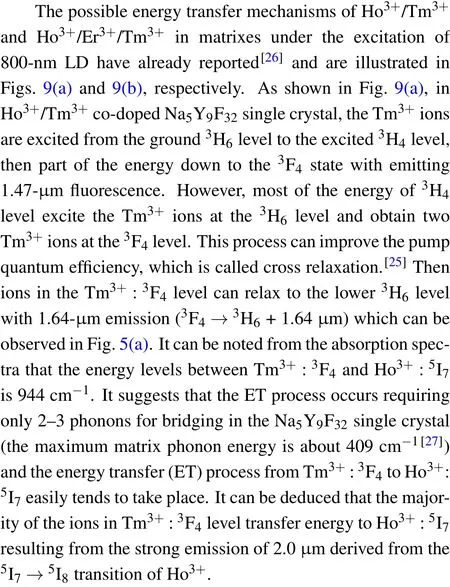
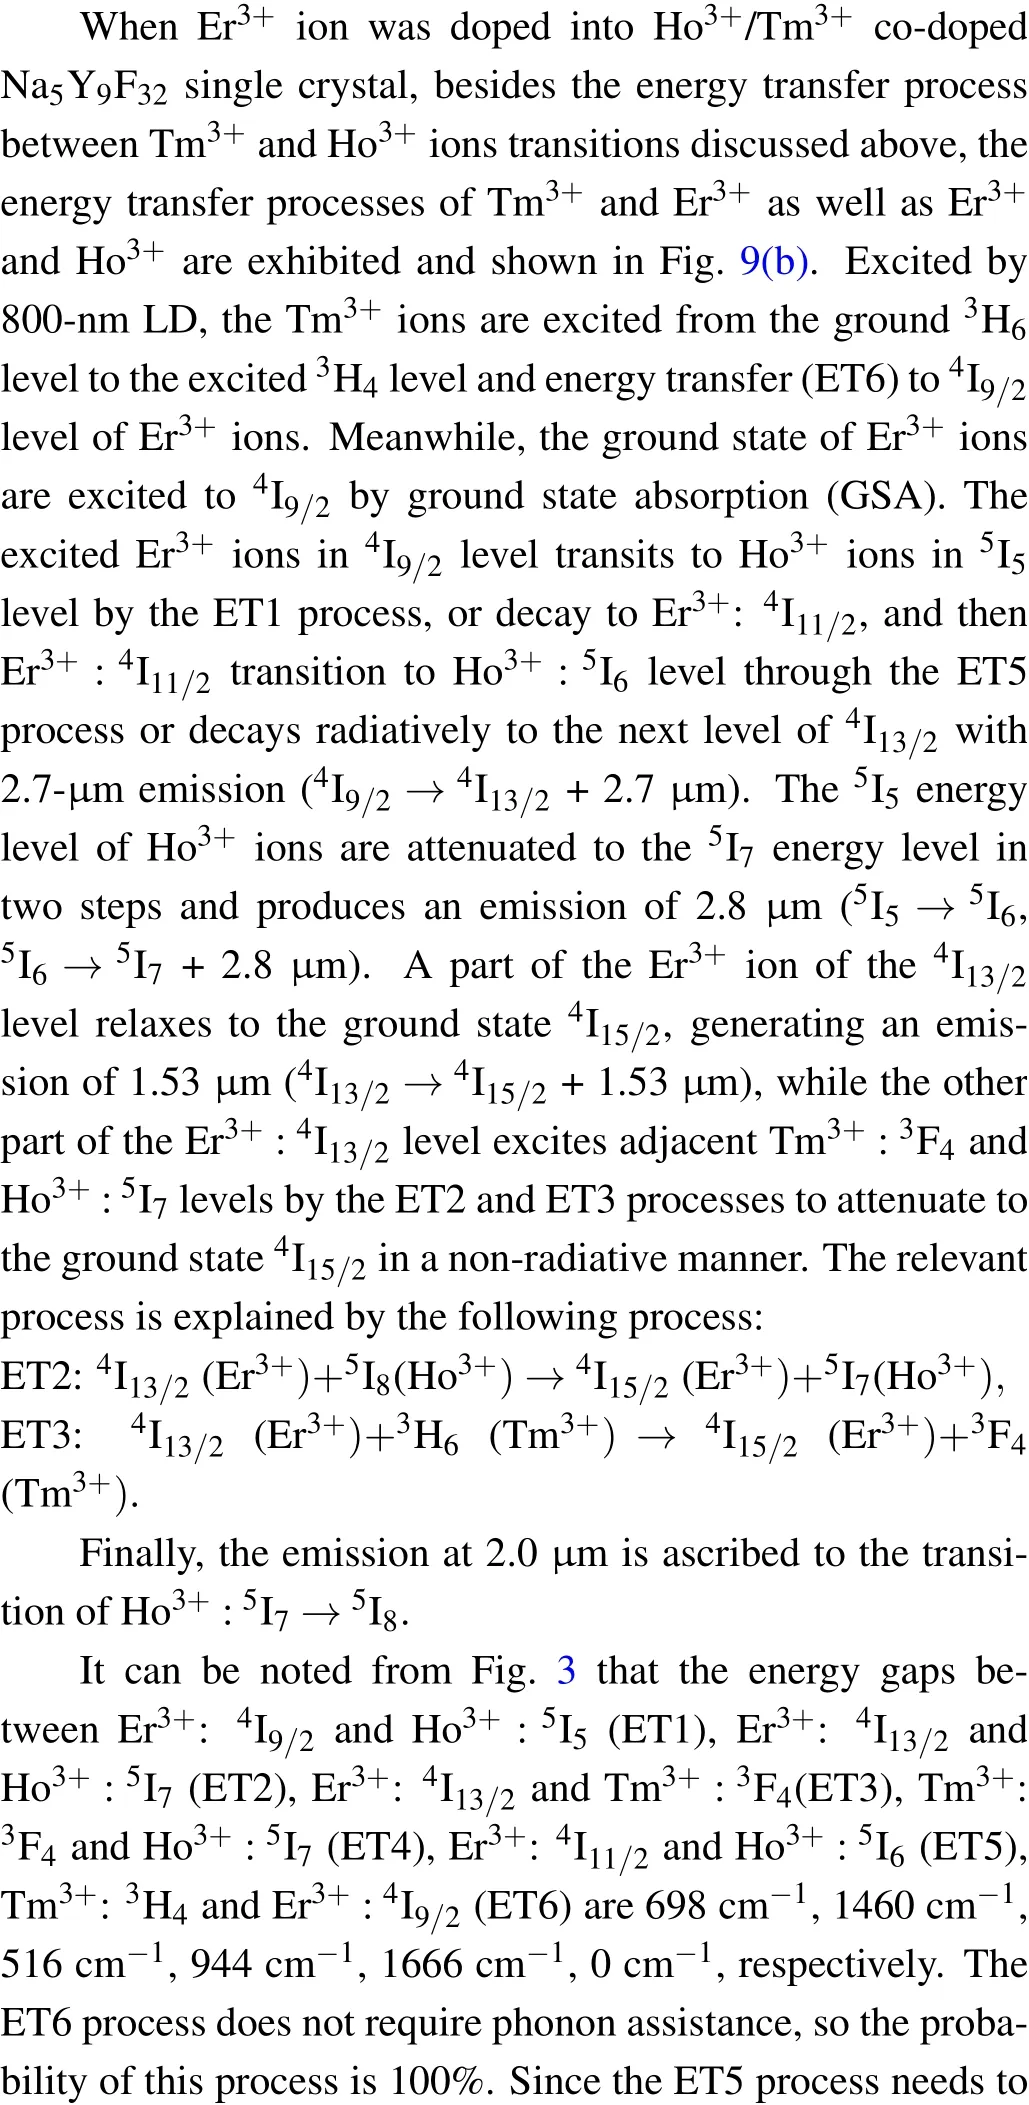

Fig.9. The energy level diagram and possible energy transfer mechanism in Ho3+/Tm3+ co-doped and Er3+/Ho3+/Tm3+ tri-doped Na5Y9F32 crystals.
Then, we calculate the fluorescence lifetime by the following formula:
Figure 10 shows the decay curves of Ho3+:5I7→5I8transition monitored at 2.0-μm region of NYF-HT and NYFHTE1 crystals excited by 800 nm, the fitted lifetimes is 18.46 ms and 16.28 ms, repetitively. It can be observed that when Er3+ions are added to the Tm3+/Ho3+system,the lifetime of 2.0 μm is reduced from 18.46 ms to 16.28 ms.It can be seen from Fig.9,the ET1,ET2,ET3,ET5,and ET6 processes are probable to occur between Er3+and Tm3+,Er3+and Ho3+due to the near energy levels. It should be noted that the ET6 process is much easier to take place due to no requiring phonon assistance between Tm3+:3H4and Er3+:4I9/2. Under excitation of 800-nm light, the Tm3+ion absorbs the photo of 800 nm by transition from3H6to3H4, and some of energy transfer to Er3+ion by ET6 process. As is known,the ET4 is easier to occur than ET2 process because of the nearer energy difference. The triply doping of Er3+results into the attenuation of the ET4 process and reduction of the lifetime of 2.0 μm.The fluorescence lifetime of NYF-HTE1 crystal at 2.0 μm is much higher than that of germanium tellurate glass reported previously (6.83 ms).[13]The longer radiation lifetime usually reduces the laser oscillation threshold,[26]which indicates that Er3+/Ho3+/Tm3+tri-doped Na5Y9F32single crystal is a promising 2.0-μm laser candidate material.

Fig. 10. Decay curves of Ho3+ : 5I7 levels monitored at 2.0-μm region of NYF-HT and NYF-HTE1 samples.
Based on the obtained fluorescence lifetimes,we can calculate the energy transfer efficiency between Er3+and Ho3+in Er3+/Ho3+/Tm3+tri-doped Na5Y9F32single crystal by the following equation[29]
where τAand τDAare the lifetime of the Ho3+:5I7level in NYF-HT crystal and the Ho3+:5I7level in NYF-HTE1 crystal, respectively. The efficiency of ET2 process from Er3+:4I13/2to Ho3+:5I7is calculated to be 11.81%. It suggests that the process of Er3+to Ho3+makes a part of the contribution of transfer energy to Ho3+ion together with the energy transfer process of Tm3+to Ho3+,resulting into further enhancement of 2.0 μm.
4. Conclusion
Our experiments demonstrated that the 2.0-μm emission intensity of Tm3+/Ho3+co-doped Na5Y9F32single crystal can be further enhanced by introduction of Er3+into the system under 800-nm excitation. The optimized doping concentration of Er3+is ~1 mol% for Tm3+(~1 mol%),Ho3+(~0.8 mol%)-doped Na5Y9F32crystal to reach a maximum fluorescence emission of 2.0 μm. The calculated maximum absorption and emission cross-sections at 2.0 μm for 1Er3+/0.8Ho3+/1Tm3+tri-doped Na5Y9F32crystal are 2.86×10⁻²¹cm2and 5.26×10⁻²¹cm2, respectively. Meanwhile,the fluorescence lifetimes of 1Er3+/0.8Ho3+/1Tm3+tri-doped Na5Y9F32crystal is 18.46 ms. The efficiency of ET2 progress is calculated to be 11.81%according to the measured fluorescence lifetimes. Consequently,the excellent luminous properties suggest that Er3+/Ho3+/Tm3+tri-doped Na5Y9F32crystals are attractive and significant materials for 2.0-μm lasers.
Acknowledgment
Benli Ding prepared the samples and wrote the article.Xiong Zhou and Jianli Zhang carried out relevant experimental measurements. Xia Haiping embellished and checked the article. Hongwei Song and Baojiu Chen assisted the data analysis. All authors contributed to the general discussion.
杂志排行

Chinese Physics B的其它文章
- Two-dimensional finite element mesh generation algorithm for electromagnetic field calculation*
- Stable water droplets on composite structures formed by embedded water into fully hydroxylated β-cristobalite silica*
- Surface active agents stabilize nanodroplets and enhance haze formation*
- Synchronization mechanism of clapping rhythms in mutual interacting individuals*
- Theoretical study of the hyperfine interaction constants,Land´e g-factors,and electric quadrupole moments for the low-lying states of the 61Niq+(q=11,12,14,and 15)ions*
- Ultrafast photoionization of ions and molecules by orthogonally polarized intense laser pulses: Effects of the time delay*