Role of Ag microalloying on glass forming ability and crystallization kinetics of ZrCoAgAlNi amorphous alloy
2021-01-21SurendarGeethaRajanandAlaazim
A Surendar, K Geetha, C Rajan, and M Alaazim
1Department of Pharmacology,Saveetha Dental College and Hospital,Saveetha Institute of Medical and Technical Sciences,Chennai,India
2CSE,Excel Engineering College,Pallakapalayam,Komarapalayam,637303,India
3IT,K S Rangasamy College of Technology Tiruchengode,Namakkal,Tamil Nadu 637215,India
4Faculty of Engineering,Universitas Muhammadiyah Surakarta(UMS),Indonesia
Keywords: bulk metallic glass,materials design,crystallization kinetics,glass forming ability
1. Introduction
Due to their acceptable corrosion resistance and high mechanical properties,ZrCo-based bulk metallic glasses(BMGs)are potential candidates for application in a wide range of engineered structures.[1–4]Among several developed ZrCo-based alloys, ZrCoAl ternary system shows a good glass forming ability (GFA).[6]However, there exists a long path to make usable this type of alloys in the industrial applications. Unlike crystalline alloys, metallic glass formers show restricted ductility,especially at room temperature,so that it is necessary to use advanced fabrication methods to achieve BMGs with eligible shapes and configurations.[7]Hence, understanding the thermal stability and crystallization kinetics of BMG alloys for optimization of crucial variables in the production process seems very important.
In general, the isothermal and non-isothermal analyses have been employed to evaluate the crystallization kinetics in the BMGs.[8–11]The similarity between non-isothermal analysis and devitrification processes makes the athermal condition more favorable in the kinetic study of MG alloys. To explain the crystallization kinetic evolution,the thermo-analytical approaches,including kinetic parameters,have been used;[12,13]however,Gibbs free energy changes(ΔGsl)from super-cooled liquid to crystallization of amorphous phase may also be able to interpret the crystallization events in the BMGs.[14]Due to the difficult experimentations for measuring Gibbs energy variations, some theoretical expressions such as KN and TS equations have been presented.[15]For example, a novel expression was proposed, in which the Gibbs energy was accurately estimated in multicomponent Zr-based BMGs.[16,17]In this regard,the nucleation rate exponentially relies on the activation barrier,which is inversely correlated with ΔGslso that the higher GFA and better thermal stability strongly depends on the low ΔGslvalue.[18]The fragility parameter (m) is another factor describing the GFA and thermal stability of amorphous alloys with the reflection of deviation degree of a supercooled liquid from the Arrhenius trend beyond the glass transition temperature.[19–21]When a liquid is cooled in the range of glass transition temperature, the viscosity is dramatically intensified by more than 12 orders in magnitude.[22]The concept of liquid fragility defines the accelerated process in the viscosity. Under the super-cooling event,the liquid may experience the increment of viscosity in an Arrhenius-like fashion,while the viscosity trend may be in the form of non-Arrhenius scaling. Hence, the m parameter is a criterion, in which the viscosity changes is characterized as function of temperature gradient.[22]According to standard definition, it is suggested that the deviation degree defines the GFA with three types of fragile, intermediate and strong liquids. The fragile liquids exhibit a considerable deviation from the Arrhenius trend(m ≤70)leading to a loose-packed structure with lower energy barrier for nucleation. On the other side, the strong liquids with m values of 16–30 tend to create dense-packed atomic arrangements, which result in more difficult nucleation and growth,higher GFA and better thermal stability Moreover,liquids with intermediate fragile features have m values of 30–70 with inherent characteristics between pure fragile and strong liquids.
As mentioned in literature,it is very crucial to understand the inherent feature of metallic glass formers to be able to design and fabricate the desired amorphous alloys with exceptional properties. Hence,in this work we tried to develop new BMGs with chemical compositions of Zr5(Co33Ag2)Al10Ni5,Zr5(Co31Ag4)Al10Ni5, and Zr5(Co29Ag6)Al10Ni5to identify the role of Ag minor addition on the crystallization kinetics and GFA.There are some works showing the biocompatibility,corrosion resistance and mechanical properties of Ag addition in Zr-based BMGs;[23–25]however, there is a need to evaluate fundamental features, such as thermal stability and GFA,for achieving ZrCo BMGs capable to be used in engineering structures.
2. Experimental procedure
High purity elements of Zr, Co, Al, Ni, and Ag were used to prepare master alloy ingots with nominal compositions of Zr50(Co33Ag2)Al10Ni5, Zr5(Co31Ag4)Al10Ni5, and Zr5(Co29Ag6)Al10Ni5. The above-mentioned compositions are coded as A1,A2,and A3 in this paper. The arc re-melting technique under Ti-gettered high purity argon was applied for alloying process. The master alloys were re-melted four times to convince elemental homogeneity in the ingots. The BMG rods with length of 4 cm and minimum diameter of 3 mm were produced using a copper mold suction casting technique equipped with a water-cooled system for subsequent analyses.Moreover,rods with different diameters,from 3 mm to 6 mm,were cast to identify the critical thicknesses.
After rod fabrication,the structure of specimens were analyzed with x-ray diffraction (XRD) using Cu Kα radiation.To explore the thermal characteristics of specimens,differential scanning calorimeter(DSC)was employed. The DSC instrument was calibrated with pure indium sample. For DSC experiment, the samples with 1-mm thickness were cut from the reference rods and kept in the Al2O3pans under argon environment. The cooling/heating rates of 5, 10, 15, and 20 K/min were considered for the DSC experiment.
3. Results and discussion
Figure 1 shows the XRD patterns of samples with different chemical compositions. All the patterns indicate a broad hump intensified at the 2θ ~=38◦and there are no sharp peaks implying the lack of crystalline phases in the cast samples.Hence, the XRD patterns justify that the samples are inherently fully amorphous. Non-isothermal DSC analysis with different heating rates was used to evaluate the thermal characteristics of amorphous samples.
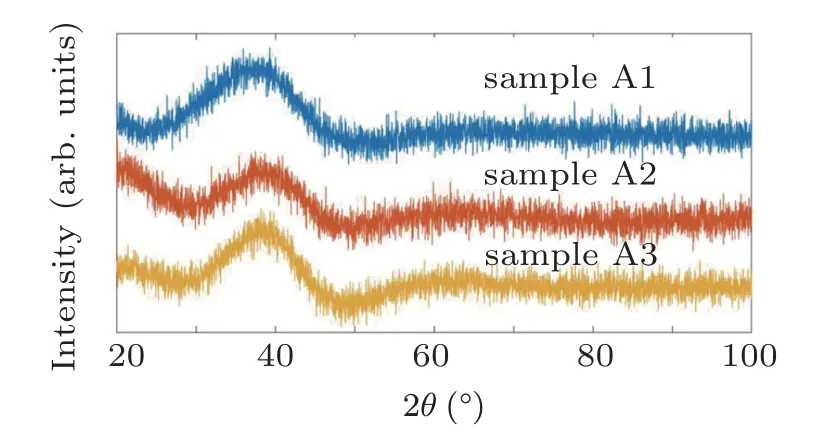
Fig.1. XRD patterns for samples A1,A2,and A3.
As given in Fig. 2, the endothermic event in the DSC curves determines the glass transition phenomenon under the heating process. The glass transition is accompanied with a sharp exothermic event related to the primitive crystallization process. It is also found that all the samples can be thermally stable up to temperature of ~775 K at 20 K/min heating rate,while at the higher temperature the crystallization event is activated in the amorphous structure. It is should be noted that all the specimens have two sharp crystallization peaks in the DSC curves showing that the crystallization event occurs in two main stages. In other words, at least two dominant crystalline phases may be formed during the heating stage in the DSC experiment. Based on detailed results of DSC experiment in 20 K/min(see Table 1),it is revealed that the Ag addition significantly decreases the melting point of ZrCo-based alloys.
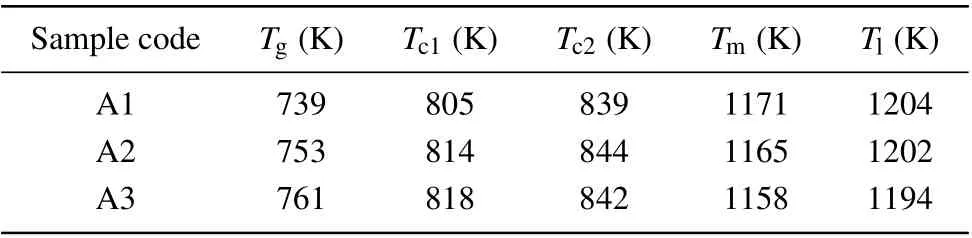
Table 1. The thermal characteristics of samples at the heating rate of 20 K/min.
According to the DSC analysis, the rise in heating rate leads to the shift of crystallization event and glass transition to the higher temperatures, which means that mentioned processes are inherently thermally activated. Considering this feature, it is possible to study the kinetics of glass transition and crystallization using varied kinetic approaches. As a most well-known kinetic approach,the Kissinger model can describe the thermally evolution of crystallization events in the solid-state reaction.[26]With a following equation,one can estimate the activation energy of crystallization(Ex)in the amorphous alloys:
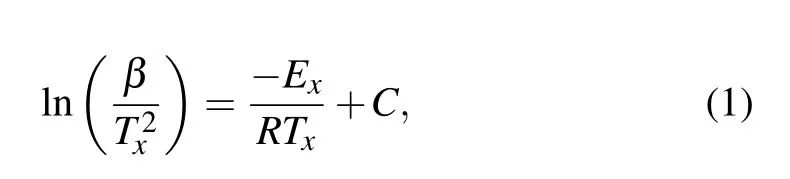
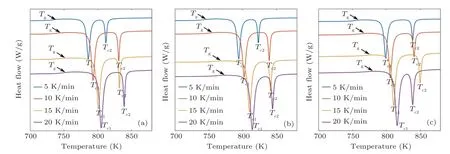
Fig.2. DSC curves for samples(a)A1,(b)A2,and(c)A3.
where C is a constant, R is the gas constant, and Txdefines the characteristic temperature, i.e., glass transition temperature(Tg)or crystallization temperature(Tc),obtained from the DSC results. Following the mentioned equation, the linear fit of 1/Txversus ln(β/T2x) can define the activation energy value.
Figure 3 illustrates the fitted plots of Kissinger model for all the specimens corresponding to both of crystallization and glass transition events. At the first glance, one can see that the incline of fitted plots for Tgcurves is higher than the Tcones,which means the Egis higher than the Ec. Moreover,it is found that the Ag addition may increase the Eg, while the Ecvalues decreases with Ag dopant in the glassy alloy. Nevertheless, the studies indicate that the Kissinger model is not applicable in explaining the crystallization kinetics of metallic glasses for all the situations.[18]Hence it is required to consider other approaches for more investigations.
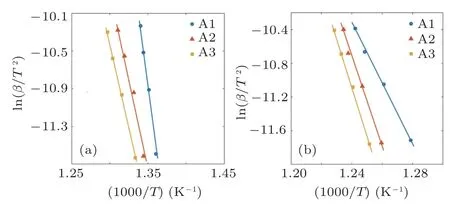
Fig. 3. Kissinger fitted plots for (a) glass transition and (b) crystallization event.Flynne Walle Ozawa(FWO)is another model especially proposed for estimating the activation energy of crystallization event in the metallic glasses.[18] Considering Eq.(2),the FWO method relates the 1/Tc to ln(β)in order to calculate the effective activation energy:
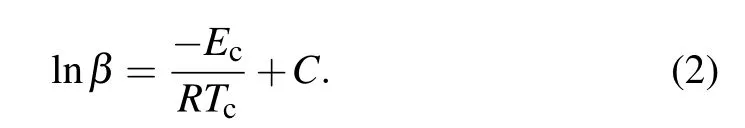
The FWO crystallization plots of samples A1,A2,and A3 are illustrated in Fig. 4(a). To have an accurate comparison, the calculated activation energy values for the crystallization event based on FWO and Kissinger approaches are simultaneously given in Fig.5. One can see that both approaches confirm the activation energy (Ec) enhancement with the rise in Ag content; however,the Kissinger method shows slightly higher Ecvalues in comparison with the FWO. The increasing trend of Ecdemonstrated that the silver addition changes the atomic arrangement of structure somehow to make difficult primary nucleation and subsequent crystallization.
To evaluate the crystallization evolution, the samples were annealed at their 1.2Tgtemperatures and analyzed with the XRD experiment(see Fig.6). According to the crystalline peaks, the B2-ZrCo and Zr6CoAl2metallic phases are dominant in the microstructure, which were also shown in other works.[6]Regarding the structural relaxation event, a novel approach was developed by Moynihan et al.[27]relating the activation energy to the glass transition
Considering Eq. (3), the linear fit of 1/Tgand lnβ can explain the activation energy value for the glass transition phenomenon. Figure 4(b)presents the Moynihan plots,compared to the FWO results.
Fig.4. (a)The FWO plot for crystallization and(b)Moynihan plot for glass transition.
Figure 5 also shows how the Ag addition may affect the Egtrend for samples A1,A2,and A3,respectively. According to the results, both Moynihan and Kissinger methods present similar Egvalues. It is also found that the Ag addition leads to a significant decrease in activation energy of glass transition. Hence, it is concluded that the sample A1 with lower Ag content has the stronger interactive metallic bonds leading to a higher activation energy. Moreover, figure 5 indicates that Ecis lower than Egvalues for all the specimens.This outcome was also reported for Zr-based BMGs in other works.[18]In general, the structural relaxation occurs at the temperature range much lower than the crystallization temperature. Hence, the atomic mobility at the glass transition temperature is considerably less than the crystallization process and consequently,the energy barrier for atomic rearrangement may be high leading to a more activation energy in the glass transition event.
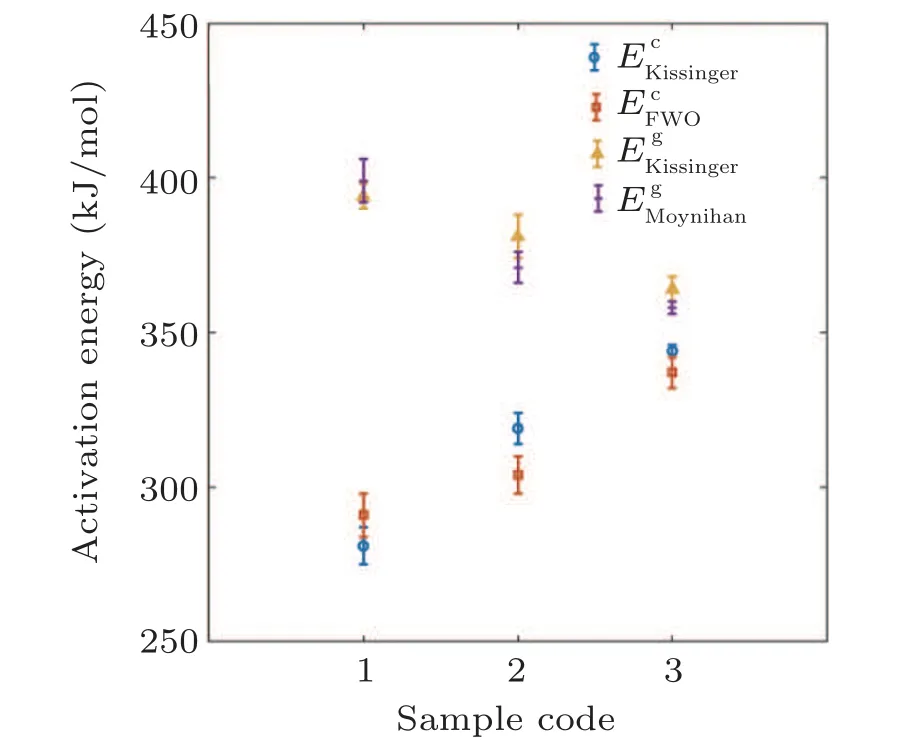
Fig. 5. The activated energy for glass transition and crystallization event based on the Kissinger,FWO,and Moynihan models.

Fig. 6. The XRD patterns of samples A1, A2, and A3 after 2-h annealing treatment at 1.2Tg.
Besides the mentioned approaches, Johnson–Mehl–Avrami approximation can be applied for explaining the crystallization kinetics in metallic glasses.[28]According to Eq. (4), the time dependence of crystallization volume fraction can be described as follows:

where n is the kinetic exponent used to define the crystallization morphology. Moreover, equation (5) is employed to describe α parameter as a function of temperature at the nonisothermal situation:[28]
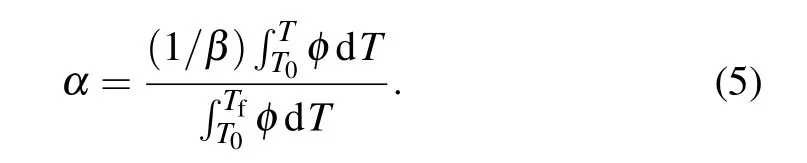
In this equation,φ defines the heat flux and T and Tfshow the lower and upper temperatures that the crystallization occurs.It should be noted that T and Tfwere considered at the beginning and the end of first crystallization peak in each DSC curve.Considering Eq.(5),α changes as a function of temperature for samples A1,A2,and A3 are demonstrated in Fig.7.
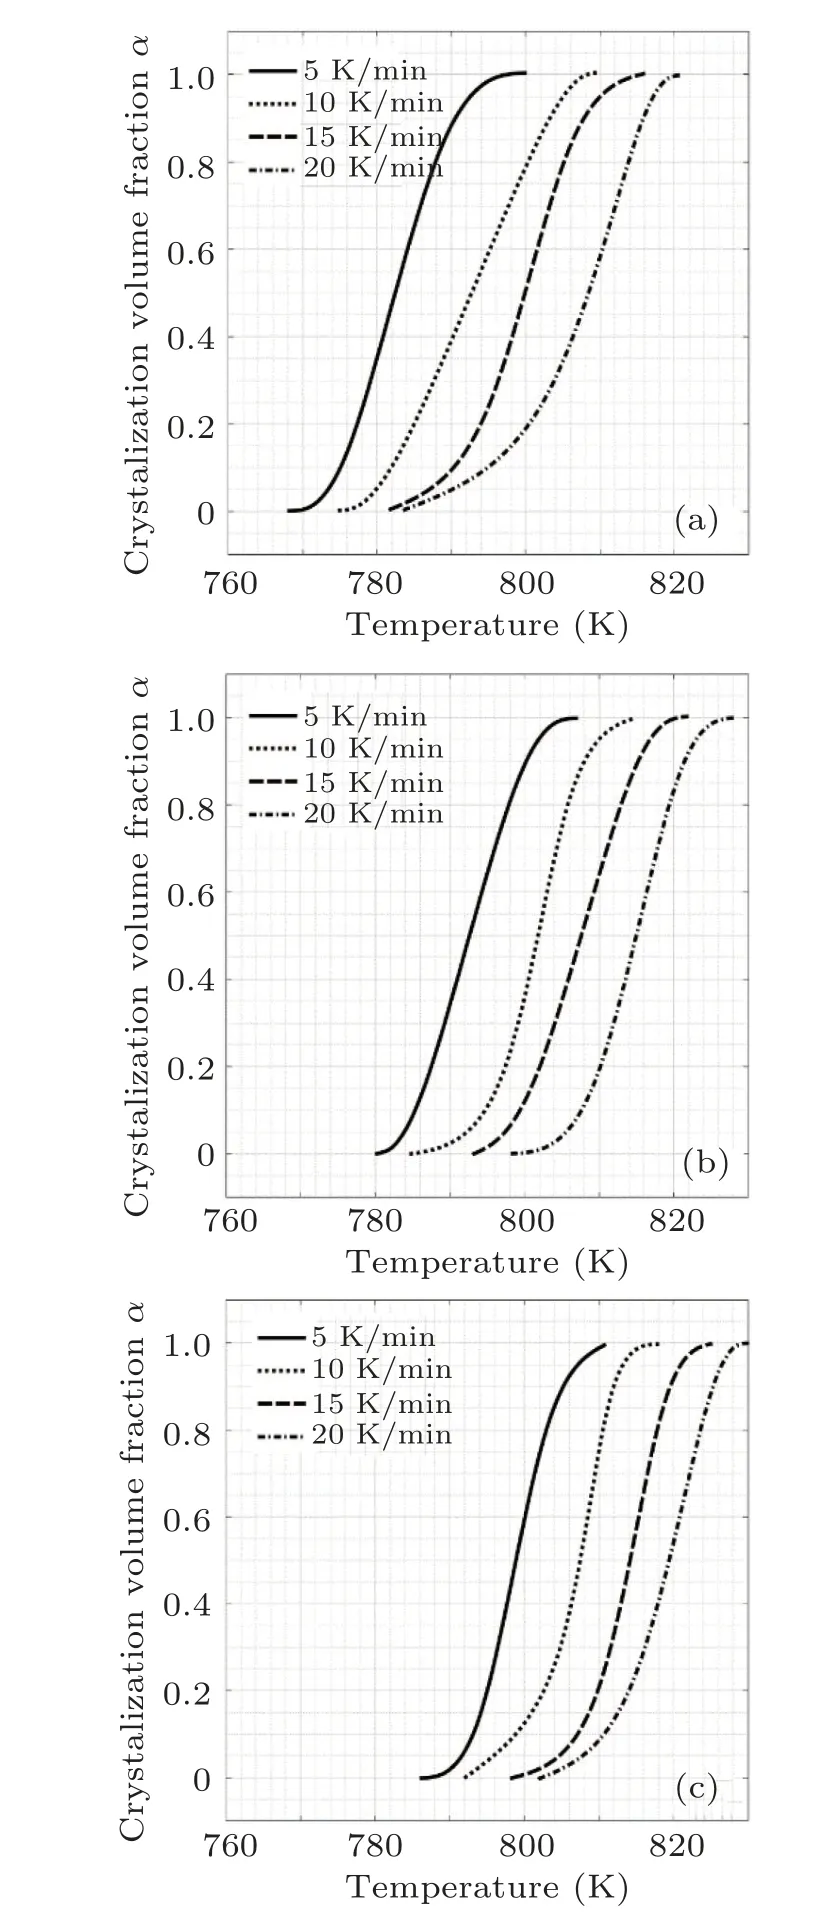
Fig.7. The crystalline fraction as a function of the temperature for(a)A1,(b)A2,(c)A3.
The results show that the α–T plots are in the form of sigmoidal curves. This type of trend is conventional for glassy alloys under non-isothermal situations.[29]It should be noted that there are two peaks in the crystallization region and a fitting procedure was used to provide sigmoidal curves.The various heating rate (VHR) method is one of the recent thermo-analytical models explaining the crystallization kinetics of glassy materials based on JMA transformation approach,given in Eq.(4).[30]According to VHR method,the n exponent is averaged over whole completion of crystallization as a function of heating rates. To obtain the n value, it is necessary to consider two different times and temperatures for two diverse α1and α2at a certain heating rate:[30]
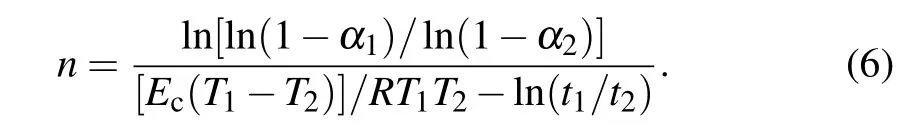
The calculations were done and the n values for the samples are presented in Fig. 8. As shown clearly, n values are in the range of 1.85–2.45 indicating the three-dimensional crystalline growth with a decline in nucleation rate. Although,this event is common in all the samples,n values are reduced with the increment of silver content. So it is concluded that the silver can play an important role in the inhibition of nucleation and growth of crystalline metallic phases.
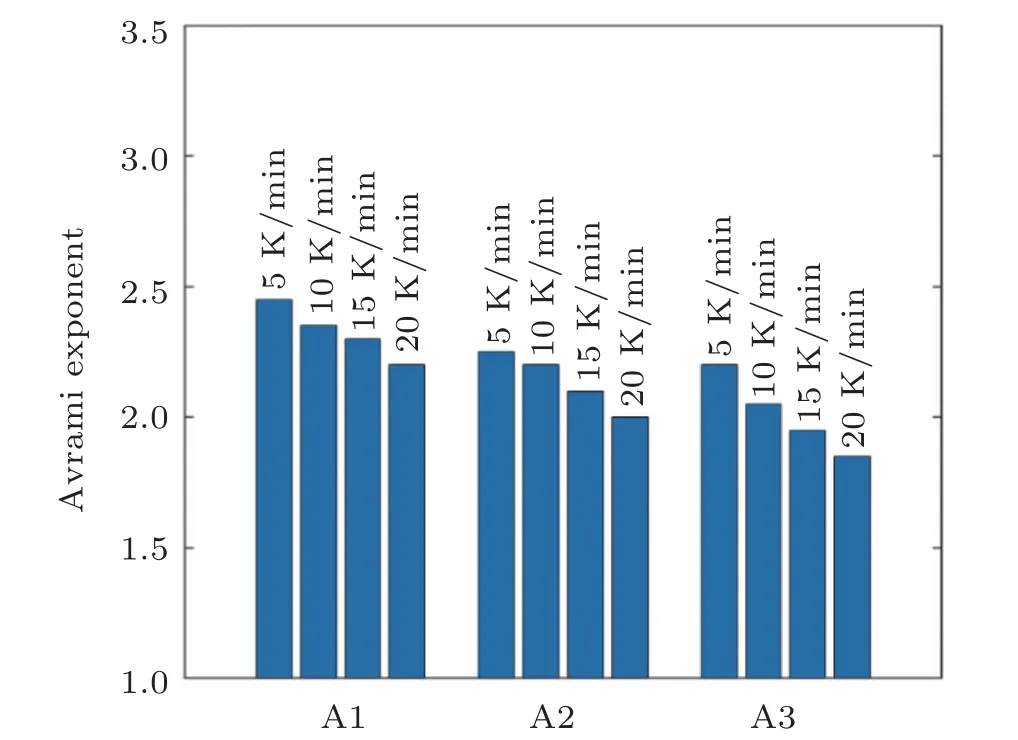
Fig.8. Avrami exponent values for different situations.
Fragility is another parameter describing the inherent features of metallic glasses. In general,the glass relaxation in the BMGs follows Vogel–Fulcher–Tammann (VFT) equation or the Arrhenius equation. According to the Arrhenius behavior, the fragility can be studied in the relation to the effective activation energy:[31]
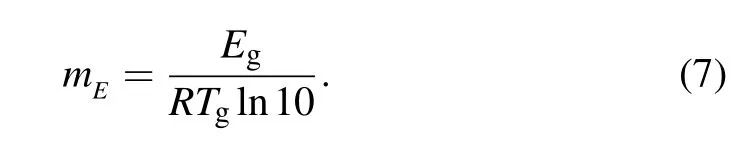
Table 2 gives mEvalues obtained from the samples heated with rate of 20 K/min. As observed, the calculated values are in the range of 33–41 for all the specimens. This indicates that our BMG alloys are classified in the“intermediatefragile-strength” metallic glasses. The results also show that mEvalue declines with the rise in Ag content. Hence, it is concluded that the Ag-rich BMG composition with lower mE
value has the higher GFA and better thermodynamic stability. To confirm this conclusion, it is also required to evaluate the characteristic temperatures such as γ and Trgparameters describing the GFA in the glassy materials.[32]Based on calculated values in Table 2,the Ag addition leads to the increase in γ and Trgparameters. The GFA parameter is also correlated to the critical diameter so that with Ag minor addition the critical thickness was significantly enhanced. It should be noted that metallic glass formers with better GFA are needed a lower driving force to thermodynamically create crystallization phase in the microstructure.[33]In other words,the silver addition declines the driving force for crystallization and defines a lower activation barrier for crystallization. Hence, the sample A3 has the lowest driving force, which is also confirmed by Ec calculation from the FWO and Kissinger equations.
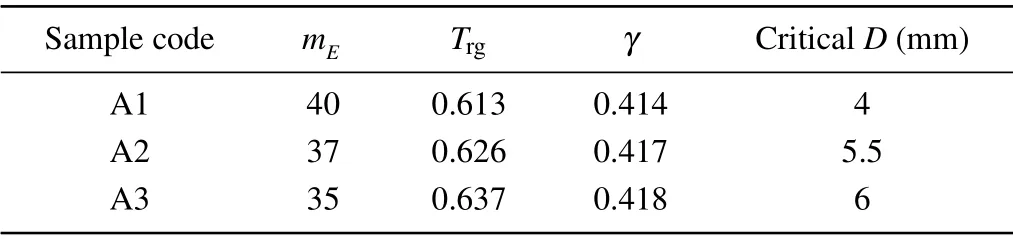
Table 2. The basic parameters attained from the DSC results at the heating rate of 20 K/min.
4. Conclusions
This work aims to show that how the minor addition of Ag influences the thermal stability,GFA and activation energy of glass transition and crystallization kinetics in the ZrCoAgAlNi BMGs. It was revealed that the rise in Ag content led to the decrease in activation energy for glass transition,while the activation energy for crystallization increased. The results also showed that the Avrami exponent is in the range of 2.1–2.7 for all the specimens;however,it declined with rise in Ag content. This event affected the crystallization kinetics and repressed the nucleation and growth. Evaluating fragility parameter, it was shown that all the samples were classified in the intermediate strength BMG alloys. Finally, it was found that the Ag addition improved the GFA and thermal stability through the small changes in the structural arrangements.
杂志排行

Chinese Physics B的其它文章
- Two-dimensional finite element mesh generation algorithm for electromagnetic field calculation*
- Stable water droplets on composite structures formed by embedded water into fully hydroxylated β-cristobalite silica*
- Surface active agents stabilize nanodroplets and enhance haze formation*
- Synchronization mechanism of clapping rhythms in mutual interacting individuals*
- Theoretical study of the hyperfine interaction constants,Land´e g-factors,and electric quadrupole moments for the low-lying states of the 61Niq+(q=11,12,14,and 15)ions*
- Ultrafast photoionization of ions and molecules by orthogonally polarized intense laser pulses: Effects of the time delay*