Effect of high-or low-speed fluctuations on the small-scale bursting events in an active control experiment*
2021-01-21XiaoTongCui崔晓通NanJiang姜楠andZhanQiTang唐湛棋
Xiao-Tong Cui(崔晓通), Nan Jiang(姜楠),2,†, and Zhan-Qi Tang(唐湛棋),2,‡
1Department of Mechanics,Tianjin University,Tianjin 300354,China
2Tianjin Key Laboratory of Modern Engineering Mechanics,Tianjin 300354,China
Keywords: turbulent boundary layer,active control,discrete wavelet decomposition,small-scale bursting process
1. Introduction
Over the past few decades, there has been growing understanding that turbulent boundary layers (TBL), in spite of their apparent randomness, possess certain recurrent features, which are usually defined as “coherent structures”.[1,2]These motions transport momentum in TBL and provide a means of producing turbulent kinetic energy.[3,4]Moreover,the coherent structures such as streamwise vortices and velocity streaks(which constitute the near-wall cycle)also play a key role in turbulent flow control.[5–8]The bursting events of the near-wall cycle are closely related to the skin friction distribution.[9]Thus, it is meaningful to extract and evaluate these structures in flow control studies.[10–12]There are serval detecting methods on coherent structures. Blackwelder and Kaplan first explored the variable integration time averaging technique(VITA).[1]By this technique,an event is assumed to occur when the short time variance exceeds a certain threshold multiple of the mean square signal.[13]The u-level or mulevel method also has been applied in numerous studies.[14,15]Combining the coherent structures and intermittency,Camusi et al.[16,17]introduced another way to detect these structures based on the wavelet transform in homogeneous and isotropic turbulence. Here,intermittency is related to the non-Gaussian distribution of the velocity gradients or the rate of turbulent energy dissipation. After that,this method was also applied in inhomogeneous and anisotropic flow conditions.[6,18–20]
As mentioned above, quasi streamwise vortices (QSV)are the typical coherent structures,which contain ejection and sweep processes.[21–24]The ejection process occurs on the updraft side of QSVs, wherein the low-speed fluids in the inner layer are lifted away from the wall to the outer layer. The sweep process occurs on the downdraft side of QSVs,wherein the high-speed fluids move downward to the wall. Because of the close relationship with skin friction,[25,26]these processes often were selectively controlled in numerous drag reduction DNS or experimental studies. Carlson and Lumley[27]employed a Gaussian bump as an actuator for opposition control.While the sweep events were detected,the bump would be activated to push the high-speed fluctuations away from the wall.Xu et al.[11]also studied the active control of the near-wall streamwise vortices via DNS databases of fully developed turbulent channel flow at a low Reynolds number. Choi et al.[9]conducted the experimental research by using the opposition control to suppress the downwash of high-speed fluid during the sweep events to reduce the skin-friction drag. In their research,a hot-wire probe was fixed on the test surface to detect the sweep events by measuring the temporal change of streamwise fluctuations in the near-wall region of TBL.
Nevertheless, relatively less attention was paid to how the high- or low-speed detecting signals affect the response of near-wall bursting events to the control, which could help us to develop a potential approach to modify the turbulence boundary layer flows. In this paper,a further step is taken on the basis of Tang et al.’s study.[6]A piezoelectric(PZT)vibrator was employed to produce periodic synthetic input into the near-wall region of TBL and the TBL hot-wire probe was settled downstream of the vibrator to measure the u-component velocity at various locations in TBL. By setting a singlefilament hot-wire probe in front of the actuator as the detector, we could identify the high or low fluctuations and then investigate the impact of the detecting signals on the bursting events. It should be noted that the high or low speed fluctuations mean the positive or negative value of detecting signals in this paper. Furthermore, because the small-scale intermittent events were correlated with highly spatial-temporal coherent structures,[16,28]we would focus on the impact on the smallscale bursting events in this research. The paper is organized as follows. The experimental setup is introduced in Section 2.In Subsection 3.1, the drag reduction results and other basic parameters are summarized. The methodologies used for detecting signals(high or low speed fluctuations)and the smallscale intermittent events are described in Subsections 3.2 and 3.3. In Subsection 3.4, the impact of the detecting signals on the small-scale bursting events is analyzed. Finally, conclusions are listed in Section 4.
2. Experimental setup and conditions
The experiments were conducted in a closed loop wind tunnel in Tianjin University. Figure 1 shows the sketch of the experimental setup. The coordinates x, y, and z refer to the streamwise,wall normal,and spanwise directions,respectively. TBL flow developed along a flat plate, which was mounted vertically in the test section. The pitch angle was adjusted to assure a zero-pressure gradient in the streamwise direction. A tripwire was fixed at x=80 mm downstream of the leading edge,and a sandpaper band was attached following the tripwire to accelerate the flow transition.
The freestream velocity was U∞=9 m/s. TBL was fully developed before the control mechanism and the positions of measurement, which were located after x =1200 mm. The Reynolds number was Reτ= δuτ/v = 560, where δ is the boundary layer thickness, uτis the friction velocity, and v is the kinematic viscosity.
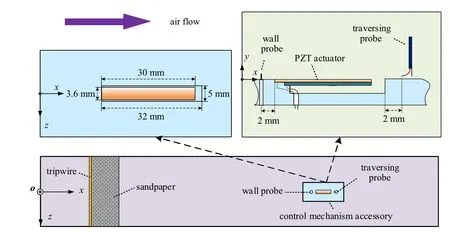
Fig.1. Schematic of the experimental setup.
The control mechanism consisted a PZT element, which was flush-mounted with the plate surface (see Fig. 1). It has a dimension of 30 mm×0.42 mm×3.62 mm (length ×thickness × width). In order to achieve better control effect,the PZT actuated frequency (fp) was set at 160 Hz, which corresponds to the vortex shedding frequency in the nearwall region.[29,30]The amplitudes of actuator’s free end were Ap=0.6 mm, 0.4 mm, 0.1 mm corresponding to the driving voltages of Up=80 V,50 V,20 V,respectively.
Two hot-wire probes were used in the present study,both of which were operated by the TSI IFA-300 hot-wire anemometer unit in constant temperature mode. The calibration of these two probes was conducted using an air velocity calibrator over the velocity range 0–15 m/s. The first probe was used to measure the u-component velocity at various locations in TBL,thus referred to as the traversing probe. It is a TSI-1621 A-T1.5 miniature boundary layer probe. The sensing element of the probe is a tungsten wire with a diameter of 4 μm and a length of 1.25 mm. The probe was mounted on a 200 mm-long right-angle support, which was attached to a three-dimensional traverse gear. The traversing resolution was 5 μm in all directions. The traversing probe was used to map the u-component velocity at 62 different normal locations.The second hot-wire probe was a wall-mounted sensor to detect the bursting events by measuring the temporal change of the ucomponent velocity in the near-wall region of the TBL,which was referred to as the wall probe (see Fig. 1). This is a TSI straight probe, made of a tungsten wire of 4 μm in diameter and 1.25 mm long. The wall probe was fixed on an adjustable bracket behind the flat plate,and stretched out through a small hole on the plate(see Fig.1). The sensing wire was positioned on the required height(y+=14 in the current study). Melted wax was then poured into the hole and the surface was made flush with the surrounding test-plate surface after the wax was cured. This construction of the wall probe allowed only the sensing wire and prong tips exposed to the flow without causing aerodynamic interference with the probe body. During the experiments, these two probes acquired data simultaneously,which mean they both obtained 62 different time sequences in each case. The sampling rate and low pass cut-off frequency were 100 and 50 kHz,respectively. Each sequence comprised of 222velocity samples or approximately 42 s.[31]
3. Results and discussion
3.1. Basic flow structures
where the subscripts on and off denote measurements with and without control,respectively.The reduction rate and other fundamental parameters are presented in Table 1. It can be seen that case C acquires the lowest reduction rate of Rf=4%,and case A obtains the highest value of Rf=18%. The results confirm that with fpkept constant,the drag reduction effect is positively correlated with Ap.[21,23]
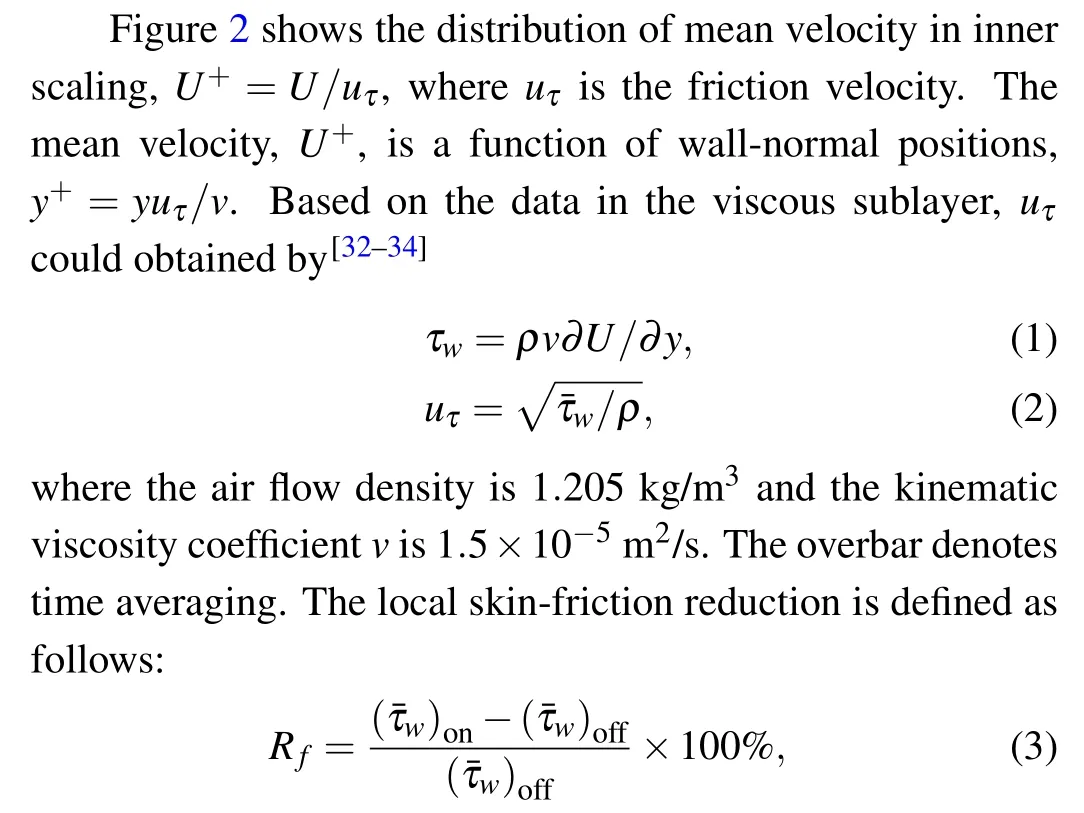
As shown in Fig.2,the velocity curve of the uncontrolled case fits well with linear law and log law,indicating a full developed TBL in the measuring location. As for different controlled cases,there are varying degrees of up-shifts in the logarithmic region. As indicated by other researches,[35,36]this change is the visual evidence of control effect in the view of whole TBL and the results also agree well with the reduction rates in Table 1.
Fig.2.Distributions of the mean streamwise velocity in the inner scaled units.

Table 1. Summary of the experimental parameters.
3.2. Wavelet transforms
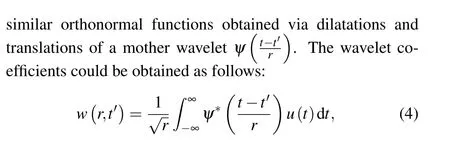
where r and t′are the wavelet scale and time, and the superscript * refers to the complex conjugate. The convolution is calculated in the frequency domain in each scale, thus u(t)is decomposed in scale-time space. The Daubechies wavelet(dbN, N =4, N is the number of vanishing moments) is employed in this work, which is compactly supported orthonormal. By db4 wavelet,each time sequence of the velocity fluctuation could be decomposed into 19 different scales in our study.
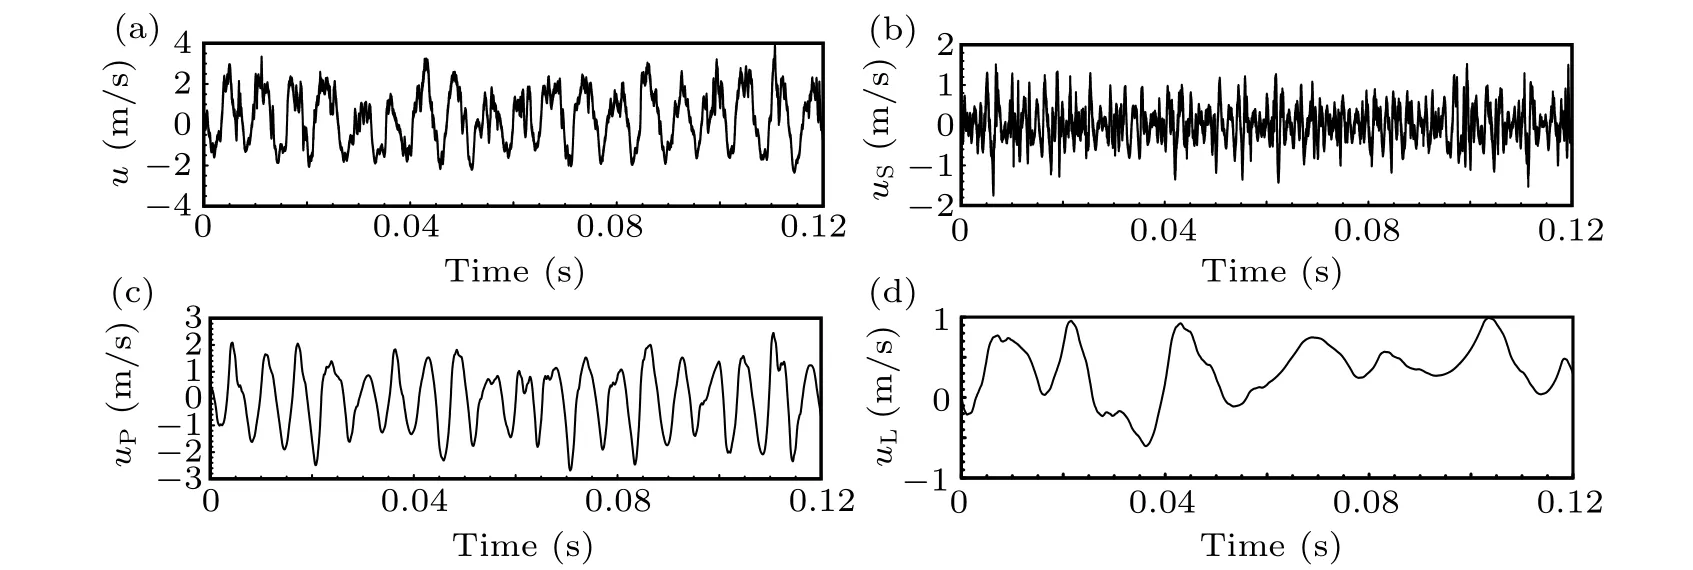
Fig.3. Example of raw fluctuation signals[u(t)]at a wall normal position of y+=14 in case A and the wavelet coefficients in different modes(small-scale mode[uS(t)],perturbed mode[uP(t)],and large-scale mode[uL(t)]).
3.3. Methods for events detection
As mentioned above,a wall probe was fixed upstream of the vibrator to detect the high-and low-fluctuations at y+=14,which could reflect the characteristics of the near-wall coherent structures.[9,30]According to Kreplin and Eckelmann,[39]the coherent structures could be observed over a streamwise distance Δx+>1000. The study reported by Johansson et al.[40]also indicated that these structures are prevalent and persistent features of the near-wall region. In this work, the distance between the wall probe and the free end of the vibrator is Δx+1=896,which must be larger than the actuator length and also ensure that most of passing coherent structures’major characteristics are largely unchanged.The traversing probe is 4 mm(Δx+2=112)downstream of the free end of the vibrator,which guarantees that the probe could effectively catch the perturbation effect of the oscillator on the coherent structures.Moreover, the large-scale components are more robust than the small-scale fluctuations in TBL,so we extracted the largescale signals to detect the high-and low-fluctuations. It would ensure as much relevance between the fluctuation signals of the wall probe and traversing probe as possible.
Figure 4 shows the maximum correlation coefficient(rmax) of the large-scale fluctuating components between the wall probe and the traversing probe. It can be obtained as follows:

where uLand udLare the large-scale fluctuating components of output signals from the traversing probe and the wall probe,respectively, and subscript ‘RMS’ represents their RMS values. The τccorresponds to the maximum ruL,udL,as illustrated in Fig. 4. Based on the result of τc, the convection velocity could be calculated,which remains nearly constant at u+≈11 in the near wall region (y+<27). This compares well with the results of Kreplin and Eckelman,[39]who observed that coherent structures convect at a speed of u+≈12. Johansson et al.[40]found the convection velocity to be almost constant in the near-wall region of the turbulent boundary layer up to y+=30. Furthermore,based on the former study by Tang and Zheng,[30,41]the impact of the vibrator concentrates mainly on y+<100,and as shown in Fig.4,the peak values of ruL,udLare relatively large(rmax>0.3)in this region(y+<100). So,we would focus on the near-wall region in the following multiscale intermittent bursting events study.
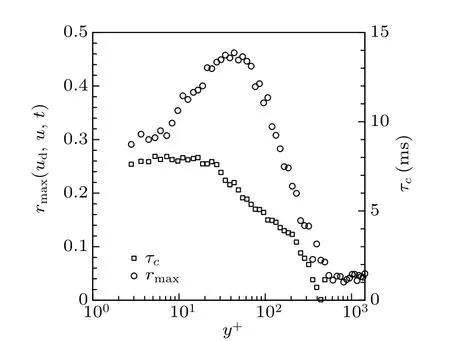
Fig. 4. The circles represent the peak cross-correlation values after allowing suitable time shift between the u-component velocities measured by the wall probe (at y+ =14) and the traversing probe in the downstream. The rectangles show the time shift applied to obtain peak cross-correlation values.
About the local intermittent bursting event analysis, two principal indicators are employed to extract the bursting signals in current study, which have been confirmed by former works.[6,16,21]
Flatness factor is defined as follows:[42]
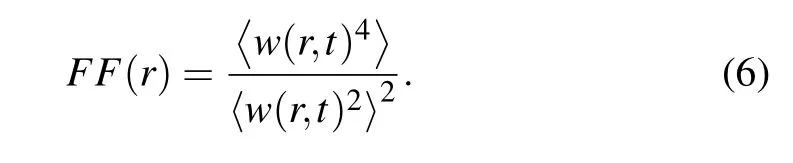
This function gives the level of intermittency at the scale.So, the difference with respect to the Gaussian statistics with FF(r)=3 could be directly assessed.

Fig.5. (a)The large-scale fluctuating signals udL. (b)Example of LIM(r,t)(black line)and the detected small-scale bursting event(orange squares).
Local intermittency measure (LIM) is defined as follows:[37]

The quantity w(r,t)2in this function might be interpreted as the energy contained in the fluctuating signals at scale r. Thus the LIM could enhance non-uniform distributions of energy,which is a good qualitative indicator of intermittency and of the magnitude of the energy fluctuations.[16]Following the study of Tang et al.,[5]we could localize the coherent structures for all scales by these two indicators. Figure 5(b)shows the intermittent energy bursting segments LIM(black line)and the intermittent bursting segments (orange symbols) selected using the above method at small scale(uS)at y+=13 in case A. As can be seen, the high peaks (orange symbols) reflect the existence of coherent structures,which should correspond to a high energy level. Moreover, these structures also show the distinct intermittency, which are not space filling in the temporal domain. Figure 5(a) shows the large-scale fluctuating signals udLobtained by the wall probe at the same time sequence with the LIM in Fig. 5(b). It seems that most of the small-scale bursting events are coupled with the appearance of the positive fluctuation of udL. Tang et al.[6]indicated that there was a clear correlation between the positive velocity of the perturbed-scale mode uPand the small-scale bursting events. In this work,we take a further exploration on how detecting signals udLinterfere the relationship between uPand the small-scale bursting events.
3.4. The effect of the large-scale detecting signals on smallscale bursting event
Based on the discussion above, we believe that the LIM(r,t)is not only a measure of turbulent intermittency,but also an indicator of the energy burst magnitude. Therefore,the coherent structure signals at the specific scale of r could be extracted as follows:
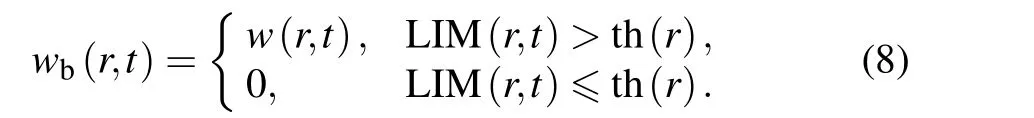
As an example, the orange symbols in Fig. 6 represent the small-scale bursting signals selected by formula(8)at y+=13 in case A. Additionally, for observing the small-scale intermittent events from the statistical view more comprehensively,we define Tbas the time between the leading edges of successive bursting periods,ΔT as the time between the trailing and leading edges of a single bursting period.[15]The bursting frequency(fb=1/〈Tb〉)is calculated based on the mean bursting period.[14]
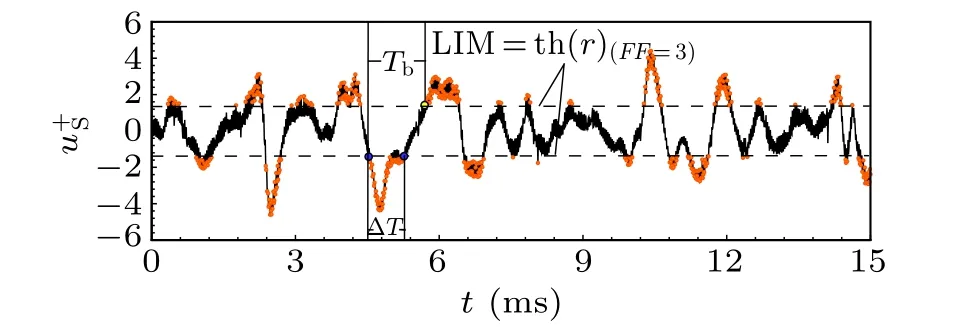
Fig. 6. Example of the bursting events (orange dots) detected from the small-scale fluctuations(black line). The time between successive events is denoted by Tb;while the duration of the event is denoted by ΔT.
The root mean square(rms)value of velocity fluctuations could reflect the mean turbulence energy intensity. Therefore,as shown in Figs. 7(a)–7(c), the ratios of ubrms,Sand urms,Sin different cases are calculated to describe the relative importance of the bursting process.[21]Here, ubrms,Srepresents the mean rms values of the small-scale bursting signals, and urms,Srepresents the mean rms values of the small-scale fluctuations. As can be seen,the perturbation apparently weakens the small-scale bursting process in the near-wall region(about y+<30)in all controlled cases,and case A has the best performance. Previous studies have confirmed that the disturbance could diminished the bursting intensity of the original fluctuations,which is considered to be associated with the weakening of streamwise vortices in the buffer layer.[9,23]Figure 7 further indicates that the small-scale components of bursting events are similarly interfered by the vibration. Besides,in each controlled case, the detecting signals udLhave a clear impact on the small-scale bursting process: while udL<0, the value of ubrms,S/urms,S(blue line) is lower than the no-detection controlled condition(red line)in the near-wall region. This variation may indicate that the perturbation decreases the bursting intensity more efficiently at low-speed detecting signals. On the contrary,when udL>0,the value of ubrms,S/urms,S(green line) gets higher than the no-detection controlled condition,which indicates a growth in bursting intensity.is positive correlated with amplitude Ap.
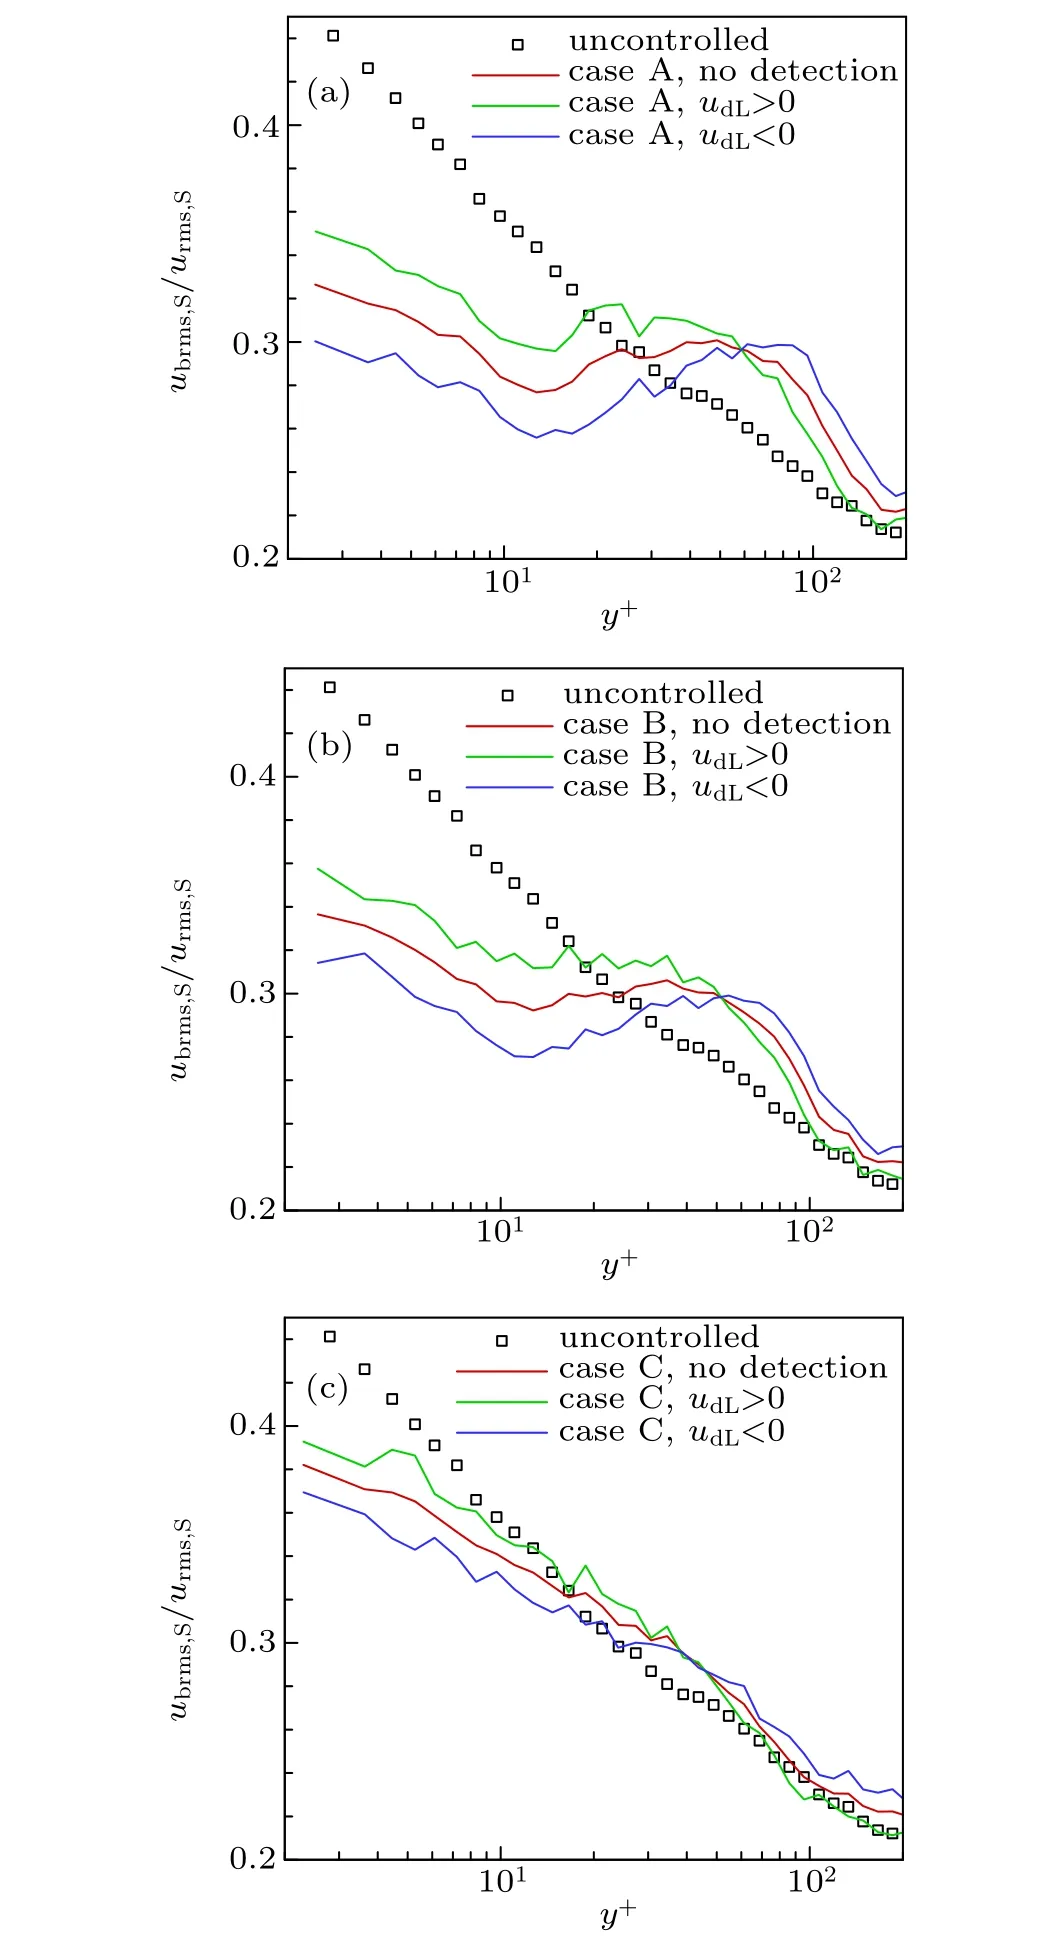
Fig. 7. The ratios of the rms value of the small-scale bursting signals(ubrms,S)and the small-scale fluctuations(urms,S).

Fig. 8. The distribution of bursting frequency (fb =1/) in different cases.

Fig.9. The distribution of the duration of the bursting event(〈ΔT〉)in different cases.

Fig.10. Conditional average,,over zero-crossings of up: (a)–(c)positive to negative,(d)–(f)negative to positive in case A.
To investigate how the detecting signals interfer the controlling on small-scale local bursting intermittency, we need more evidence. Here,a parameter to characterize the local instantaneous intermittent events at the scale r based on wb(r,t)is defined as(similar with the local intermittency measure defined in expression(7))
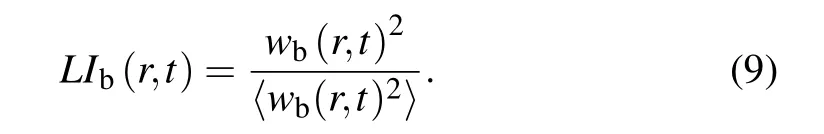
In the work by Tang et al.,[6]they conditioned LIbon the zero-crossings of upto study the arrangement of the smallscale bursting intermittency and the perturbed fluctuations(up). Similarly,we condition LIbon detecting signals udLand the zero-crossings of up, which is used to observe how the small-scale bursting events are arranged by both udLand upin the temporal domain.Specifically,we set the zero-crossings of upas the conditional location and study the small-scale bursting intermittency arrangements when the perturbed-scale fluctuations are changed from uP>0 to uP<0(high to low speed)and from uP<0 to uP>0 (low to high speed) at udL>0 or udL<0. In this way, the small-scale bursting processes are phase averaged.


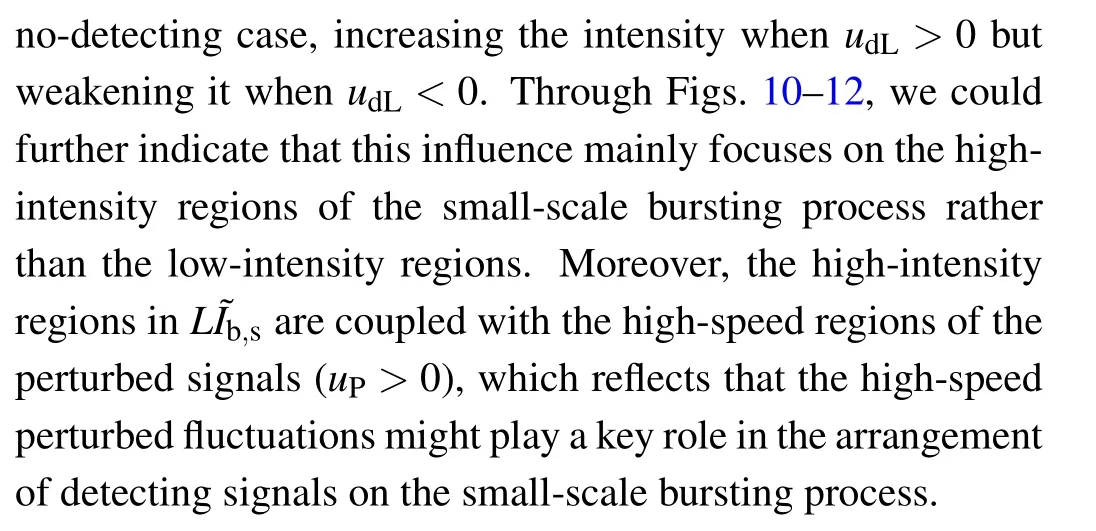

Fig.11. Conditional average,,over zero-crossings of up: (a)–(c)positive to negative,(d)–(f)negative to positive in case B.
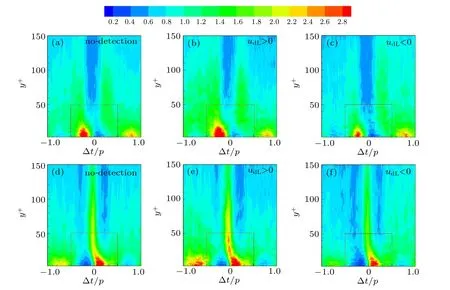
Fig.12. Conditional average,,over zero-crossings of up: (a)–(c)positive to negative,(d)–(f)negative to positive in case C.
4. Conclusions
Active control of a fully developed TBL over a flat plate has been studied. A single PZT actuator is employed to produce periodic input into the inner region of the TBL flow.A wall probe is fixed upstream of the actuator to identify the high- or low-speed large-scale fluctuations as the detecting signals. Then, the impact of the detecting signals on the small-scale bursting process is investigated based on the data acquired by the traversing probe downstream of the actuator.Furthermore,we also study how the detecting fluctuations interfere the arrangement of the perturbed mode on the smallscale bursting intensity. The major conclusions of the research are as follows.
(I) The actuator effectively disturbs the near-wall region of the TBL flow and reduces the drag. The drag reduction rate is positively related to the amplitude of the vibration. The maximum value of the rate is 18%in case A.
(II) The small-scale bursting process is obviously suppressed by the vibration in all controlled cases, and the detecting signals have an effect on this: compared with the nodetection case, the small-scale bursting intensity is restrained more apparently at high-speed detecting fluctuations but less impacted at low-speed detecting fluctuations.
(III) From a multi-scale perspective, the perturbed-scale fluctuations arrange the small-scale bursting process in the near-wall region. Moreover,the detecting signals have a clear impact on this arrangement, especially the high-intensity regions of the small-scale bursting events: the vibration enhances the intensity at high-speed detecting fluctuations but weakens it at low-speed detecting signals in these regions,which gives a direct evidence on how detecting signals interfering the small-scale bursting process.
杂志排行

Chinese Physics B的其它文章
- Two-dimensional finite element mesh generation algorithm for electromagnetic field calculation*
- Stable water droplets on composite structures formed by embedded water into fully hydroxylated β-cristobalite silica*
- Surface active agents stabilize nanodroplets and enhance haze formation*
- Synchronization mechanism of clapping rhythms in mutual interacting individuals*
- Theoretical study of the hyperfine interaction constants,Land´e g-factors,and electric quadrupole moments for the low-lying states of the 61Niq+(q=11,12,14,and 15)ions*
- Ultrafast photoionization of ions and molecules by orthogonally polarized intense laser pulses: Effects of the time delay*