R-branch high-lying transition emission spectra of SbNa molecule*
2021-01-21ChunRunLuo罗春润QunChaoFan樊群超ZhiXiangFan范志祥JiaFu付佳JieMa马杰HuiDongLi李会东andYongGenXu徐勇根
Chun-Run Luo(罗春润), Qun-Chao Fan(樊群超),†, Zhi-Xiang Fan(范志祥),‡,Jia Fu(付佳),§, Jie Ma(马杰), Hui-Dong Li(李会东), and Yong-Gen Xu(徐勇根)
1
School of Science,Research Center for Advanced Computation,Xihua University,Chengdu 610039,China
2State Key Laboratory of Quantum Optics and Quantum Optics Devices,Laser Spectroscopy Laboratory,College of Physics and Electronics Engineering,Shanxi University,Taiyuan 030006,China
Keywords: SbNa,transitional spectral lines,R-branch,difference converging method
1. Introduction
The antimonide is one of the most abundant elements of the mineral resources in the world.[1]Antimony compounds play a significant role in the chemical industry and electronic industry.[2–5]For instance, the antimony–sodium (SbNa) not only has a lowcost and simple preparation process, but also possesses a short response time and high sensitivity in the visible and near-infrared range, thus becoming one of the concerned photocathode materials.[6,7]However, uncertainties of the exact structure and physical mechanism bring the difficulty into theoretical guidance of manufacturing technique,which leads to over reliance on past experience in the production, thereby limiting the improvement of its performance.[8]In order to optimize the production and processing technology of SbNa-related materials,we need to explore the microcharacteristics of SbNa molecule by obtaining more exact rovibrational transition lines, which are valuable in understanding basic molecular structure.[9–11]
Long-term since, many research groups have focused on SbNa. In 1971,Evans and Watson[12]presented a new method of melting the antimony in sodium at 190◦C–550◦C. This method should be also suitable for studying the solubility of mixed solutes. In 1982, Redslob et al. reported a part of the new measurements of thermoelectric power,electrical conductivity,magnetic susceptibility and molar volume of liquid Na–Sb alloy. According to its electronic characteristics,it is confirmed that there is a typical semiconductor behavior within a certain range.[13]In 1985, Dolizy and Groliere used optical transmittance and Auger electron spectroscopy (AES) analyses to obtain some alkali antimonide compounds’ thermodynamic data, deduced and discussed the dissociation behavior of alkali antimonide varying with temperature and time.[14]In 1993, Songster and Pelton reported the phase diagram, thermochemical properties and phase equilibrium data of the Sb–Na binary system.[15]In 2013,Liu et al. modeled the Sb–Na binary system to facilitate the calculation and design of new fusible alloys based on experimental data,and reproduced the relevant thermochemical properties and phase diagram characteristics as well.[16]What is more,Setzer et al. were interested specially in the group Va-alkali,they reported transition emission spectral lines of all seven transitions from five low-lying excited states data of SbNa in 2015.[17]Phoebek et al. demonstrated the separation of amorphous and crystalline phases formed in a sodium-ion battery for the first time by tracking Sb–Na phase transformations in sodium-ion anodes.[18]However, there is still lack of research on direct correctly highlying excitation rotational quantum states data of SbNa, because of the limitations of current experimental equipment.
About theoretic calculation for transition spectra,the first principle calculation is a common calculation method used in the low-lying electronic states of antimony-containing diatomic molecules.[19,20]Due to the mutual interference of various coupling effects in the system, the theoretical prediction of high-lying excited rotational quantum states needs a large amount of calculation.[21]For a certain diatomic molecule,the calculation error of dissociation energy may be at a 102cm-1level, while vibration energy error may be at 10 cm-1level.[20,22]
More recently,the difference converging method(DCM)suggested by Fan et al. was used to calculate radiative opacities for hot metal plasmas,[23]differential cross sections(DCSs)of electron scattering from polyatomic molecules,[24]and transition spectral lines for diatomic molecules.[9,25,26]Among these cases,good predictions can be achieved by using the DCM treatment. In an effort to further understand the theoretical errors and accuracy for transition spectral lines,in the present paper we use the DCM and the principle of over determined linear equations to study the R-branch high-lying transition emission spectral lines of(0–0)band of the A21 →X21 transition of SbNa molecule. And,considering the source and propagation of the prediction error, the principle of over determined linear equations can be applied to interpolation and extrapolation, which yields an average prediction error at a 10-2cm-1level.
2. Theory and method
The classical expression of the R-branch transition spectral lines can be expressed as[27]
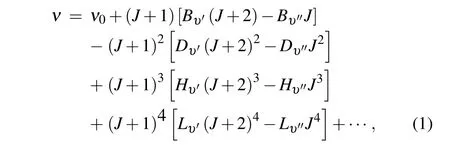
where J and υ are the rotational quantum number and vibrational quantum number,{Lυ′,Lυ′′,Hυ′,Hυ′′,Dυ′,Dυ′′,Bυ′,Bυ′′}are the rotation spectral constants. ν is the energy difference of rotational transition. ν0, the sum of the electronic state energy and the vibration energy,is a constant for the vibration transition.
Equation (1) can be applied to all transition states of the same transition band. Combining the idea of difference, we can further transform it into a functional form of the spectral constant Lυ(1~4)′′through the quadratic difference of ν1-ν2and ν3-ν4. Similarly, it is easy to transform into a functional form of the spectral constant Lυ(2~5)′′through the second-order difference of ν2-ν3and ν4-ν5. Since Lυ(1~4)′′= Lυ(2~5)′′, the Lυ′′ can be eliminated by further simplification, and the expression of Lυ(1~5)′can be obtained similarly, the derivation process is also fit for Lυ(2~6)′. Then,we can simplify and obtain the rotation spectral constant Lυ′. In this way, the rotation spectral constants {Lυ′,Lυ′′,Hυ′,Hυ′′,Dυ′,Dυ′′,Bυ′,Bυ′′} in Eq. (1) can be expressed by the expression composed of transition lines ν1~ν12and the corresponding rotational quantum number J1~J12. With the idea of the difference,a new analytical formula without any spectral constant can be finally simplified and sorted as follows:[9]
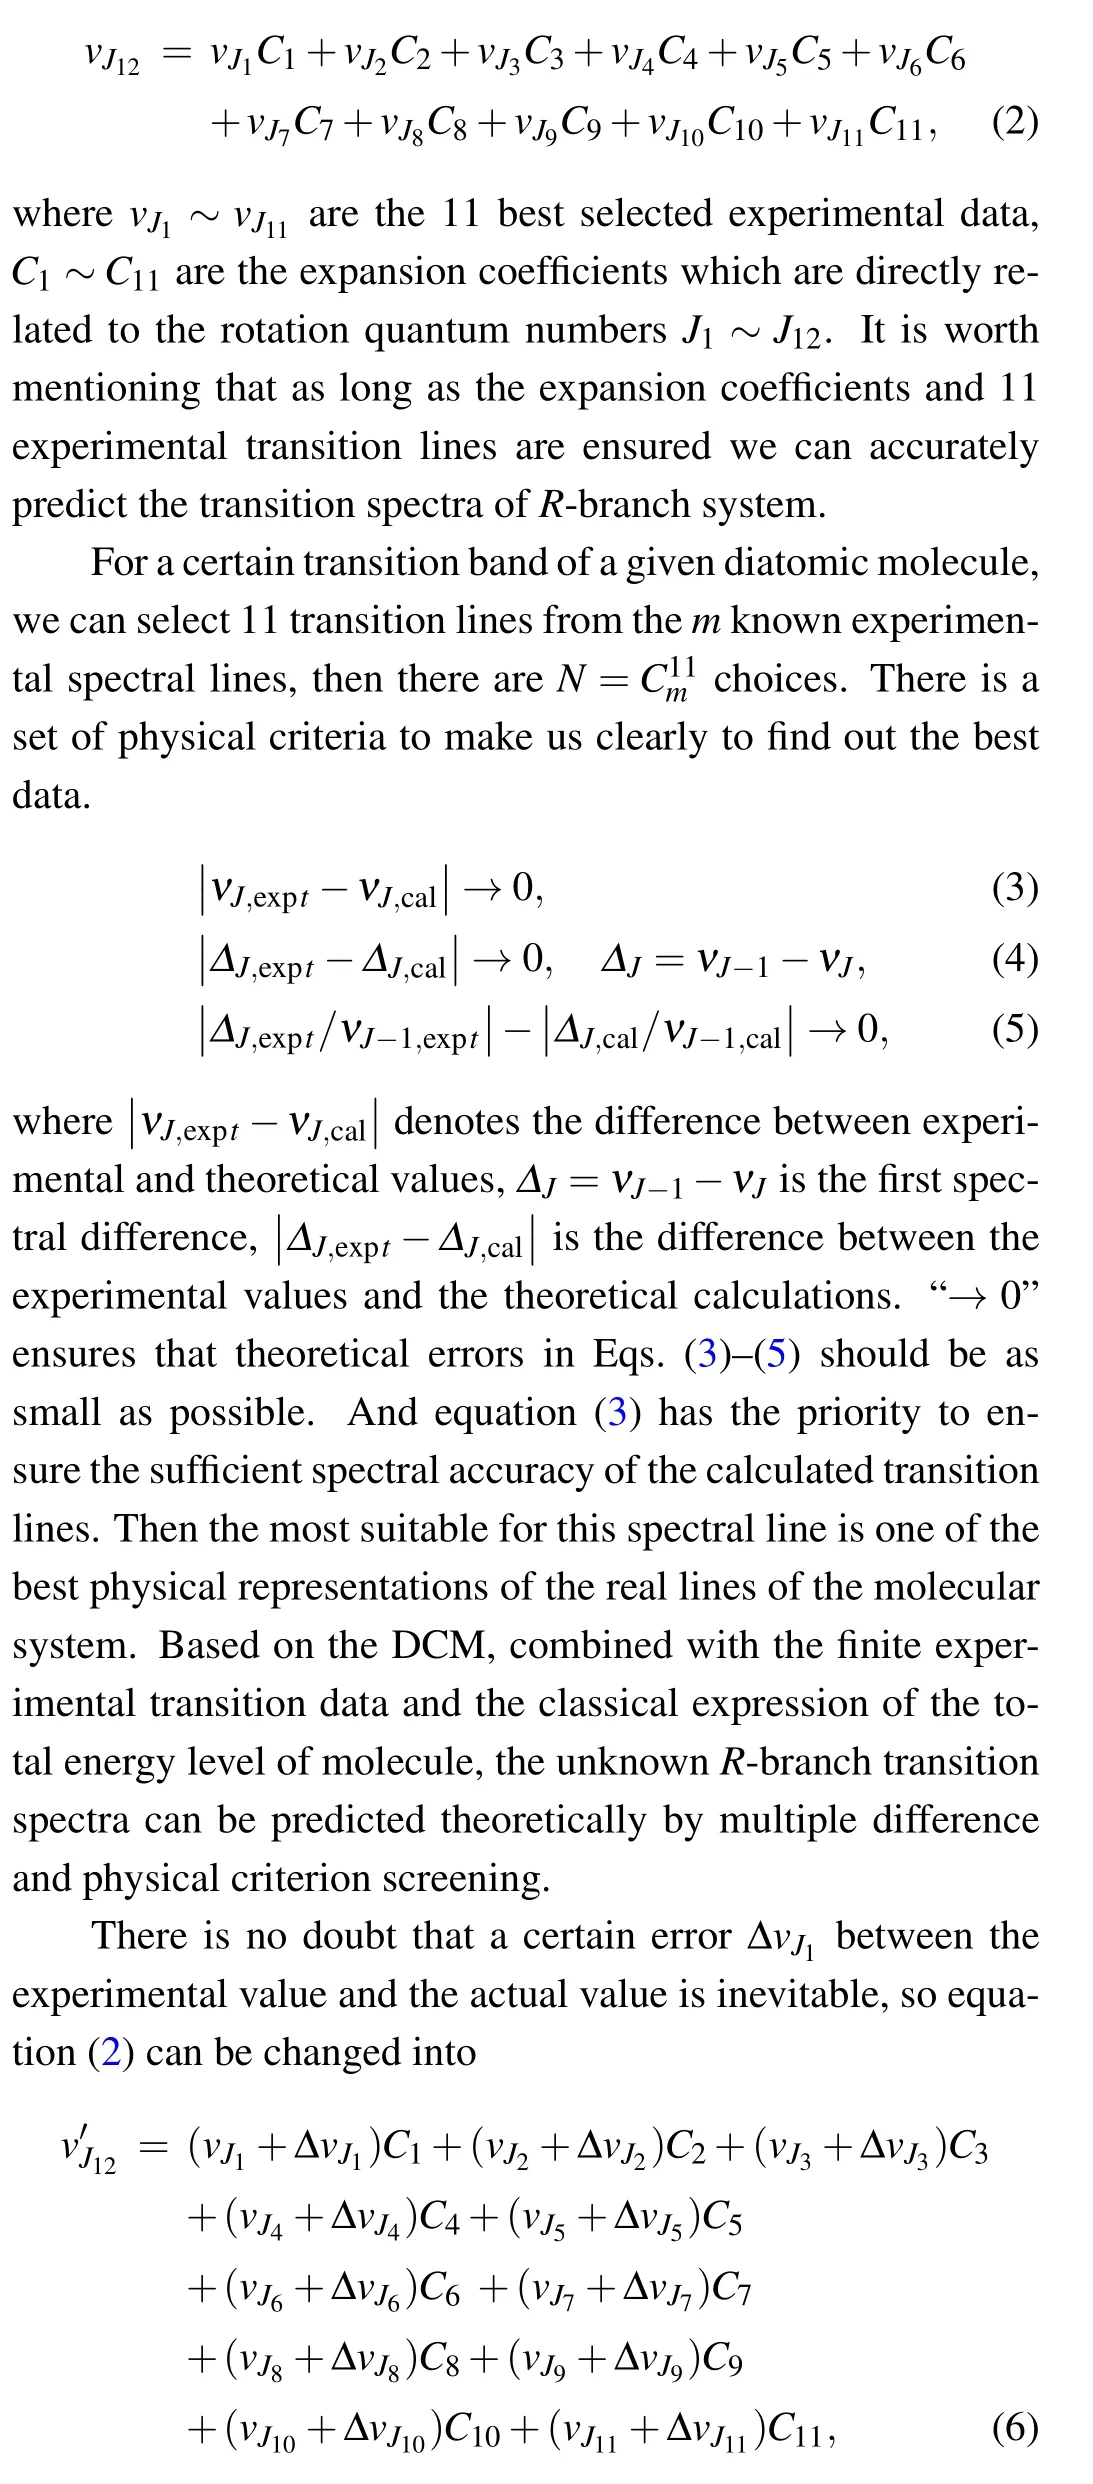
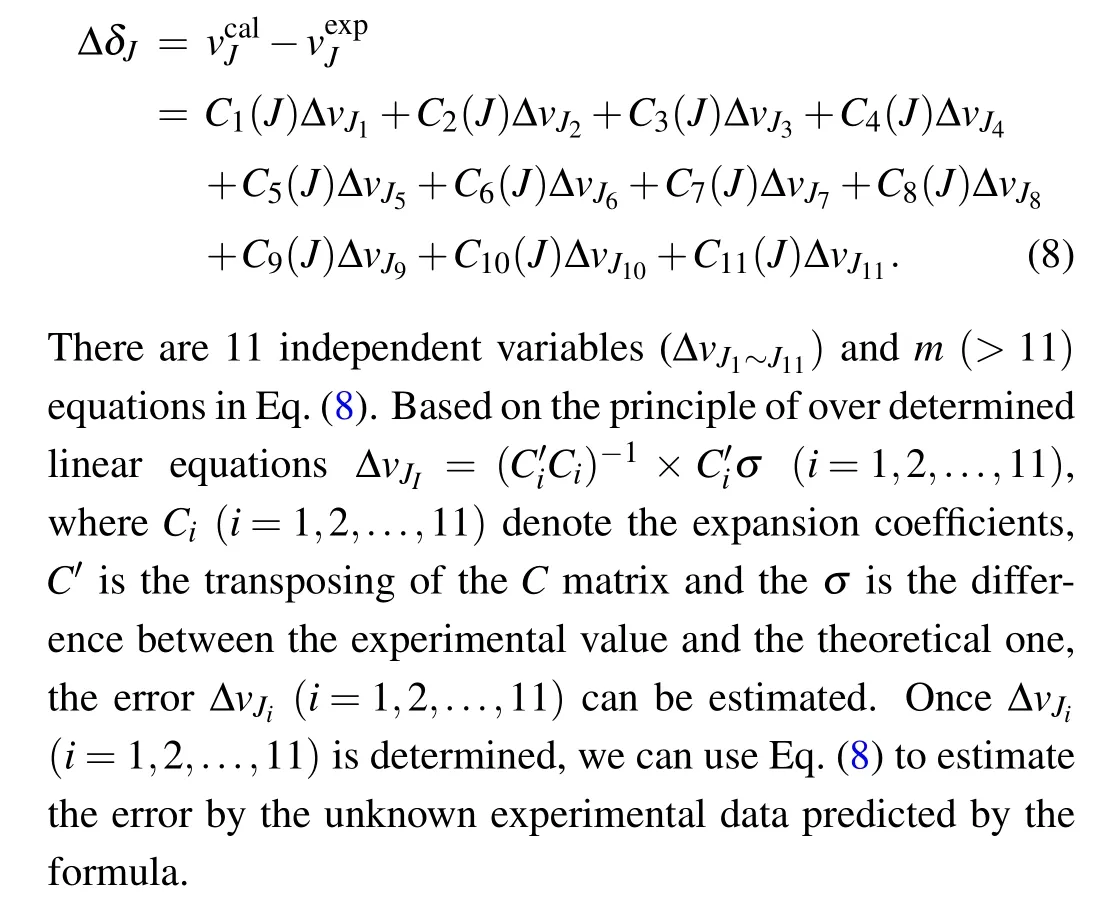
where ΔvJi(i=1,2,...,11)are the errors introduced in experiment. By comparing Eq.(2)with Eq.(6),the prediction error caused by experimental uncertainty is
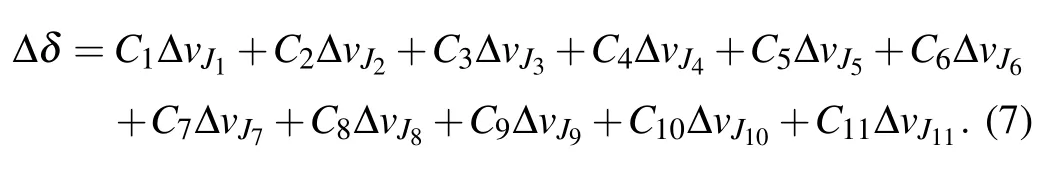
It is worth noticing that all high-lying transitional emission spectral lines can be predicted by Eq.(2). Supposing that the main reason for the theoretical error is the experimental uncertainty of the selected 11 transition lines,and can be estimated from Eq. (7). So, if there are m (>11) known experimental transition lines,there will be m linear equations
3. Results and discussion
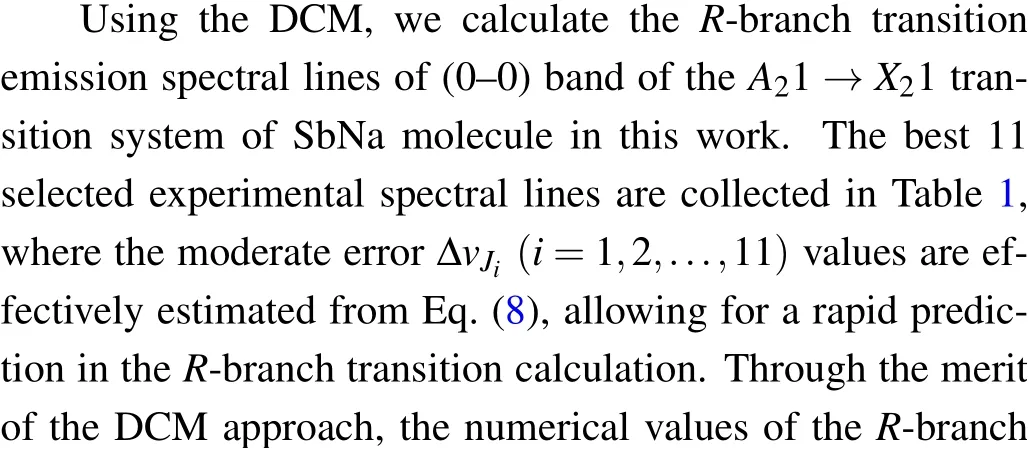

Table 1. Values of rotational quantum number Jk and the error ΔvJk respectively corresponding to 11 selected known experimental transition lines of(0–0)band of A21 →X21 transition of SbNa molecule.
Fig. 1. Experimentally measured (solid line) and theoretically calculated(dashed line)transition lines of R-branch transitional emission spectra of(a)Re (0–0)band and(b)Rf (0–0)band of A21 →X21 transition of SbNa.

Fig. 2. Difference (vJ,Expt-vJ,Cal) between experimental and theoretical results of (a) Re (0–0) band and (b) Rf (0–0) band of A21 →X21 transition of SbNa.
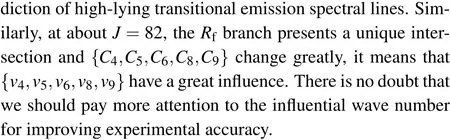
Fig. 3. Experimental and theoretical calculation transition line differences(ΔJ =νJ-1-νJ)of R-branch transitional emission spectral lines of (a) Re(0–0)band and(b)Rf (0–0)band of A20+→X10+ transition of SbNa.

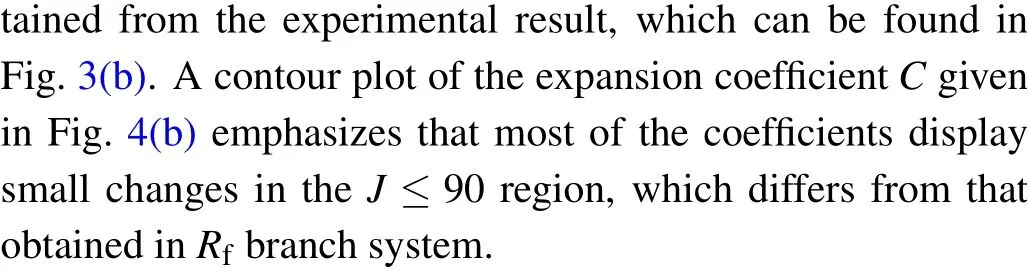
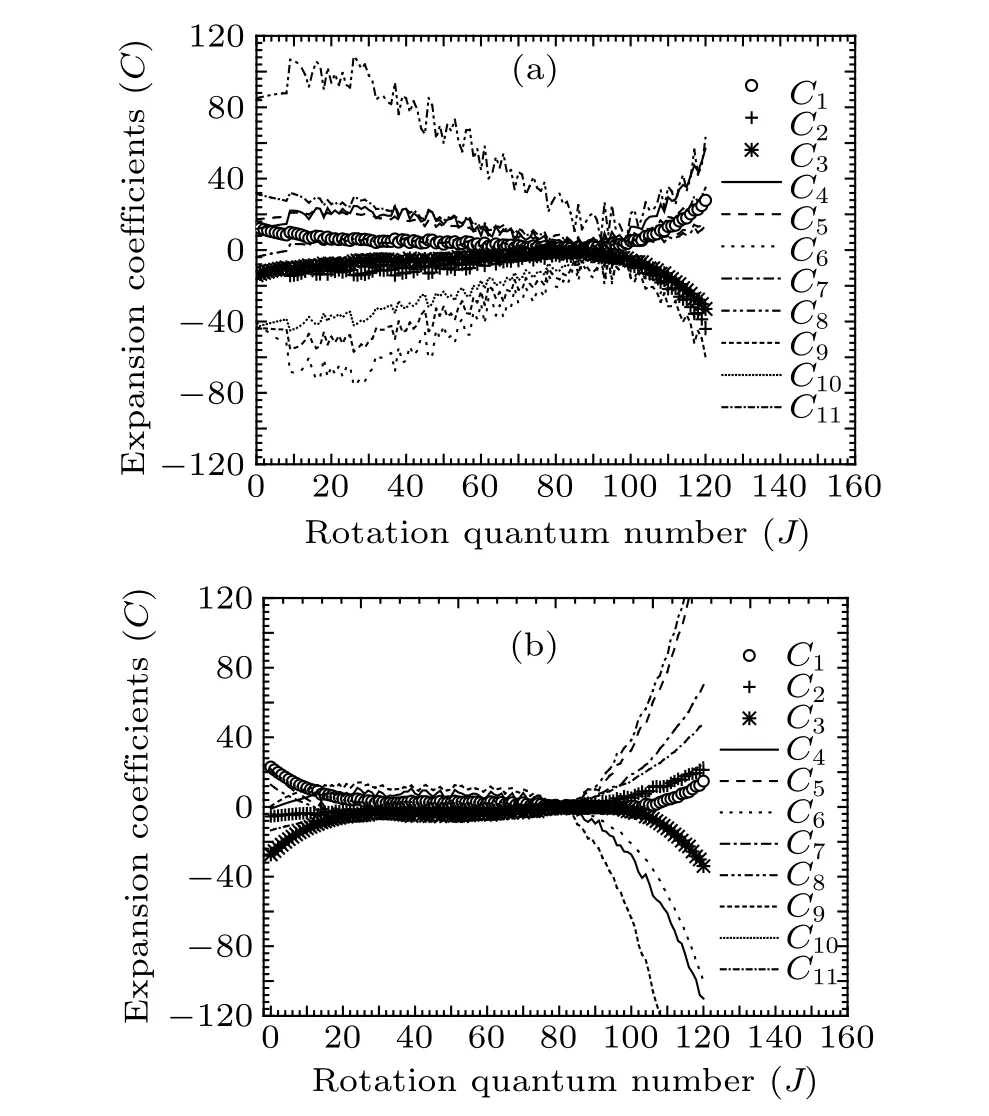
Fig.4.Variations of expansion coefficients Ci with rotational quantum numbers J of(a)Re (0–0)band and (b)Rf (0–0)band of A21 →X21 transition of SbNa.
for Rf-branch, respectively, which are illustrated in Fig. 5.Comparing Fig. 2 with Fig. 5, we can see from Fig. 6 that the values of deviation Δδ estimated by the unknown experimental data from Eq. (8) almost overlap with the differences in vJ,Expt-vJ,DCM,showing the reasonable accuracy of the unknown high-lying transitional emission spectrum. It provides reliable theoretical support for predicting high-lying transitional emission spectral data.
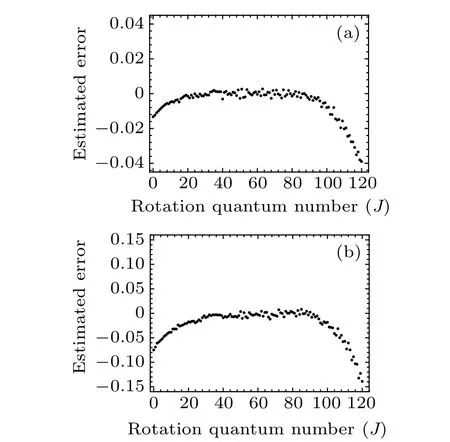
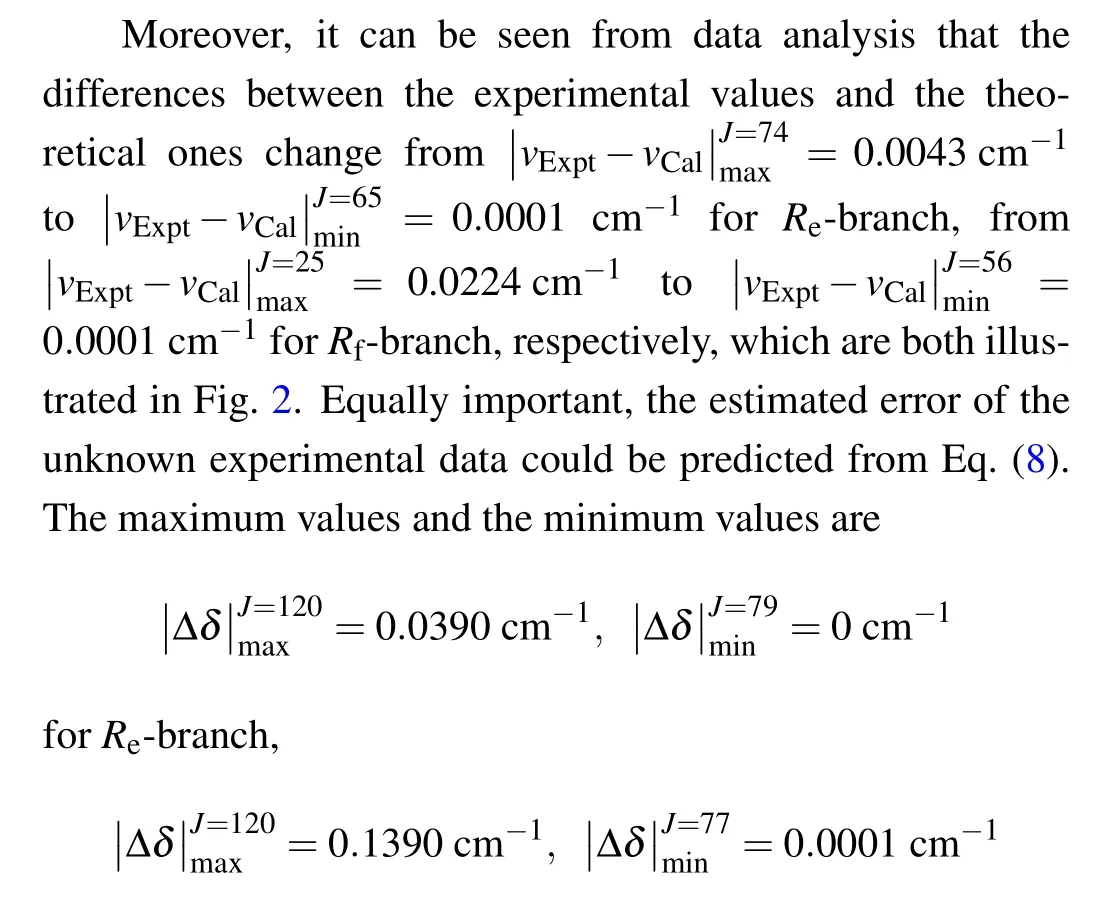
Fig. 5. Estimated error Δδ with rotational quantum numbers J of (a) Re(0–0)band and(b)Rf (0–0)band of A21 →X21 transition of SbNa.
Fig.6. Estimated error Δδ and difference(vJ,Expt-vJ,Cal)transition lines of R-branch transitional emission spectra of(a)Re (0–0)band and(b)Rf (0–0)band of A21 →X21 transition of SbNa.
4. Conclusions
In this work, the DCM method is used to study the Rbranch transition emission spectral lines of(0–0) band of the A21 →X21 transition of SbNa molecule, and only using 11 known experimental transition lines, the high-lying transition spectra up to rotational quantum number J=120 are obtained and analyzed. The calculation results show that the predicted transition lines are consistent with the experimental transition lines. What is more,based on the principle of over determined linear equations,the prediction error Δδ is calculated within an accuracy of 0.01 cm-1. From all the above we understand that the DCM method to predict unknown transition lines is considered reasonably in this work. These high-lying transition emission spectral lines provide the valuable reference data for further understanding the internal structure and properties of SbNa molecule. This method also provides a possible way to investigate and analyze a predicted unknown error in diatomic molecule.
Acknowledgement
We thank the Research Center for Advanced Computation of Xihua University for computing support.
Apprendix A:Supporting information
The DCM R-branch transition lines of the (0,0) band of the A21 →X21 transition of SbNa are listed in Table A1 and Table A2,respectively.
Table A1. Experimental and theoretical R-branch emission spectra and related data of(0,0)band of the A21 →X21 transition of SbNa(All quantities are in unit cm-1).
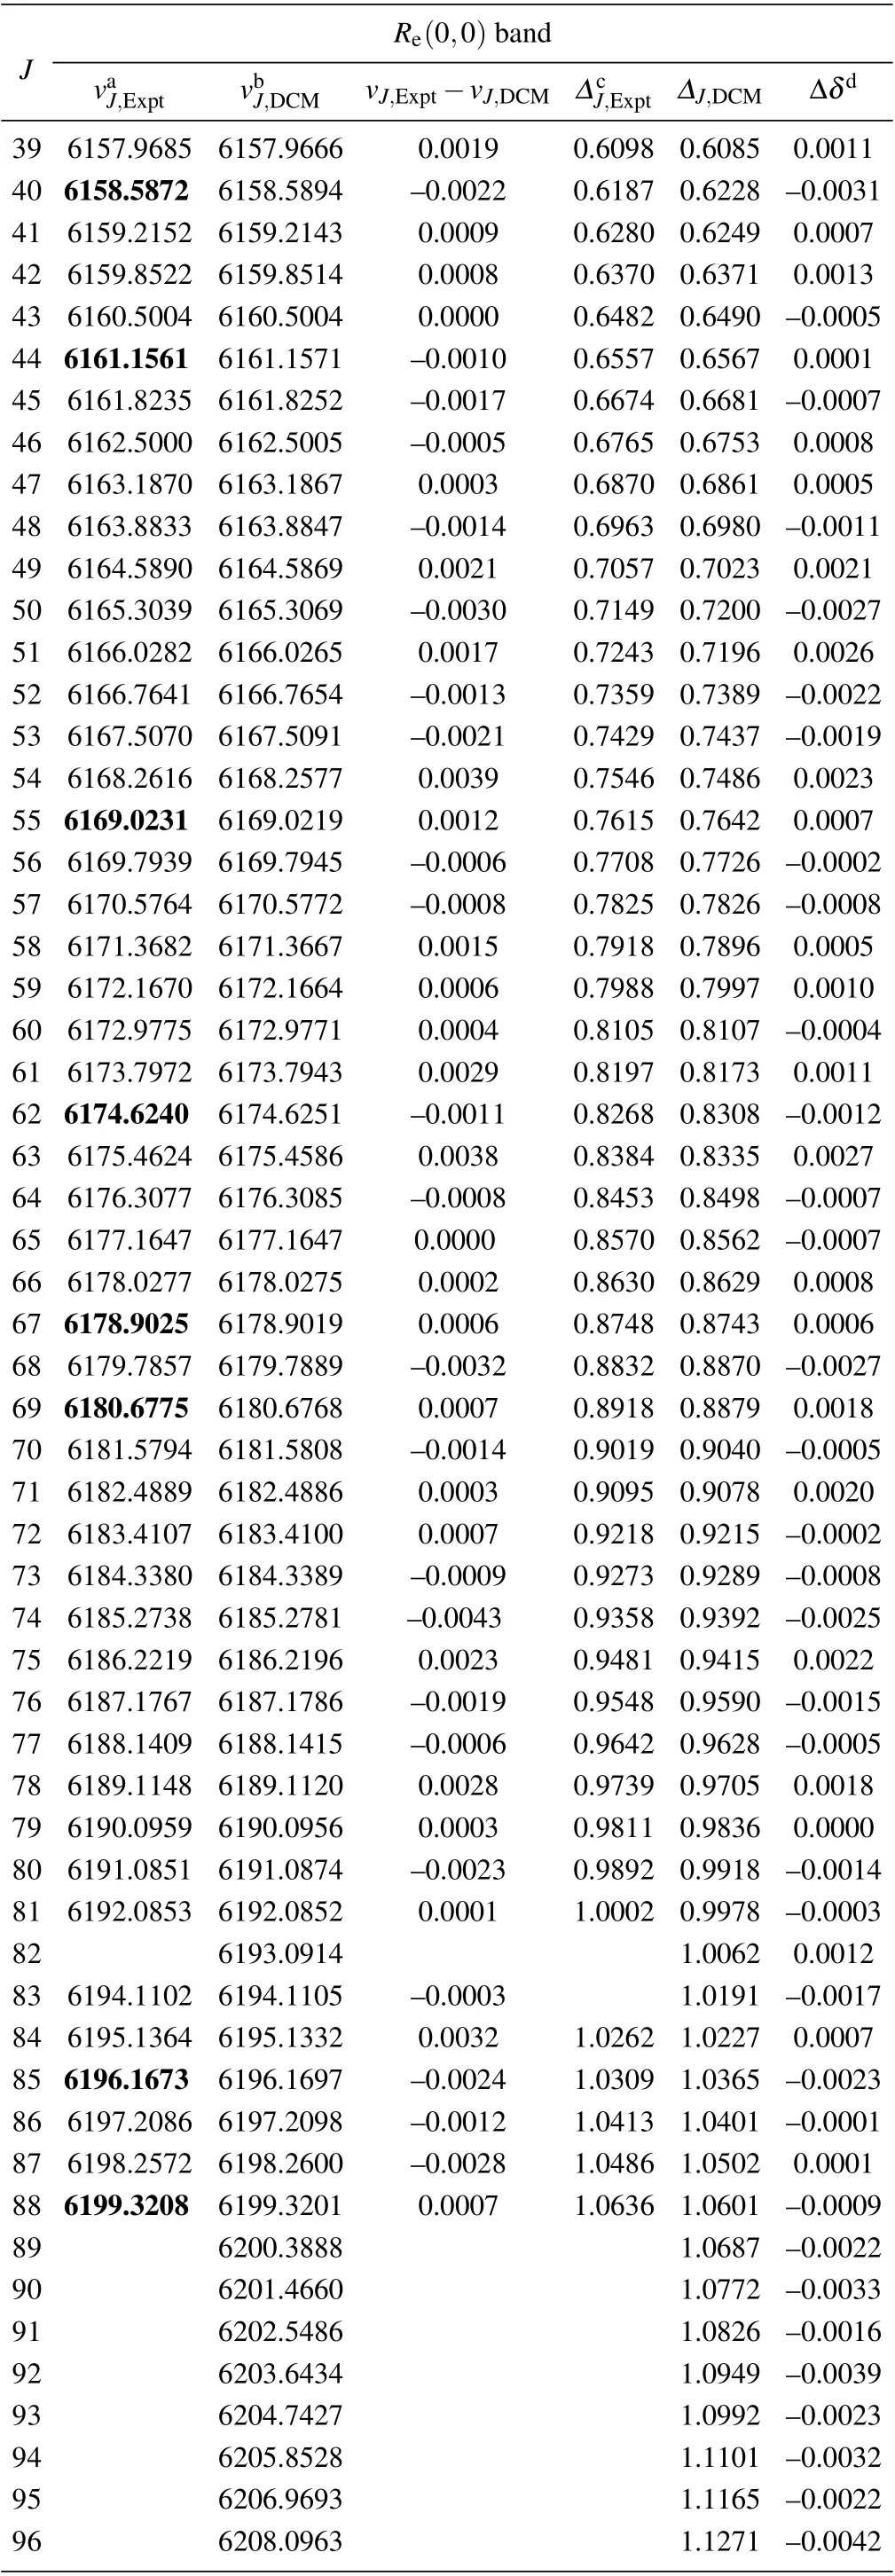
Table A1. (Continued).
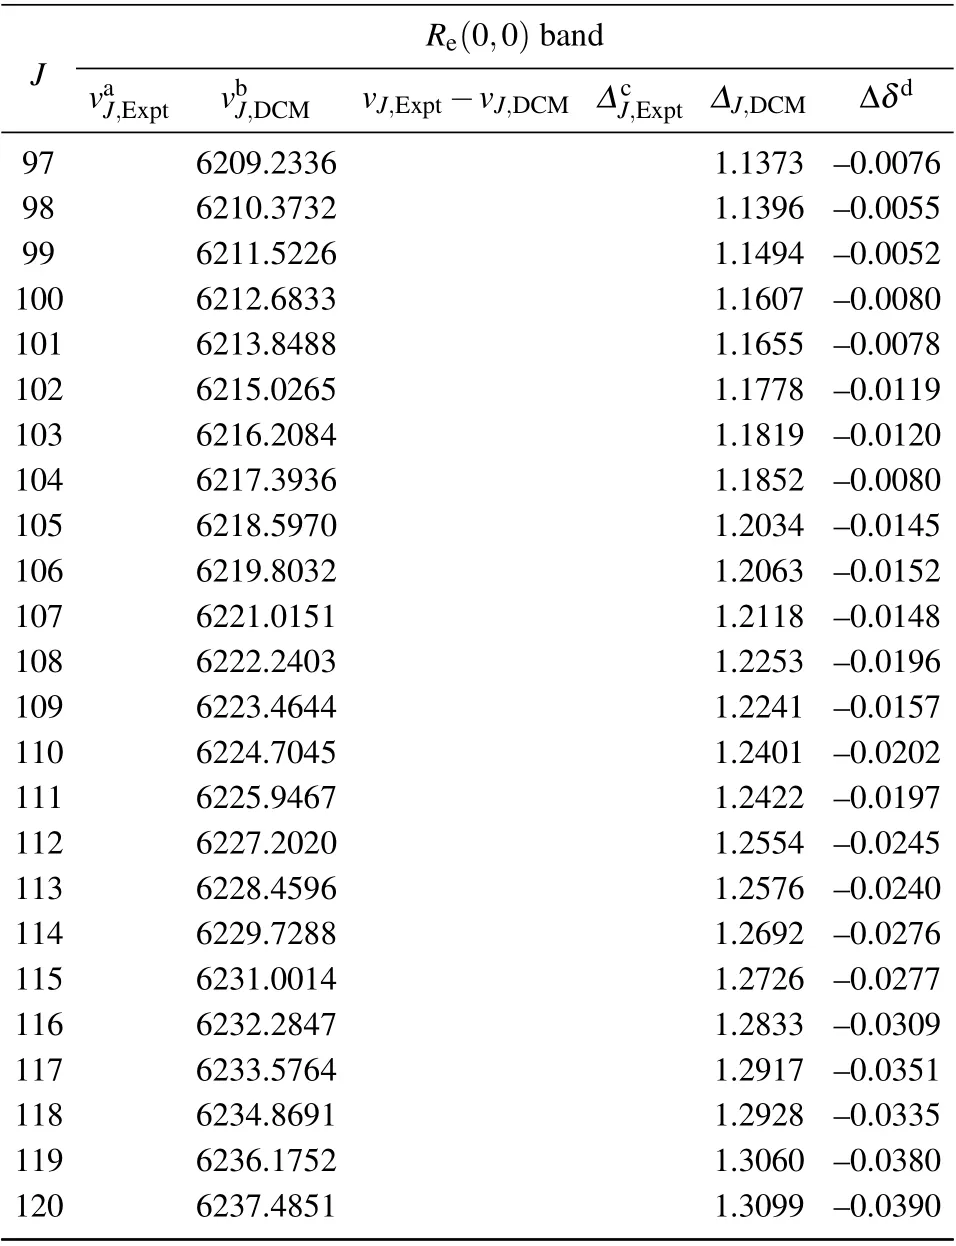
Table A1. (Continued).
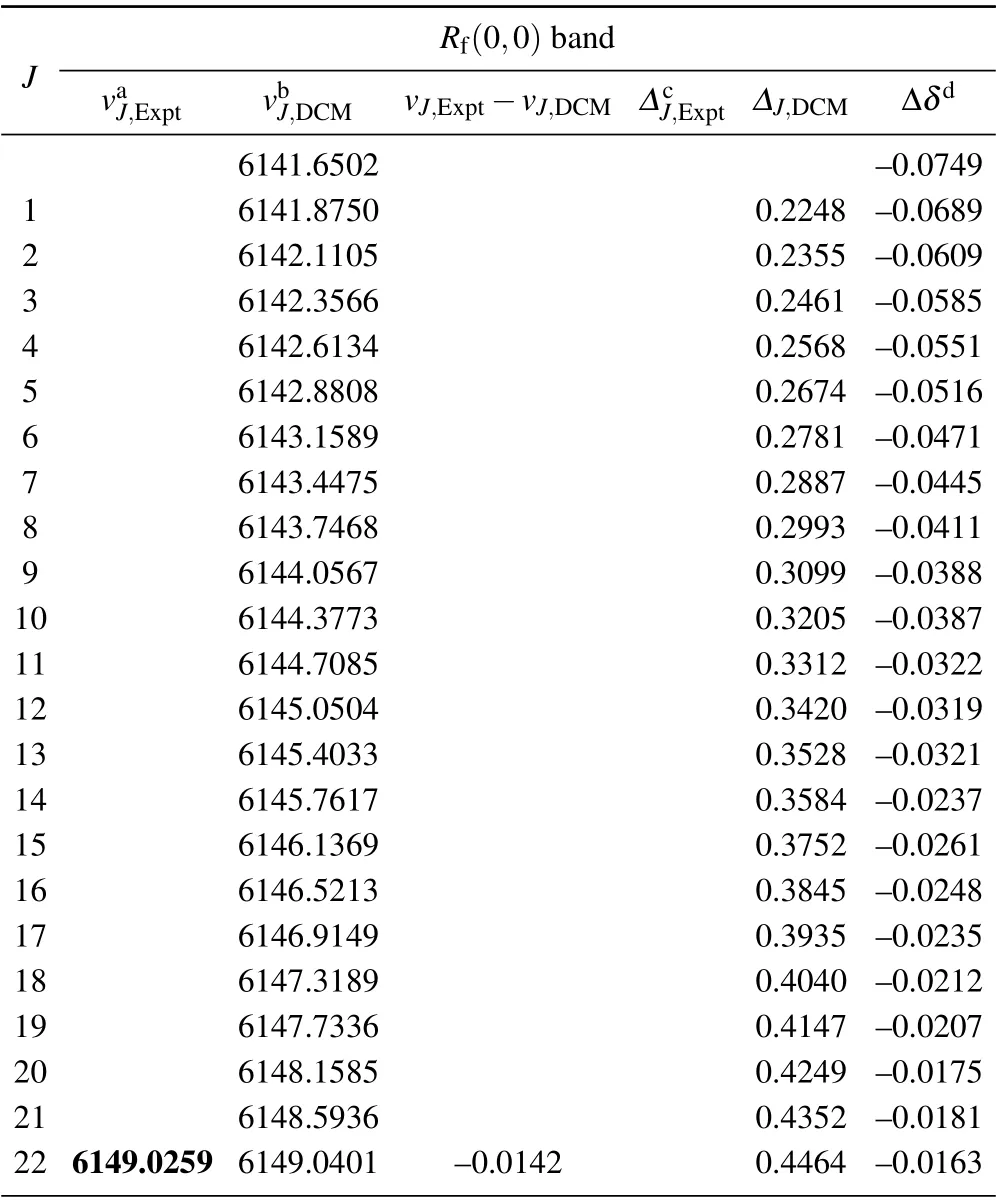
Table A2. Experimental and theoretical R-branch emission spectra and related data of(0,0)band of the A21 →X21 transition of SbNa(All quantities are in unit cm-1).

Table A2. (Continued).
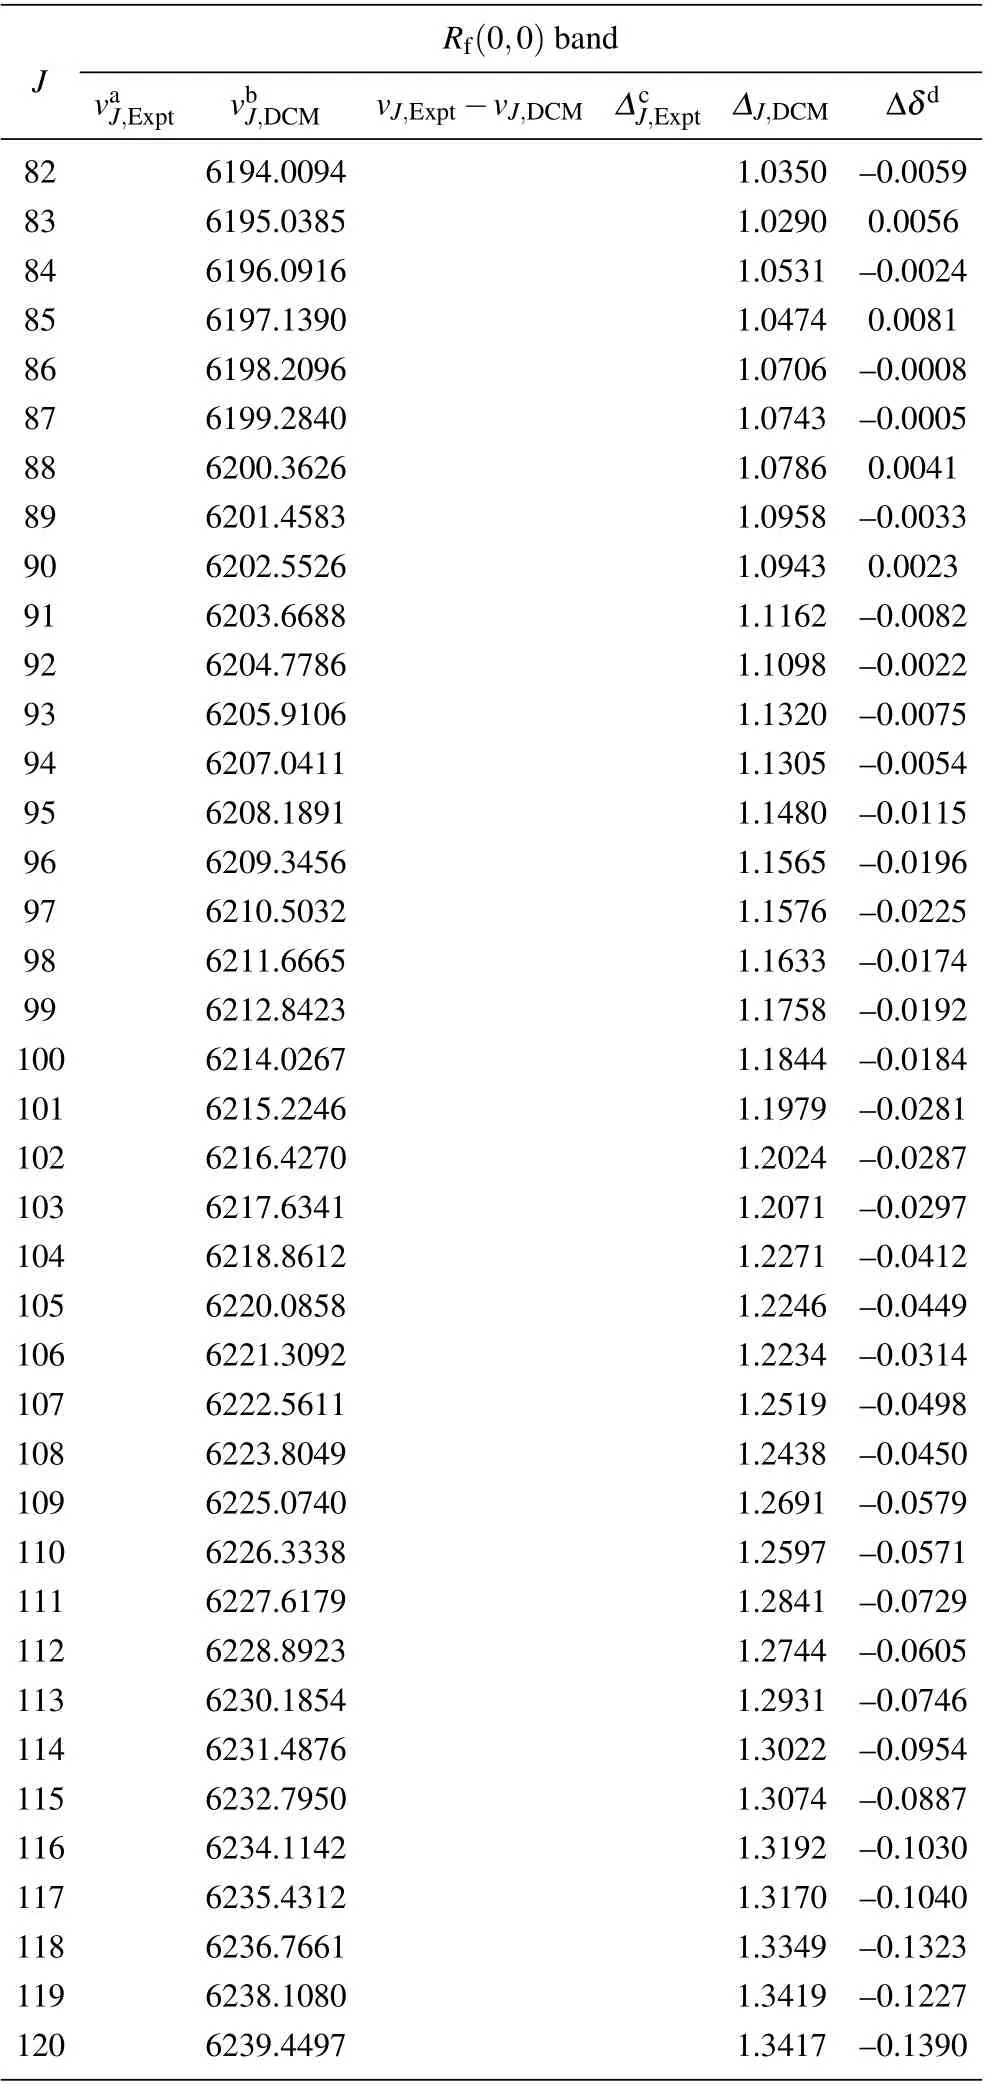
Table A2. (Continued).
猜你喜欢
杂志排行

Chinese Physics B的其它文章
- Numerical simulation on ionic wind in circular channels*
- Interaction properties of solitons for a couple of nonlinear evolution equations
- Enhancement of multiatom non-classical correlations and quantum state transfer in atom–cavity–fiber system*
- Protein–protein docking with interface residue restraints*
- Effect of interaction between loop bases and ions on stability of G-quadruplex DNA*
- Retrieval of multiple scattering contrast from x-ray analyzer-based imaging*