Effects of nitrogen application rate and hill density on rice yield and nitrogen utilization in sodic saline–alkaline paddy fields
2021-01-18GUOXiaohongLANYuchenXULingqiYlNDaweiLlHongyuQlANYongdeZHENGGuipingYandong
GUO Xiao-hong,LAN Yu-chen,XU Ling-qi,YlN Da-wei,Ll Hong-yu,QlAN Yong-de,ZHENG Gui-ping,LÜ Yan-dong
Heilongjiang Provincial Key Laboratory of Modern Agricultural Cultivation and Crop Germplasm Improvement/Daqing Key Laboratory of Saline-alkaline Land Utilization and Improvement/College of Agriculture,Heilongjiang Bayi Agricultural University,Daqing 163319,P.R.China
Abstract Soil salinity and alkalinity can inhibit crop growth and reduce yield,and this has become a global environmental concern.Combined changes in nitrogen (N) application and hill density can improve rice yields in sodic saline–alkaline paddy fields and protect the environment. We investigated the interactive effects of N application rate and hill density on rice yield and N accumulation,translocation and utilization in two field experiments during 2018 and 2019 in sodic saline–alkaline paddy fields. Five N application rates (0 (control),90,120,150,and 180 kg N ha−1 (N0–N4),respectively) and three hill densities(achieved by altering the distance between hills,in rows spaced 30 cm apart:16.5 cm (D1),13.3 cm (D2) and 10 cm (D3))were utilized in a split-plot design with three replicates. Nitrogen application rate and hill density significantly affected grain yield. The mathematical model of quadratic saturated D-optimal design showed that with an N application rate in the range of 0–180 kg N ha−1,the highest yield was obtained at 142.61 kg N ha−1 which matched with a planting density of 33.3×10⁴ ha−1. Higher grain yield was mainly attributed to the increase in panicles m–2. Nitrogen application rate and hill density significantly affected N accumulation in the aboveground parts of rice plants and showed a highly significant positive correlation with grain yield at maturity. From full heading to maturity,the average N loss rate of the aboveground parts of rice plants in N4 was 70.21% higher than that of N3. This is one of the reasons why the yield of N4 treatment is lower than that of the N3 treatment. Nitrogen accumulation rates in the aboveground parts under treatment N3 (150 kg N ha−1) were 81.68 and 106.07% higher in 2018 and 2019,respectively,than those in the control. The N translocation and N translocation contribution rates increased with the increase in the N application rate and hill density,whereas N productivity of dry matter and grain first increased and then decreased with the increase in N application rate and hill density. Agronomic N-use efficiency decreased with an increase in N application rate,whereas hill density did not significantly affect it. Nitrogen productivity of dry matter and grain,and agronomic N-use efficiency,were negatively correlated with grain yield. Thus,rice yield in sodic saline–alkaline paddy fields can be improved by combined changes in the N application rate and hill density to promote aboveground N accumulation. Our study provides novel evidence regarding optimal N application rates and hill densities for sodic saline–alkaline rice paddies.
Keywords:rice yield,saline–alkaline soil,nitrogen accumulation,paddy field,Songnen Plain
1.lntroduction
Soil salinization is a global environmental problem that severely limits crop production on more than 800 million hectares of land (Rengasamy 2010). The Songnen Plain is among the largest areas of land in the world with sodic saline–alkaline soil,affecting an area of 3.42 million hectares. This affected land is distributed mainly in Jilin Province and west of Heilongjiang Province,China (Zhanget al.2016). As a medium salt-sensitive crop,rice is often used to improve saline–alkali land and improve land use efficiency. Planting rice in saline–alkali land can make the salt content in the surface layer of the soil gradually sink,through irrigation,and can improve the soil structure after three years of continuous planting (Xuet al.2011). The root system of rice has the function of secreting organic acids and absorbing salt in the underground environment which can improve soil consolidation,loosen the soil structure,improve the soil water storage capacity,and help avoid secondary salinization (Shiet al.1998; Zaki 2016; Lianget al.2017). Production in practice for many years shows that planting rice is one of the measures to improve and utilize saline–alkaline soil (Tanget al.2016; Jinet al.2018).
Nitrogen (N) application rate and hill density are two critical agronomic parameters in sodic saline–alkaline paddy rice production.However,sodic saline–alkaline soils are inherently low in organic matter (<0.1%) (Singhet al.2016),and the content of total N and available N is less than 1/3 of the N level of meadow black soil at the same latitude(Liet al.2017). The high pH value and large amount of N volatilization in these soils result in N loss,which further aggravates N deficiency. The microbial activities affecting N mineralization have been shown to be limited by salt stress(Liu and Kang 2014). Moreover,a sodic saline–alkaline condition reduces the availability and mobility of phosphorus in soil,which adversely affects the absorption and utilization of phosphorus by crops (Vance 2011). Meanwhile,the level of fertilizer conservation in saline–alkaline soil is relatively low. In Northeast China,where N application rates are high,sparse planting is still widely used to achieve high yields(Suet al.2012). Sparse planting can promote rice plant tillering and improve individual plant productivity (Huanget al.2013). However,in sodic saline–alkaline paddies,the soil salinity and alkali seriously inhibit rice tillering,and the annual transplanting stage is often accompanied by periodic low temperature weather. Under these conditions,sparse planting will lead to a decline in rice yield. Therefore,it is of great significance to study suitable cultivation techniques,such as N fertilizer and planting density,which match the soil and water characteristics and climate of these paddies.
Several studies have demonstrated that a reasonable N application rate can increase rice yield and total nutrient absorption in each growth period,while also increasing the amount of N mobilized from the straw to the grain in the late growth period (Houet al.2015; Richmondet al.2018). Zhuet al.(2016) confirmed that with a reduced N application rate,an increase in planting density can promote N uptake and accumulation. Planting density has also been found to significantly affect the N accumulation (NA) of rice plants(Huanget al.2013). Ciampitti and Vyn (2011) found that a higher planting density increased N absorption by maize plants before silking,but it had no significant effect on N absorption after silking. However,the interaction between N fertilization and planting density differs among many rice varieties (Tianet al.2017). Consequently,the optimal N application rate for different planting densities in sodic saline–alkaline paddies is still unclear.
Optimization the N application rate and planting density is important for improving rice yield. Therefore,research on the appropriate rates of N application under sodic saline–alkaline conditions is important,both in theory and practice.Our current work differs from previous studies in several important respects (Huanget al.2015). We previously found that a total N application rate of 150 or 135 kg N ha−1,and a base fertilizer:topdressing ratio of 4:6,improved the accumulation of N,P and K in rice plants in sodic saline–alkaline soil at full heading and maturity. These optimal N application rates also promoted nutrient transport during the full heading and maturity stages,and increased rice yield and nutrient utilization efficiency (Guoet al.2020a).However,in sodic saline–alkaline paddy fields,planting density affects N absorption,mobilization and utilization,as well as rice yield. Therefore,in addition to the N application rate,planting density is a critical parameter to consider when developing a crop cultivation strategy for low-yield sodic saline–alkaline paddy fields. In the present study,five different N application rates and three hill densities were established to compare their effects on rice yield and NA,N distribution and N transport,and to establish the optimal combination of treatments for rice production in sodic saline–alkaline paddy fields. This provides a theoretical basis for cultivation measures in sodic saline–alkaline paddy fields.
2.Materials and methods
2.1.Experimental site and climate
The field experiments were conducted at a farm in Wangjiaweizi County,Daqing City,Heilongjiang Province,China (46°40´N,125°07´E) in 2018 and 2019. The experimental site is a representative of the largest areas of sodic saline–alkaline soils in the western Songnen Plain. The soil had a soluble salt content of 0.28%; other physicochemical properties of the soil at a depth of 0–20 cm are shown in Table 1. The daily average temperature and precipitation during the rice-growing seasons,from 1 May to 1 October in 2018 and 2019,were measured at a weather station near the experimental site (Fig.1).
2.2.Experimental design and plant materials
Fifteen treatments with different N application rates and hill densities were arranged in a split-plot design with three replicates. N application rates were 0 (control),90,120,150,and 180 kg N ha−1(N0–N4,respectively). Different hill densities were achieved by altering the distance between hills,in rows spaced 30 cm apart:16.5 cm (D1),13.3 cm(D2) and 10 cm (D3). Three-week-old seedlings were transplanted manually,with four seedlings per hill. The total area of N application was 133.3 m2(20.5 m×6.5 m),divided into three sub-plots of 44.4 m2(20.5 m×2.2 m) each.Each N application rate was applied to one N treatment plot,while hill density varied between sub-plots. Experimental plots were separated by polyvinyl chloride panels. In each N treatment,40% of the N fertilizer (as urea) was applied as basal fertilizer before transplanting,whereas top dressing was applied at the tillering,booting and panicle differentiation stages,accounting for 30,10 and 20% of N application,respectively. The total amount of potassium fertilizer (as potassium sulfate) applied was 90 kg K ha−1,60% of which was applied as basal fertilizer before transplanting; the remaining 40% was applied as top dressing at the panicle differentiation stage. As a base fertilizer,phosphorus fertilizer (as triple superphosphate,70 kg P ha−1) was applied once. Other management measures were the same as those used in large-scale rice production.
Kenjing 7,a salt-tolerant rice variety,was selected and cultivated in sodic saline–alkaline soils at Heilongjiang Bayi Agricultural University. This variety has a growth period of approximately 135 days and is one of the most widely grown local cultivars. During the two years,sowing dates were 17 April,2018 and 18 April,2019; transplanting dates were 15 May,2018 and 17 May,2019; and harvesting dates were27 September,2018 and 26 September,2019.

Table 1 Nutrient status of soils at the experiment site in 2018 and 2019
2.3.Sampling and measurements
According to Bao’s (2000) soil agrochemical analysis protocol,the following indicators were determined:soil pH,using an ST-2100 pH meter; alkali-hydrolyzable N,using the alkaline solution diffusion method; available P,using sodium bicarbonate extraction colorimetry; available K,using ammonium acetate flame photometry; and soil organic matter content,using potassium dichromate capacity method.
Yield and yield componentsAt the time of rice ripening,three plots in which the rice plants showed uniform growth were selected from each treatment and replicate. In these plots,we continuously monitored the number of panicles in 10 hills and calculated the average number of panicles. In each plot,four hills were subsequently sampled (12 samples in total) according to the average number of panicles,and the yield components were investigated. The number of panicles per hill was determined and converted to the number of panicles m–2. The filled and unfilled spikelets were separated by submergence in tap water,and then counted and weighed. We also calculated spikelet numbers per panicle,seed-setting rate,and 1 000-grain weight (Guoet al.2020b). The grain yield of rice was assessed by collecting rice plants from a 5-m2area in each plot and determining yield after adjusting the moisture content to 14%.
Nitrogen contentIn each treatment,four consecutive hills with uniform growth were selected at full heading and maturity. The aboveground parts of rice plants were separated into leaves,stem-sheaths and panicles. The separated samples were placed in an oven,deactivated at 120°C for 30 min,and then dried to a constant weight at 80°C. Thereafter,the dried samples were crushed using an LG-50 disintegrator (Ruian Baixin Pharmaceutical Machinery Co.,China) and the resulting material was passed through a 0.25-mm sieve. The Kjeldahl method was used to determine total N content (Lu 1999).
2.4.Formula calculations
NA (kg ha−1)=Dry weight of leaves (stem-sheath or panicles)×N content in leaves (stem-sheath or panicles)(Liuet al.2017)
NT (kg ha−1)=NA in leaves (stem-sheaths) at full heading−NA in leaves (stem-sheaths) at maturity (Liuet al.2017)
NTCR (%)=NT/NA in leaves at maturity×100 (Liuet al.2017)
NAIP (kg ha−1)=NA in panicle at maturity−NA in panicle at full heading (Wang 2018)
GNP (kg kg−1)=Yield/Total NA in aboveground plant parts(Liuet al.2017)
DNP (kg kg−1)=Dry weight in aboveground plant parts at maturity/Total NA in aboveground plant parts (Liuet al.2017)
NHI (%)=NA in panicles at maturity/Total NA in aboveground plant parts×100 (Liuet al.2017)
ANE (kg kg−1)=(Rice yield in N application treatment−Rice yield in N0 control)/N application rate×100 (Liuet al.2017),in above eqs.,NT,nitrogen translocation; NA,nitrogen accumulation; NTCR,nitrogen translocation contribution rate; NAIP,nitrogen accumulation increase in panicle; GNP,grain N productivity; DNP,dry matter N productivity; NHI,nitrogen harvest index; ANE,agronomic N-use efficiency.
2.5.Statistical analysis
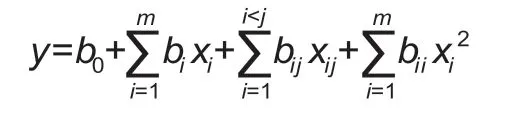
The data were statistically analyzed using DPS 7.05 Statistical Software (Tang 2010). Means were compared using the least significant difference (LSD) test at the 0.05 and 0.01 significance levels. Figures were generated using GraphPad Prism 7 Software. The mathematical model of quadratic saturated D-optimal design according to Wanget al.(2017) was used. The specific mathematical model equation is as follows:
The model analysis is based on the data of 2017.
3.Results
3.1.Effects of N application rate and hill density on yield and yield components
The N application rate and hill density had significant effects (P<0.01) on rice grain yield in both 2018 and 2019(Fig.2). As the N application rate increased,grain yield first increased from N0 to N2,peaked in N3,and was lower in N4,following the trend N3>N4>N2>N1>N0. Relative to the control,N application caused grain yield to increase by 65.26–85.45% in 2018 and by 65.57–89.33% in 2019.Increasing hill density also led to higher grain yield.Regardless of the N application rate,rice yield increased with an increase in hill density,and the highest yields were obtained under treatment D3. Average yields were 4 702.8(N0D3),7 208.4 (N1D3),7 776.5 (N2D3),8 409.2 (N3D3),and 7 735.1 kg ha−1(N4D3) in both years.

Fig.2 The effects of nitrogen (N) application rate and hill density (D) on grain yield of rice in 2018 (A) and 2019 (B). D1,D2 and D3,hill spacing of 16.5,13.3 and 10 cm,in rows 30 cm apart,respectively. Bars mean SD (n=6). **,significance at P≤0.01; NS,not significant at the P=0.05 level.
Nitrogen application rate,hill density and their interaction significantly affected the number of panicles per hill and panicles m–2(Table 2). From the view of individual,the number of panicles per hill increased significantly with increasing N application rate. At the same N application rate,the number of panicles per hill decreased significantly with the increasing hill density. From the view of group,the number of panicles m–2first increased significantly and then decreased with increasing N application rate,whereas it increased continuously with increasing hill density. Relative to the control,N application caused panicles m–2to increase by 51.59–77.84% (2018) and 37.13–47.26% (2019). The maximum panicles m–2was 413.3 in 2018 and 395.9 in 2019.In contrast,an increase in N application rate and reduction in hill density produced more spikelets per panicle. Treatment N4 had the most spikelets per panicle (120.2 and 127.3 in 2018 and 2019,respectively),representing increases of 15.5 and 33.0%,respectively,relaticve to the control. The seed-setting rate showed the opposite trend to the number of panicles m–2:it decreased with increasing N application rate,and increased with increasing hill density. The 1 000-grain weight decreased with increasing N application rate,but did not vary significantly with hill densities. In conclusion,treatment N3D3 had the highest yield; this could be attributed to the higher number of panicles per unit area.
3.2.Optimal combination of the N application rate and hill density
The formula for the mathematical model of grain yield (Y)and agronomic treatments (the N application rate (X1) and hill density (X2)) was established using the mathematical model of quadratic saturated D-optimal design,and the specific equation is as follow:
Y=6.8487+1.5274X1+0.4356X2–0.0978X1X2–1.2228X12–0.0372X22
The correlation coefficient between the actual and estimated rice yield was 0.9932,reaching an extremely significant level (R2=0.9864). It shows that the model has strong reliability,which can accurately reflect the objective reality,and can be analyzed by using the mathematical model. The coefficients ofX1andX2were both positive,and the coefficient ofX1X2was negative,which indicated that the N application rate (t=21.82**) and hill density(t=7.20**) had a significant positive effect on yield,while interaction (t=–1.67) between the N application rate and hill density had negative effect on yield. In other words,grain yield increased with increasing nitrogen and planting density,with gradually decreasing increments.Furthermore,when the N rate and planting density reached a certain level,the grain yield declined. Based on the planning solving tool of the Excel Software,the maximum yield was 7 664.9 kg ha–1when the N application rate was 142.61 kg N ha–1and planting density was 33.3×10⁴plants ha–1.
3.3.Effects of N application rate and hill density on NA at full heading and maturity
Nitrogen application rate,hill density and their interaction had significant effects (P<0.05) on NA in leaves,stemsheaths and panicles at both full heading and maturity in both years (Fig.3). At full heading,the NA of leaves,stem-sheaths and panicles increased with the increasing N application rate and hill density. Leaf NA (averaged across treatments) was higher than that of stem-sheaths and panicles. Relative to the control,increasing N application raised NA by 53.65–153.01% (in leaves),56.38–182.10%(in stem-sheaths) and 62.34–171.00% (in panicles) (means of three planting densities); this increase was the greatest in panicles. Relative to the D1 treatment,NA was progressivelyhigher in D2 and D3,by 23.83–51.21% (in leaves),24.52–55.40% (in stem-sheaths) and 15.12–39.00% (in panicles)(means of the four N application rates); this increase was the greatest in the stem-sheaths. At maturity,the NA of leaves and stem-sheaths both increased with an increase in the N application rate and plant density,in both years. However,in
panicles,NA first increased from N0 to N1,then decreased to N2,peaked in N3,and decreased in N4,following the trend N3>N4>N1>N2>N0. A higher N application rate was,therefore,not always beneficial for panicles NA.
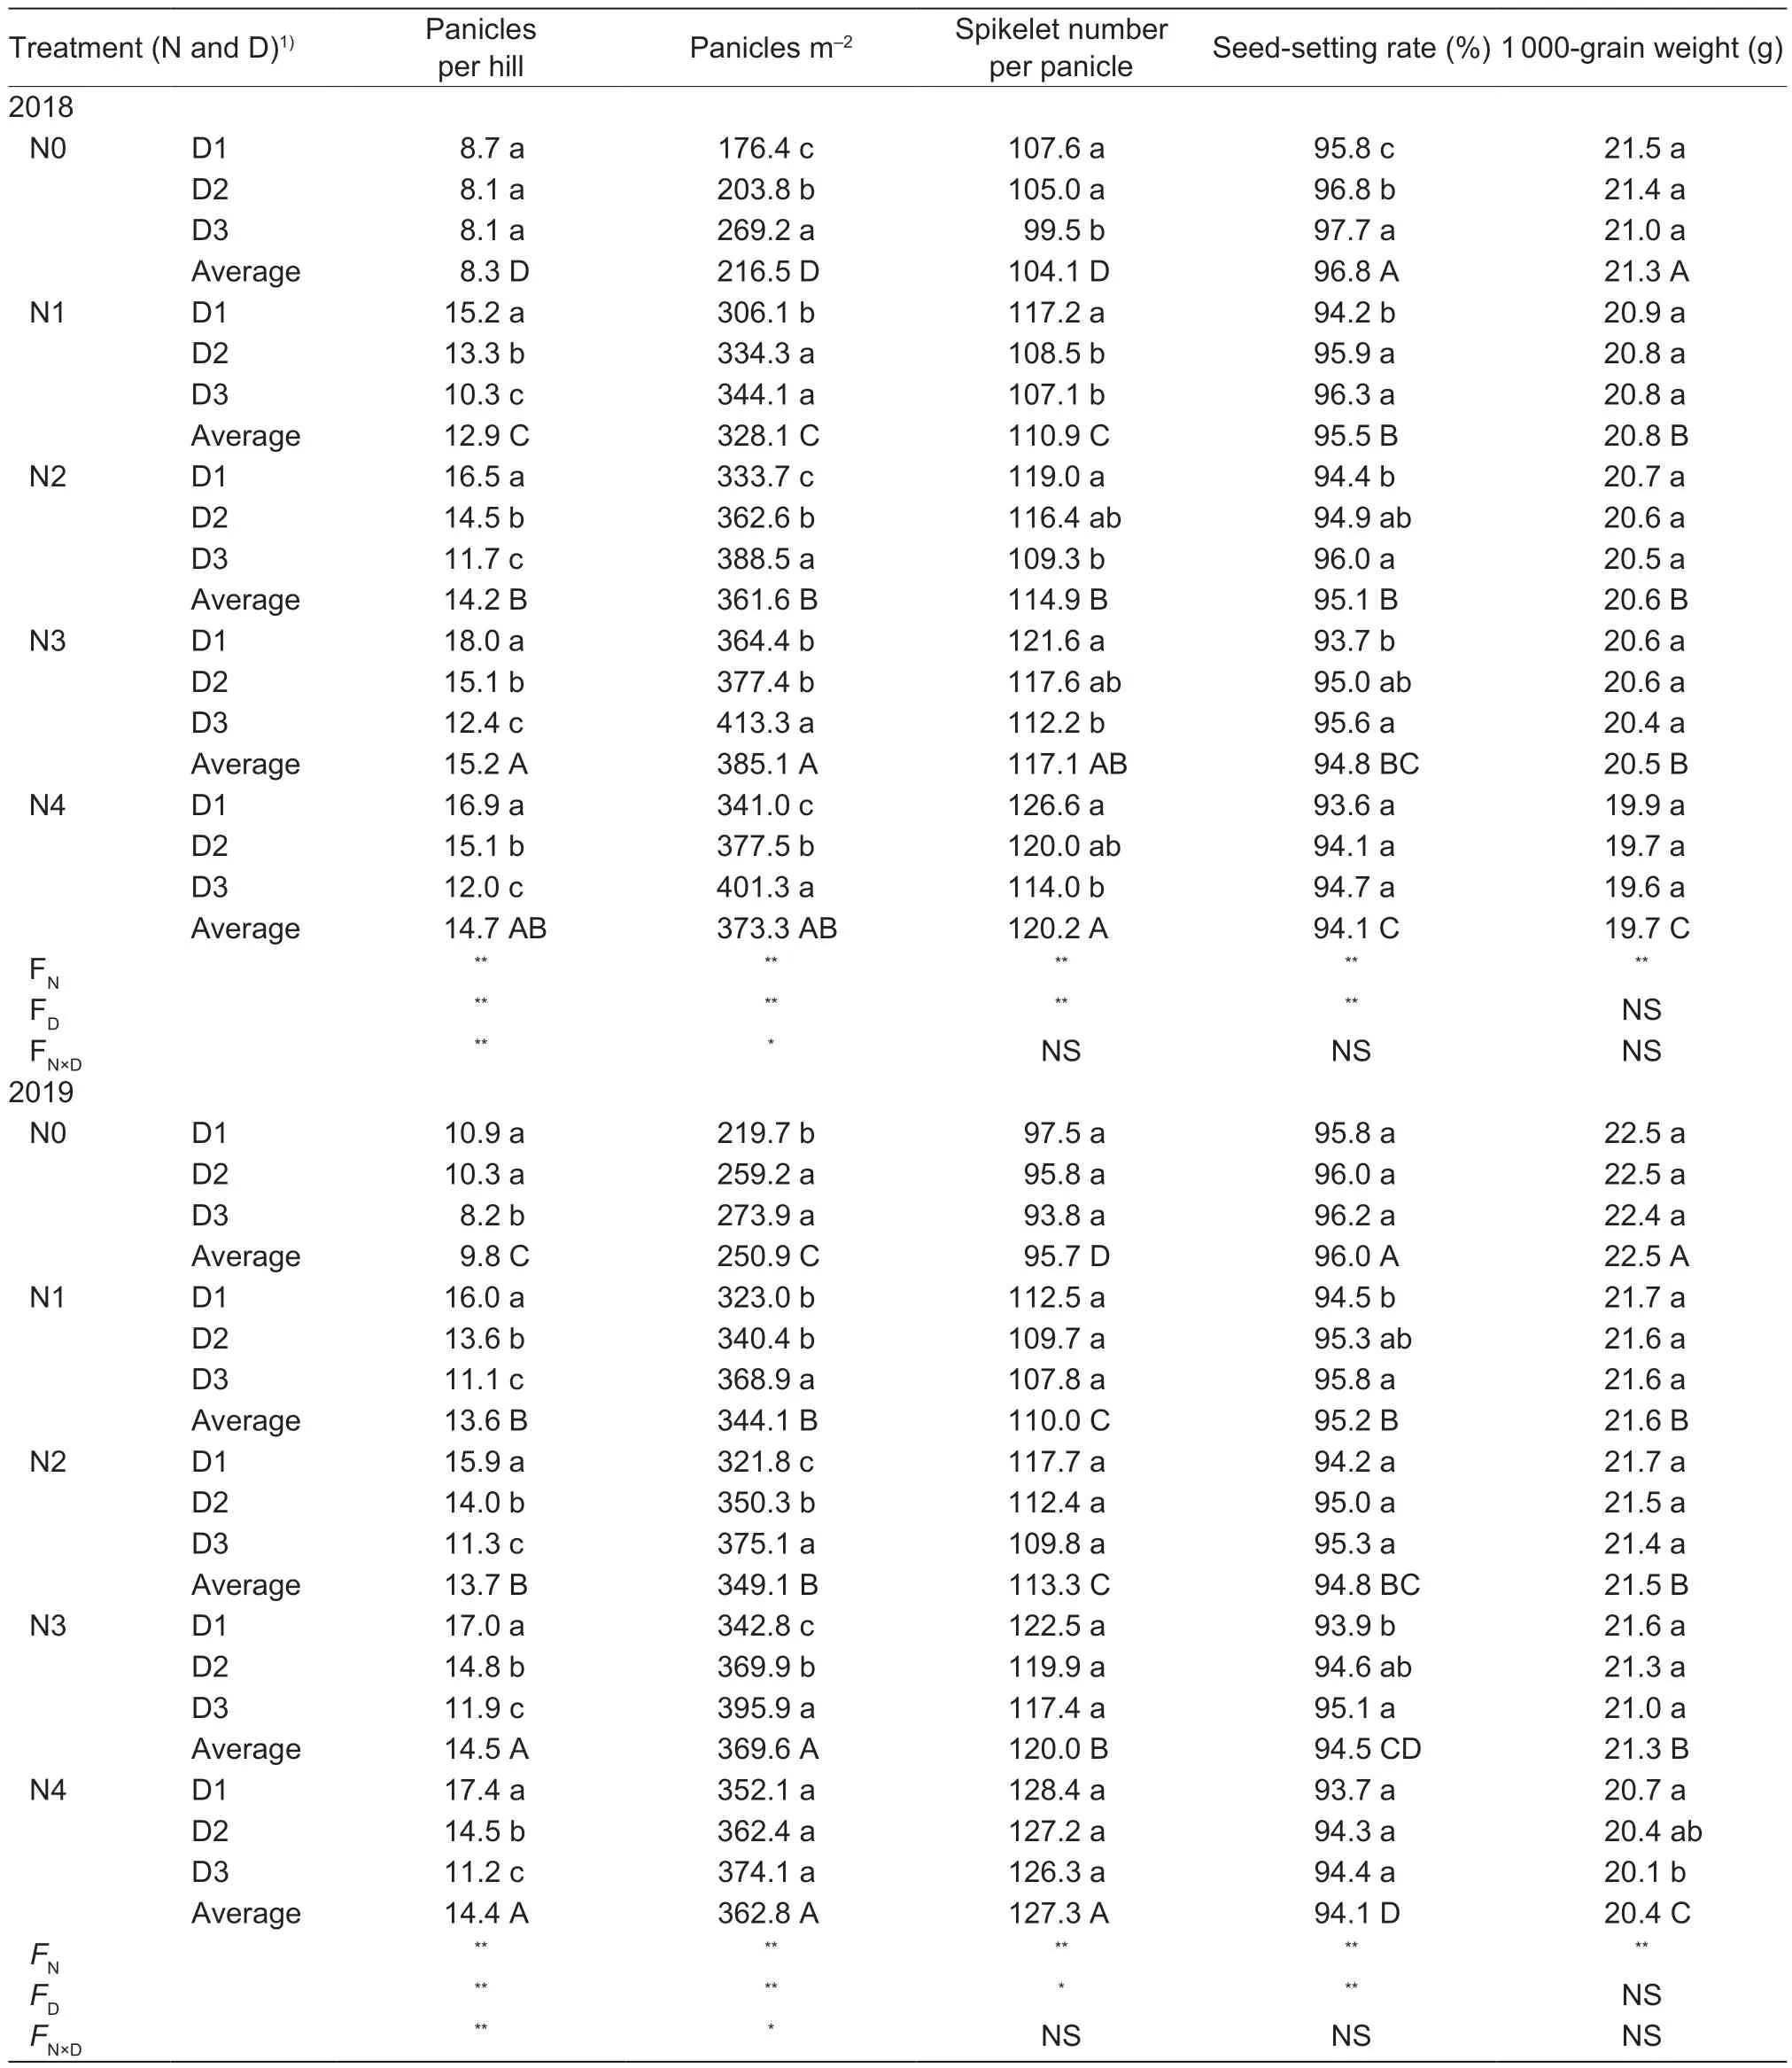
Table 2 Effect of nitrogen (N) application rate and hill density (D) on yield components of rice

Fig.3 Nitrogen accumulation in different parts of rice at a different stages during 2018 (A) and 2019 (B). N0,N1,N2,N3,and N4,0,90,120,150,and 180 kg N ha−1 treatments,respectively. D1,D2 and D3,hill spacing of 16.5,13.3 and 10 cm,in rows 30 cm apart. Error bars indicate standard errors of six replicates. Lowercase and uppercase letters,respectively,indicate significant differences (P=0.05) among different hill densities and N application treatments in the same year.
In contrast to the findings for NA at full heading,NA at maturity was the highest in panicles and the lowest in leaves.Relative to the control,increasing the N application raised NA by 43.51–96.49% (in leaves),35.32–102.37% (in stemsheaths) and 42.56–100.44% (in panicles) (means of three planting densities). Relative to D1,NA was progressively higher in D2 and D3,by 18.43–40.24% (in leaves),20.90–46.22% (in stem-sheaths) and 11.19–27.25% (in panicles)(means of four N application rates). Consistent with findings for the full heading stage,this increase was the greatest in the stem-sheaths. Total NA in aboveground plant parts increased from N0 to N2,peaked in N3,and declined again to N4 (N3>N4>N2>N1>N0); total NA increased with increasing hill density (D3>D2>D1). Total NA of the aboveground plant parts was the highest in N3,at 156.63 kg ha−1in 2018 and 171.74 kg ha−1in 2019,increases of 81.68 and 106.07%,respectively,relative to the control. Relative to N3,total NA of the aboveground plant parts in N4 decreased by 4.6% in 2018 and 4.0% in 2019. From full heading to maturity,the average N loss of N4 was 28.73% and that of N3 was 8.57%,which was higher than that of N3. This is one of the reasons why the yield of N4 treatment is lower than that of N3 treatment. Total NA in the aboveground plant parts was the highest in D3,at 143.30 kg ha−1in 2018 and 157.29 kg ha−1in 2019,increases of 30.25 and 32.85%,respectively,relative to D1. The best combination of N application rate and hill density was N3D3. The increase in total NA in the aboveground plant parts was mainly attributed to higher panicle NA.
3.4.Effects of N application rate and hill density on N translocation
The N application rate,hill density and their interaction had significant effects on leaf N translocation and stem-sheaths N translocation in both years (Table 3). The trends for leaf and stem-sheaths N translocation were consistent with those observed for NA of leaves and stem-sheaths at maturity.Relative to the control,increasing N application raised N translocation by 0.6–1.7 folds (in leaves) and 1.0–3.5 folds (in stem-sheaths). Similarly,the N translocation contribution rate increased with the increasing N application rate,especially from N3 to N4,peaking at 68.40 kg ha−1in 2018 and 64.57 kg ha−1in 2019,reflecting increases of 49.74 and 97.31%,respectively,relative to the control.The nitrogen accumulation increase in panicle (NAIP) also differed significantly with the N application rate and hill density,and their interaction. Relative to the control,NAIP in N3 was higher by 83.81% in 2018 and 57.57% in 2019.Treatment N3D3 produced the highest increases in NAIP,of 87.15 kg ha−1in 2018 and 81.99 kg ha−1in 2019,relative to D1 in the control.
3.5.Effects of N application rate and hill density on N utilization
Nitrogen application rate and hill density significantly affected N utilization (Table 4). Nitrogen productivity was higher for dry matter than that for grain. Dry matter N productivity declined with increasing N application rate and hill density; it ranged from 90.16 to 109.82 kg kg−1in 2018 and 88.24 to 114.23 kg kg−1in 2019,representing decreases of 7.26–13.34% and 7.28–15.58%,respectively,relative to the control. Unlike dry matter N productivity,grain N productivity (the means of the three planting densities)increased with the increasing N application rate,but then decreased at N application rates above 150 kg N ha−1.However,grain N productivity (the means of the four N application rates) decreased with increasing hill density in both 2018 and 2019.
The nitrogen harvest (the mean of the four N application rates) index varied with N treatment; under N application,it peaked in N3 (although it was higher in the control in 2018).This can be attributed mainly to higher panicle NA in the N3 treatment. The N harvest index decreased with increasing hill density. Nitrogen-use efficiency was represented by the agronomic N-use efficiency. The nitrogen application rate significantly affected agronomic N-use efficiency,whereas hill density,and their interaction,did not. Agronomic N-use efficiency decreased with the increasing N application rate,and was the highest under N1,at 29.38 kg kg−1in 2018 and 31.32 kg kg−1in 2019.
3.6.Correlations between traits
Linear correlations between rice yield and NA in the aboveground parts of rice plants,dry matter N productivity,grain N productivity,and agronomic N-use efficiency are shown in Fig.4. N accumulation in the aboveground parts showed significant positive correlation with the actual yield of rice at maturity in both 2018 (R2=0.7463) and 2019(R2=0.7945). This indicates that increasing N application rate and hill density enhanced NA in the aboveground parts,thereby increasing rice yield. The N productivity of dry matter and grain showed significantly negative correlations with rice yield.
4.Discussion
4.1.Yield and yield component
Insufficient nutrient supply in saline–alkaline paddy fields generally results in a lower rice grain yield. In addition to breeding salt-tolerant rice cultivars,N management,planting density and groundwater irrigation are critical strategies that can mitigate the negative effects of salinity(Damet al.2019). Nitrogen application rate,planting density and their interaction significantly affected rice grain yield in saline–alkaline paddy fields (Yanet al.2018). In the present study,rice yield increased with increasing hill density at N application rates from 0 to 150 kg N ha−1.However,beyond 150 kg N ha−1,grain yield decreased significantly. Yield peaked at 150 kg N ha−1and the highest hill density (10 cm between hills; rows 30 cm apart). It is worth mentioning that N application rate and hill density have significant compensatory effects on the number of panicles m–2. At a higher N application rate,the number of panicles per hill could be increased by increasing the distance between the hills. For example,the numbers of panicles m–2were 362.6 (N2D2) and 364.4 (N3D3) in 2018 and 369.9 (N3D2) and 374.1 (N4D3) in 2019. However,the increase in yield was due to the significant increase in the number of panicles m–2,which is mainly determined by hill density. Balochet al.(2002) and Houet al.(2019)reported that increased yield under high plant density was attributed to an increase in the number of panicles m–2,whereas intraspecific competition reduced the number of panicles per hill. In addition,Zhouet al.(2019) confirmed that N application causes rice yield to increase,but only to a point; excessive N application can lead to excessive growth,late maturity and low grain yield. In addition,salinity has been shown to have a significant influence on grain yield,panicle number and spikelet number per panicle,at different planting densities (Zeng and Shannon 2000). Increasing the number of effective panicles m–2is vital for increasing grain yield in sodic saline–alkaline paddy soils (Yanet al.2018). Saline–alkaline paddy field conditions and periodic low temperatures after seedling transplanting,can severelyinhibit tillering,resulting in a shortage of effective panicles per unit area; increasing planting density can compensate for this (Zhanget al.2016). Moreover,there are interactions among the yield components,which ultimately determine the total yield. Chenet al.(2014) reported that increasing N application and planting density could increase tiller number,reduce the number of invalid tillers,optimize the population structure,and achieve the number of panicles required.Previous studies have shown that saline–alkaline stress can reduce the yield components of rice; further,the seedsetting rate and 1 000-grain weight are difficult to regulate as they vary with rice variety,climatic conditions and other factors (Huanget al.2016). Therefore,it is important to increase the number of panicles per unit area and spikelets per panicle in sodic saline–alkaline paddy fields. We found that the number of spikelets per panicle increased with increasing N application rate and decreased with increasing hill density. Similar patterns occurred for seed-setting rate and 1 000-grain weight,with both decreasing in response to increasing N application rates from 0 to 180 kg N ha−1.Our findings show that the number of panicles per unit area can be increased by increasing the N application rate and hill density.
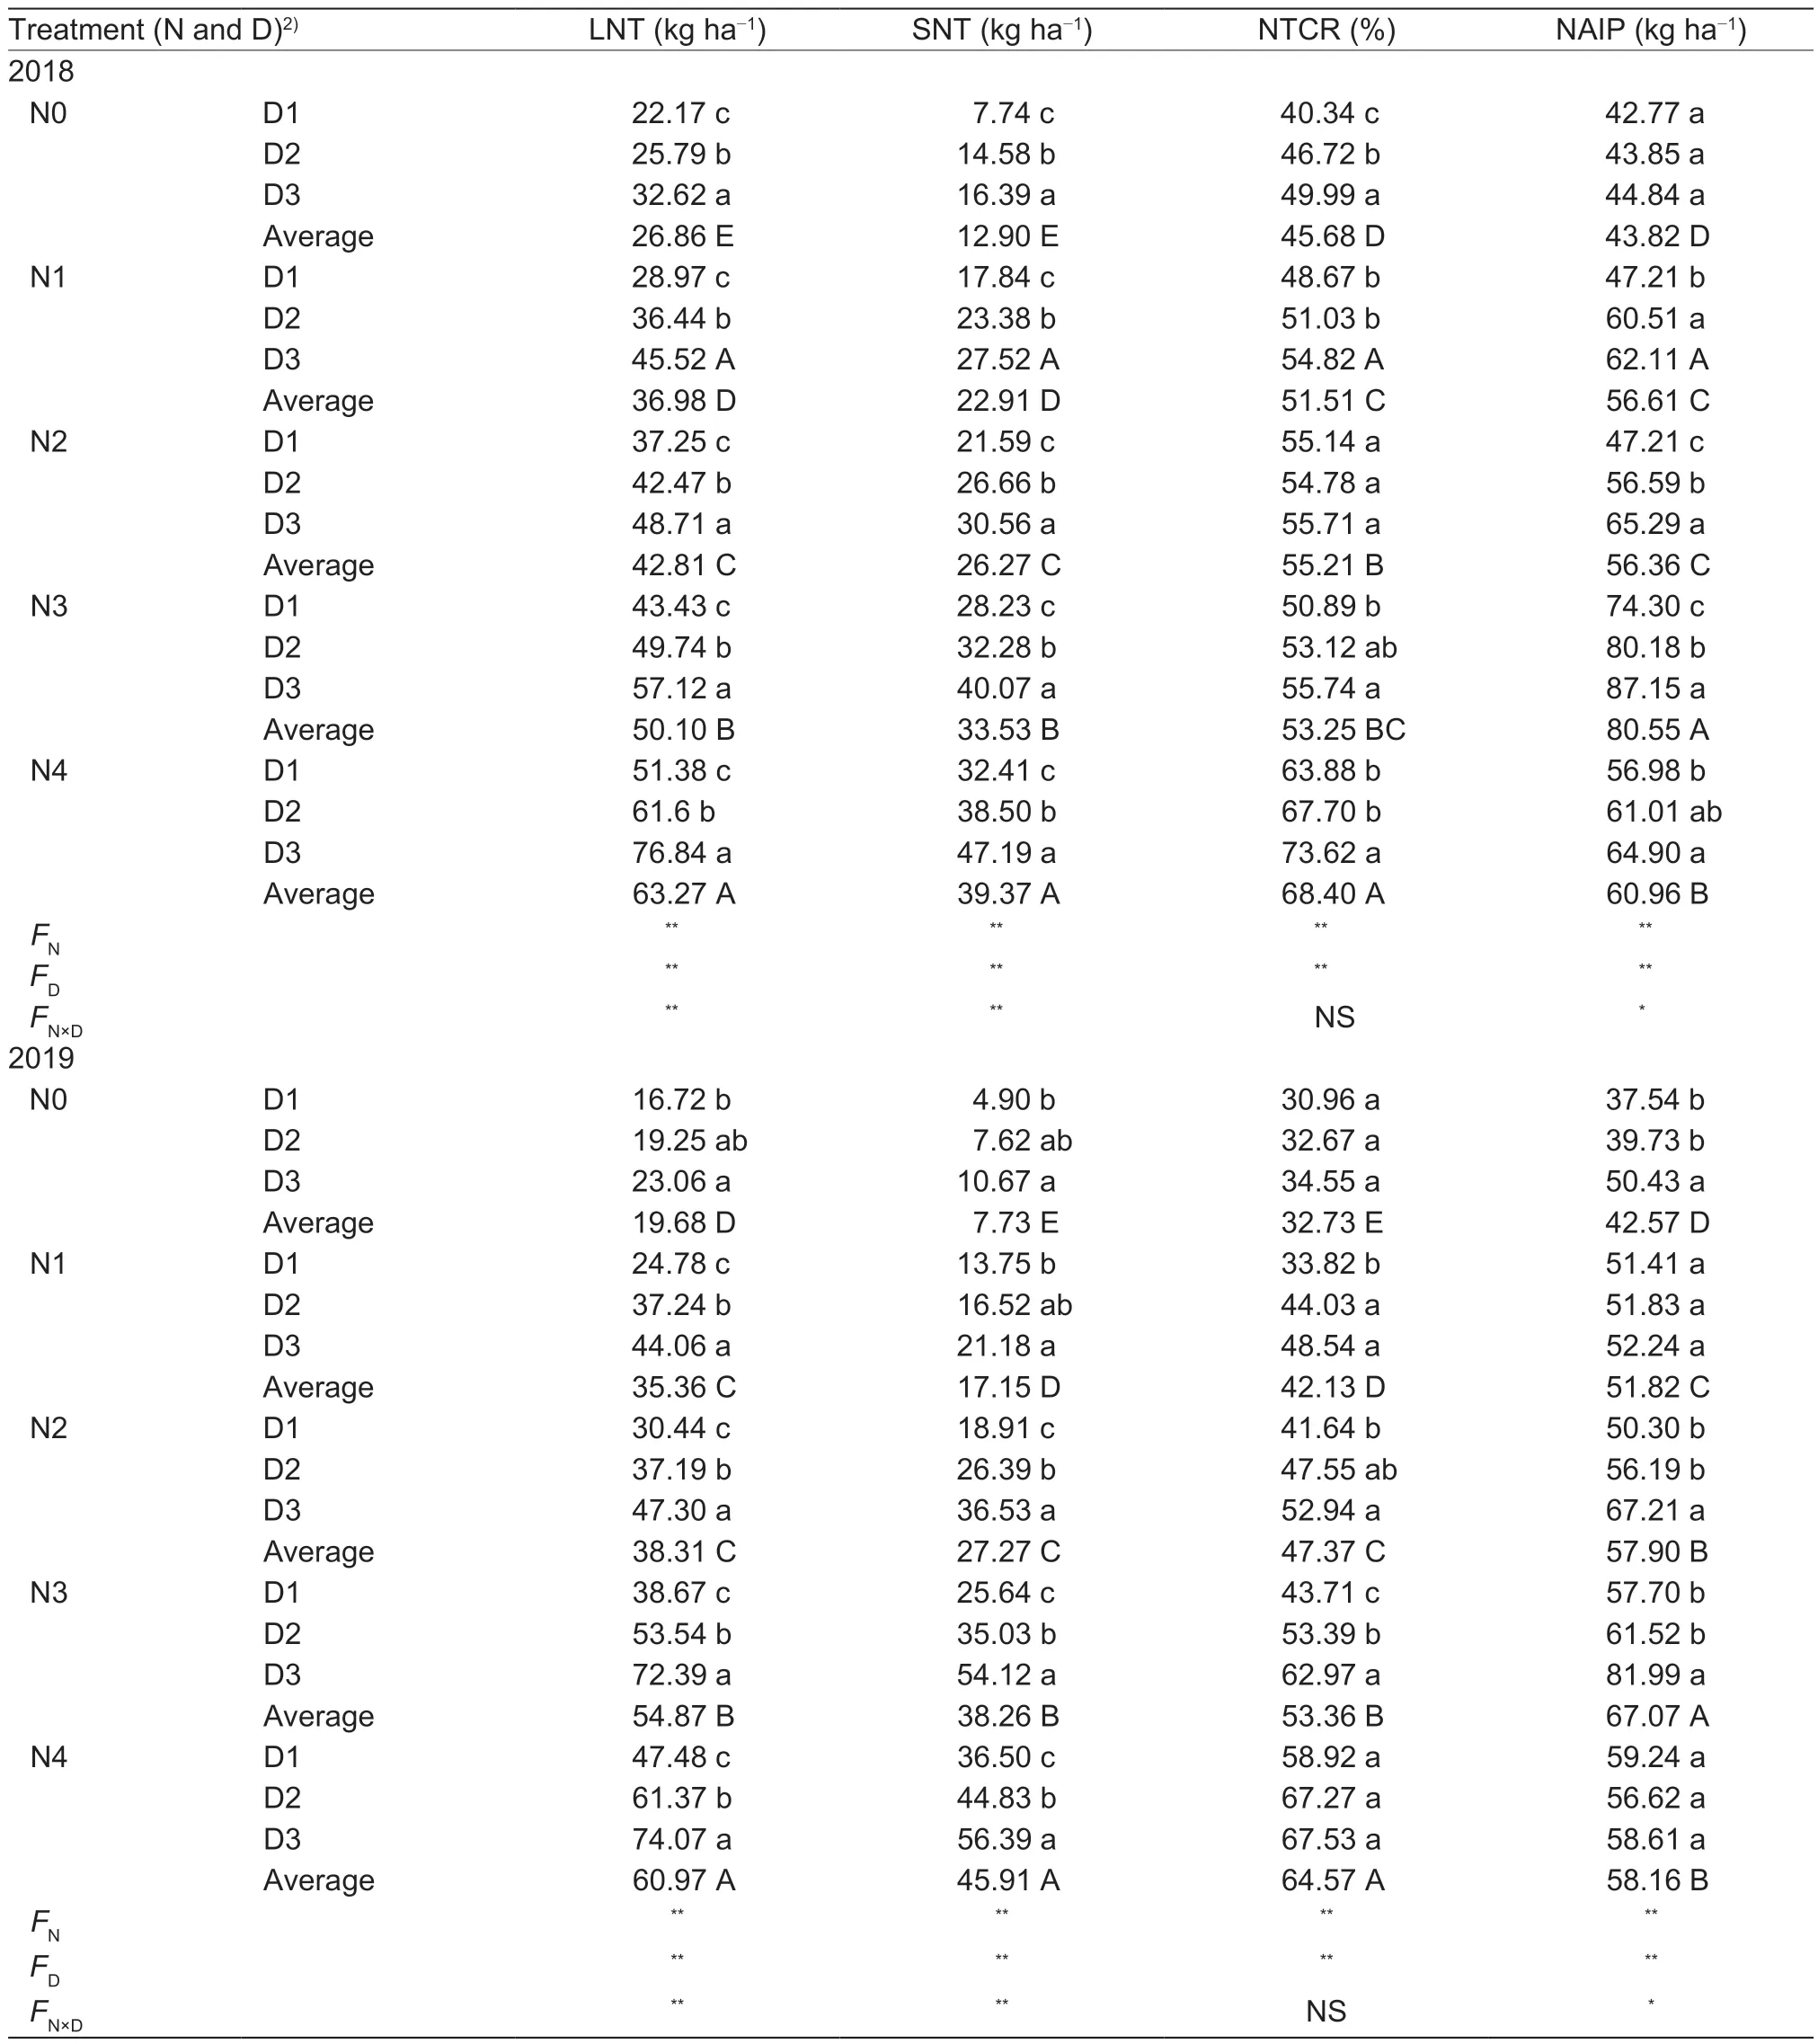
Table 3 Effects of nitrogen (N) application rate and hill density (D) on N transport1)
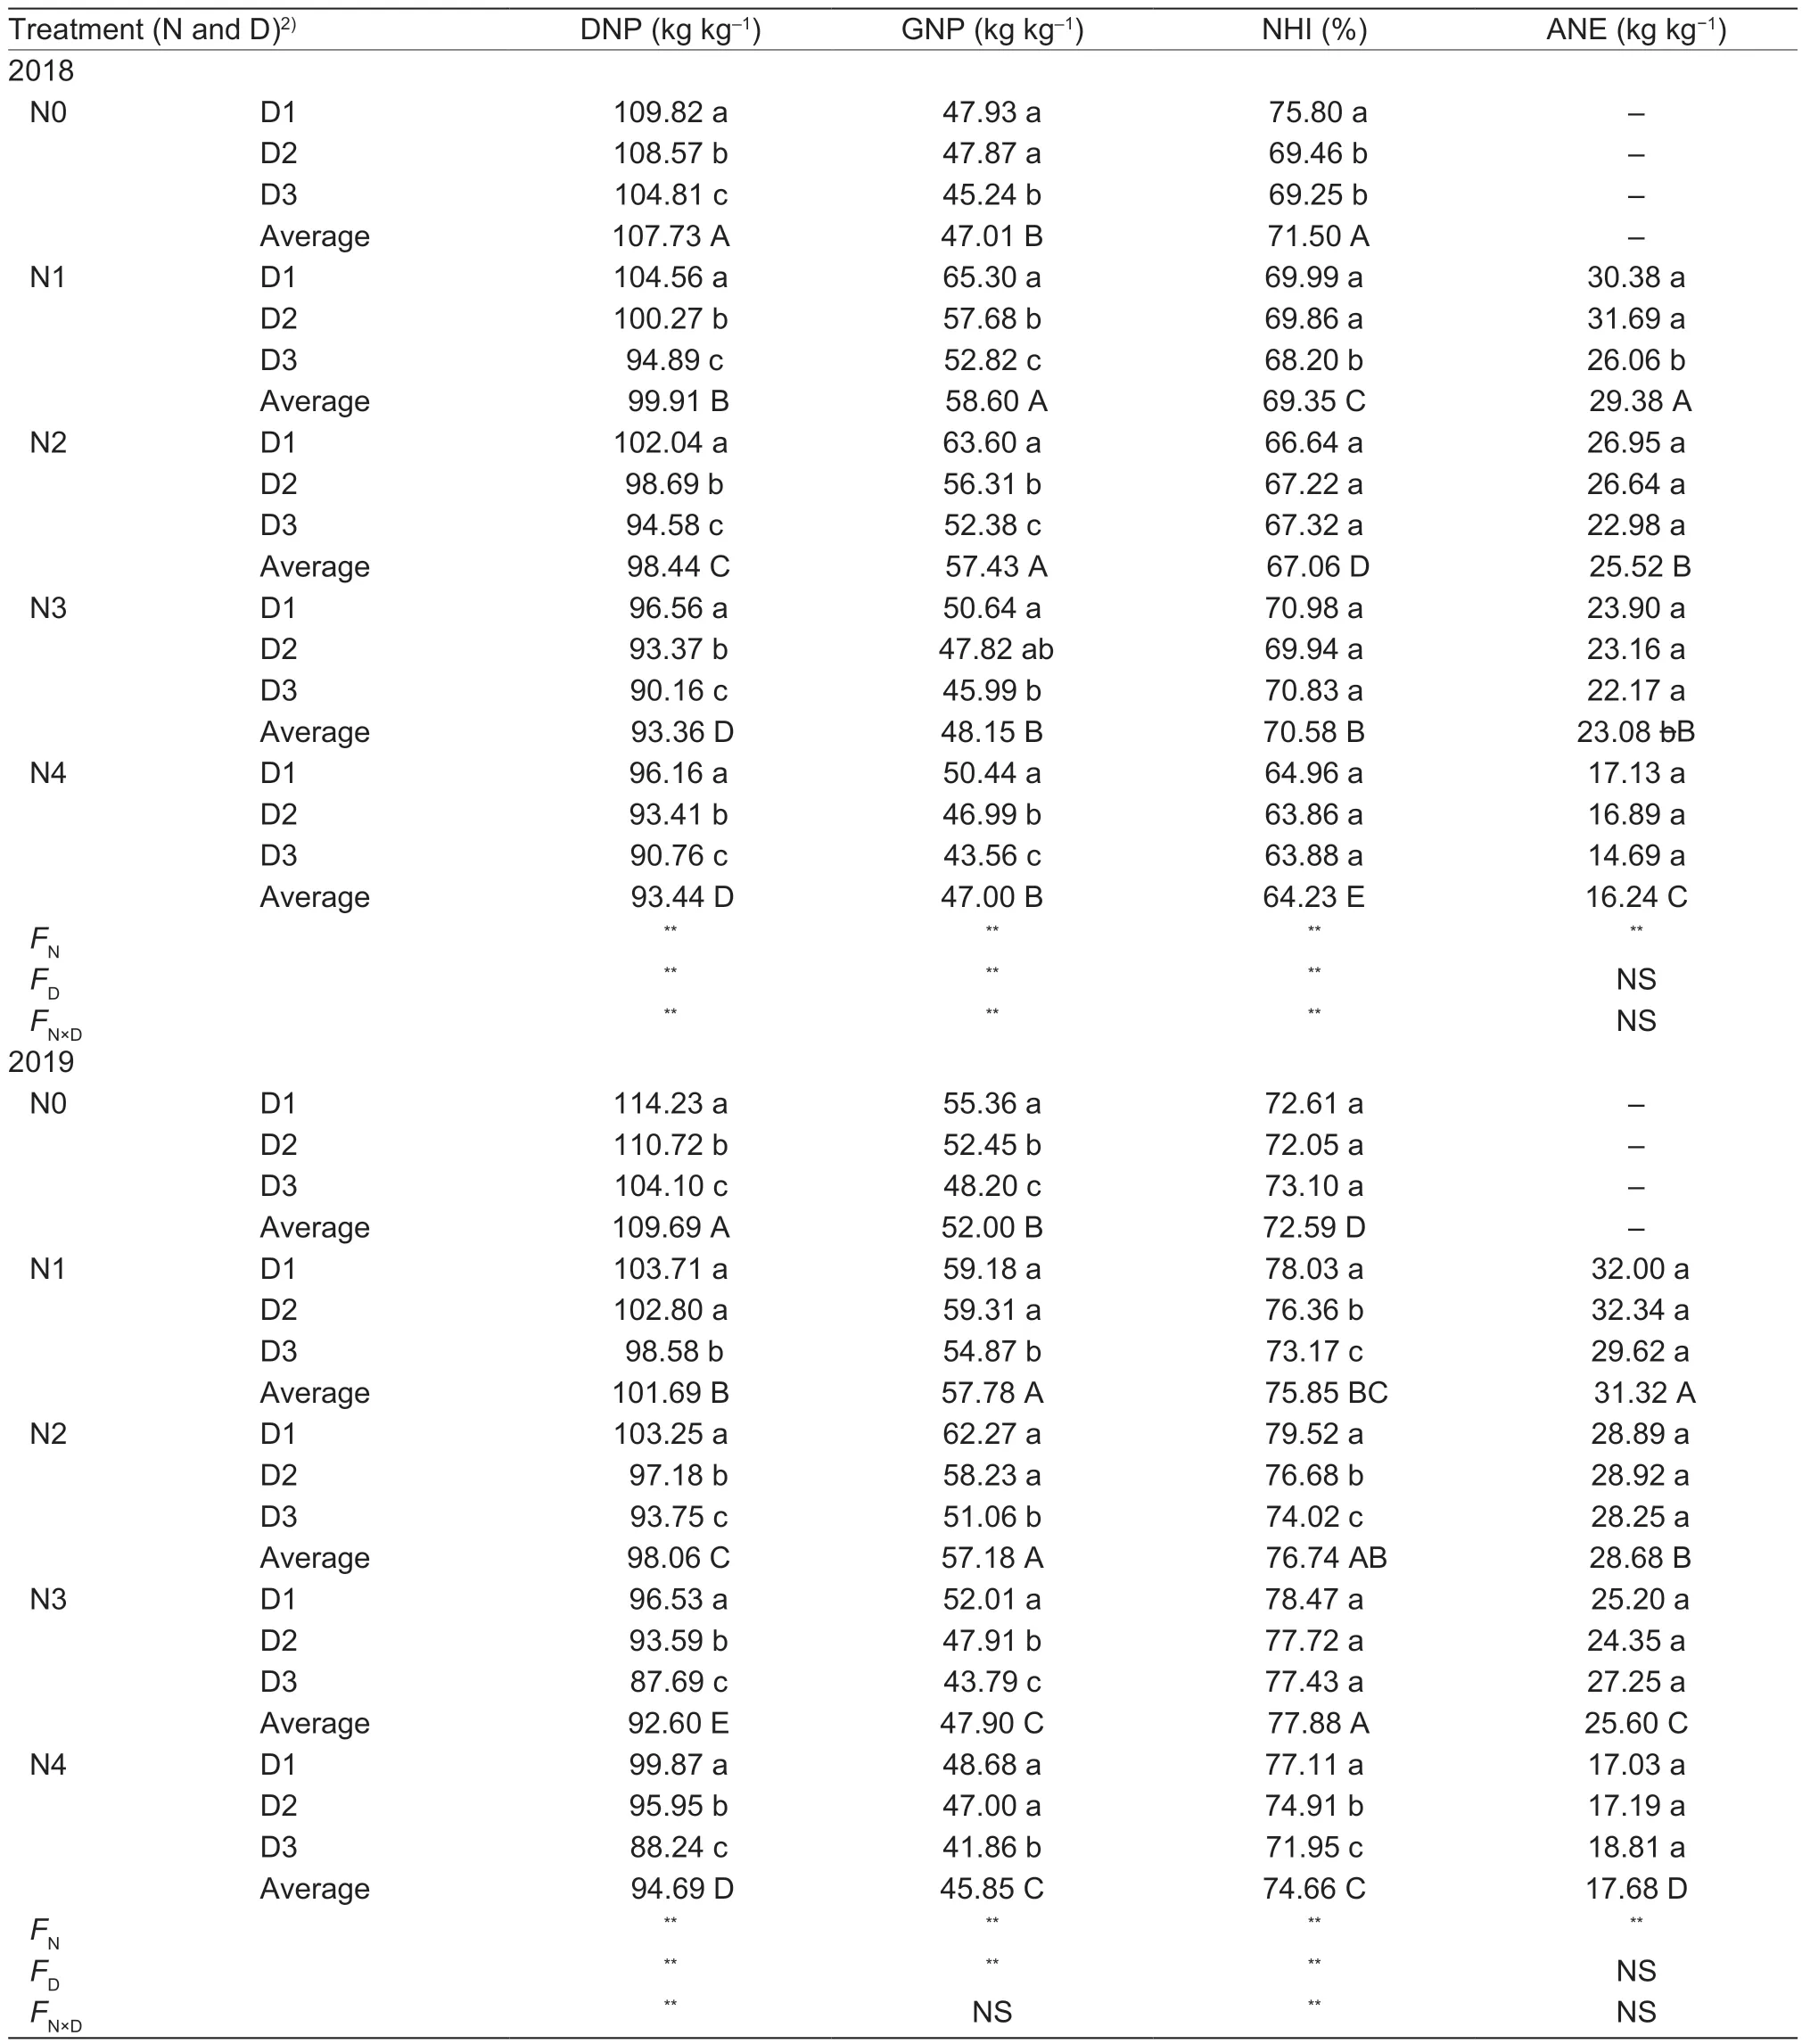
Table 4 Effects of nitrogen (N) application rate and hill density on N utilization1)
4.2.The interaction of N application rate and hill density increased total NA
At maturity,total NA increased with increasing N application rate and hill density,consistent with previous findings (Chenet al.2004; Houet al.2019). From full heading to maturity,NA decreased gradually in leaves and stem-sheaths,and increased accordingly in panicles. This indicates that leaf and stem-sheath NA gradually translocated to the panicle,consistent with the findings of Jianget al.(2004),who also found that NA occurred in the leaves before full heading,but in the panicles at maturity. Rice NA gradually increases at N application rates from 0 to 210 kg N ha−1,but not beyond that(Junet al.2014). Nitrogen accumulation has been reported to decrease with reduced planting density (Chenet al.2019).However,in this study,NA in all plant organs increased with increasing hill density at both full heading and maturity.The N application rate at peak NA was not consistent with the results of Houet al.(2019),which may be due to that fact under the density conditions of this experiment,even the highest density did not result in strong intraspecific competition,which can lead to significant negative effects on rice growth. Moreover,from full heading to maturity,the average N loss rate of the aboveground parts of rice plants in N4 (180 kg N ha–1) was higher than that of N3 (150 kg N ha–1). Sodic saline–alkaline soils are more prone to N losses due to higher N volatilization caused by high pH,further aggravating N deficiency (Singhet al.2016),but are more responsive to N application. Therefore,when the N application rate reaches a certain level (180 kg N ha–1),N fertilizer becomes the main factor limiting the yield,which is one of the reasons why the yield of N4 is lower than that of N3.
4.3.Nitrogen translocation and utilization under the interaction of N application rate and hill density
Nitrogen application affects the growth and development of crops by regulating the absorption and distribution of N,P and K in plant organs,thus affecting yield (Liet al.2014).Chenet al.(2019) reported that increasing the N application rate and planting density could promote N absorption and transport in rice. Here,for leaves and stem-sheaths,increasing N application rate and hill density caused the N translocation and N translocation contribution rates to increase gradually,but caused the N productivity of dry matter and grain to decrease. However,the N productivity values of dry matter (Fig.4-B) and grain (Fig.4-C) were negatively correlated with yield; yield increased with increasing NA,but only up to a point. Although rice plants absorb N from the external environment for N metabolism,the improvements in N and C metabolism (carbohydrate synthesis) are not synchronous (Wuet al.2018),and plants show “redundant N absorption” to some extent (Zhuet al.2019). In this regard,higher N translocation rates and lower N productivity of dry matter and grain are known to increase yields (Liuet al.2017; Lüet al.2020).
We found that the change in N harvest index was higher for 2019 than that for 2018; this is mainly because panicle NA was higher in 2019 than in 2018. This is consistent with higher yield in 2019 than 2018. Generally,N harvest index decreases in response to an increase in N application rate,thereby reducing agronomic N-use efficiency. These results are consistent with those reported by Sharma and Behera(2016),who demonstrated that an increase in N application rate reduced the N harvest index and agronomic N-use efficiency of wheat. Saline–alkaline soil has a high pH,resulting in a high degree of N volatilization from the soil in the form of NH3and N2O (Sangwanet al.2004),reducing the soil N content. Further,the higher pH of saline–alkaline soil limits the growth of the root system and the absorption of nutrients from the soil (Rana and Mark 2008). All of these may be related to the low agronomic N-use efficiency of saline–alkaline paddies. Overall,the N application rate of 150 kg ha−1and the highest hill density that were studied(10 cm between hills,rows 30 cm apart) produced the highest aboveground NA,panicle NA and yield. The aboveground N accumulation and N increase in the panicles were the highest,and the yield was also the highest. Rice yield is,therefore,largely determined by aboveground NA.
5.Conclusion
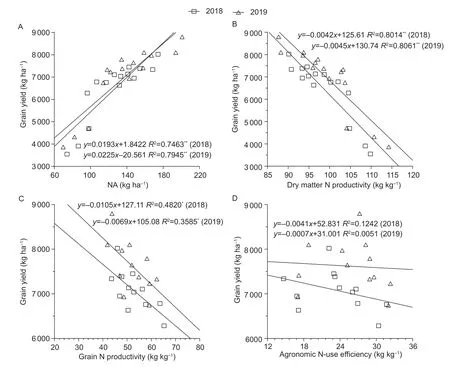
Fig.4 Linear correlations between the actual yield of rice and nitrogen accumulation (NA) in the aboveground parts of rice plants(A),dry matter N productivity (B),grain N productivity (C),and agronomic N-use efficiency (D). * and ** are significantly correlation at P<0.05 and P≤0.01,respectively.
In the range of 0–180 kg N ha−1,the highest yield was obtained at 142.61 kg N ha−1which matched with a planting density of 33.3×10⁴ha−1. Appropriate N application and corresponding hill density can achieve higher rice yields by increasing the following indicators:NA of aboveground plant parts,N translocation,N accumulation increase in the panicle from full heading to maturity,grain N productivity,and the N harvest index. Therefore,coordinating the N application rate and hill density can effectively promote improvements in rice grain yield,N absorption and N utilization in sodic saline–alkaline paddy fields. In particular,reducing the N application rate and increasing hill density may be a good strategy in sodic saline–alkaline paddy fields.
Acknowledgements
This research was financially supported by the the National Key Research and Development Program of China(2016YFD0300104),the Heilongjiang Bayi Agricultural University Program for Young Scholars with Creative Talents,China (CXRC2017001),the Heilongjiang Bayi Agricultural University Support Program for San Heng San Zong,China(TDJH201802),and the Graduate Innovative Research Projects,China (YJSCX2019-Y104).
杂志排行
Journal of Integrative Agriculture的其它文章
- Closing crop yield and efficiency gaps for food security and sustainable agriculture
- lmproving maize grain yield by formulating plant growth regulator strategies in North China
- lmproving winter wheat grain yield and water-/nitrogen-use efficiency by optimizing the micro-sprinkling irrigation amount and nitrogen application rate
- Effects of deep vertical rotary tillage on the grain yield and resource use efficiency of winter wheat in the Huang-Huai-Hai Plain of China
- Effects of mechanized deep placement of nitrogen fertilizer rate and type on rice yield and nitrogen use efficiency in Chuanxi Plain,China
- lmproving grain yield,nitrogen use efficiency and radiation use efficiency by dense planting,with delayed and reduced nitrogen application,in double cropping rice in South China