Effects of deep vertical rotary tillage on the grain yield and resource use efficiency of winter wheat in the Huang-Huai-Hai Plain of China
2021-01-18WUFenZHAlLichaoXUPingZHANGZhengbinElaminHafizBAlLLOLemessaNegasaTOLOSARoyNjorogeKlMOTHOJlAXiulingGUOHaiqian
WU Fen ,ZHAl Li-chao,XU PingZHANG Zheng-binElamin Hafiz BAlLLO ,Lemessa Negasa TOLOSA ,Roy Njoroge KlMOTHO ,JlA Xiu-ling,GUO Hai-qian
1 Center for Agricultural Resources Research,Institute of Genetics and Developmental Biology,Chinese Academy of Sciences/Key Laboratory of Agricultural Water Resources,Chinese Academy of Sciences/Hebei Key Laboratory of Water-saving Agriculture,Shijiazhuang 050022,P.R.China
2 University of Chinese Academy of Sciences,Beijing 100049,P.R.China
3 Institute of Cereal and Oil Crops,Hebei Academy of Agricultural and Forestry Sciences,Shijiazhuang 050035,P.R.China
4 Shijiazhuang Agricultural Products Quality Testing Center,Shijiazhuang 050021,P.R.China
Abstract Tillage represents an important practice that is used to dynamically regulate soil properties,and affects the grain production process and resource use efficiency of crops. The objectives of this 3-year field study carried out in the Huang-Huai-Hai(HHH) Plain of China were to compare the effects of a new deep vertical rotary tillage (DVRT) with the conventional shallow rotary tillage (CT) on soil properties,winter wheat (Triticum aestivum L.) grain yield and water and nitrogen use efficiency at different productivity levels,and to identify a comprehensive management that optimizes both grain yield and resource use efficiency in the HHH Plain. A split-plot design was adopted in field experiments in the winter wheat growing seasons of 2016–2017 (S1),2017–2018 (S2) and 2018–2019 (S3),with DVRT (conducted once in June 2016) and CT performed in the main plots. Subplots were treated with one of four targeted productivity level treatments (SH,the super high productivity level; HH,the high productivity and high efficiency productivity level; FP,the farmer productivity level; ISP,the inherent soil productivity level). The results showed that the soil bulk density was reduced and the soil water content at the anthesis stage was increased in all three years,which were due to the significant effects of DVRT. Compared with CT,grain yields,partial factor productivity of nitrogen (PFPN),and water use efficiency (WUE) under DVRT were increased by 22.0,14.5 and 19.0%. Path analysis and direct correlation decomposition uncovered that grain yield variation of winter wheat was mostly contributed by the spike numbers per area under different tillage modes. General line model analysis revealed that tillage mode played a significant role on grain yield,PFPN and WUE not only as a single factor,but also along with other factors(year and productivity level) in interaction manners. In addition,PFPN and WUE were the highest in HH under DVRT in all three growth seasons. These results provided a theoretical basis and technical support for coordinating the high yield with high resource use efficiency of winter wheat in the resource-restricted region in the HHH Plain of China.
Keywords:winter wheat,deep vertical rotary tillage,resource use efficiency,water use efficiency,partial factor productivity of nitrogen
1.lntroduction
The Huang-Huai-Hai (HHH) Plain of China contains about 20% of the total farming land in the nation,and accounts for about 60–80% of the domestic wheat production,making it one of the most important agricultural regions in China (Konget al.2014). However,wheat productivity in this region has stagnated and may even be decreasing due to resource challenges facing the intensive farming system,such as the shortage of irrigation water due to a decline in the underground water table,and the decreased precipitation due to climate change (Liet al.2014). This has resulted in the deterioration of arable land and environmental issues caused by the overuse of nitrogen to increase yield.Moreover,the farmland in this region is maintained mostly by smallholders,which leads to yield levels that vary from land to land even for the best wheat varieties in the same year(Caoet al.2019). Therefore,improving wheat productivity in this region is a complex issue due to the variations in yield levels and soil quality (van Ittersum and Cassman 2013). Furthermore,smallholders in this area typically employ an annual double-cropping system of winter wheat and summer maize,in general,no-tillage before summer maize seeding and a conventional shallow rotary tillage (CT)before winter wheat planting (Latifmaneshet al.2018). Use of this single tillage system for long years has resulted in some problems such as top-soil hardpan and degradation,deep soil compaction and low use efficiencies of fertilizer and water in winter wheat (Liuet al.2010).
Diverse tillage modes used on farm soil have been explored by agricultural researchers over the past several years in order to address the problems described above,increase winter wheat productivity and ensure food security(Brennanet al.2014). Zero-tillage,reduced-tillage and minimum-tillage systems have been introduced globally to reduce labor or production costs and prevent soil erosion and water loss. However,no-tillage has shown a reduction in wheat or maize yields in a global meta-analysis (Pittelkowet al.2015),that also might be not suitable for the intensive wheat-maize system in HHH Plain of China.
Annual subsoiling at a depth of 10–20 cm results in hardpan produced by ploughs or disks in later years,which limits water infiltration and conservation (Mohantyet al.2007). In contrast,deep tillage or deep-subsoiling was conceived with the aim of breaking up the hard pan in farmland,eliminating soil compaction to boost plant root proliferation,penetration,nutrient uptake,and air permeability (Schneideret al.2017),improving biological health and physical properties of soil (Kahlon and Khurana 2017),facilitating rain infiltration and water retention (Chuet al.2016),and hydraulic conductivity (Jabroet al.2011).As a result,deep tillage allows the yield of crops to be continuously enhanced,supporting well-distributed root systems and resistance to environment stress. Subsoil tillage (30 or 50 cm) reduced soil compaction and increased soil water content,proliferated more root in deeper soil,increased lodging resistance of the plant and also the yield and biomass (Caiet al.2014). Deep tillage to 45 cm reduced soil bulk density and penetration resistance,improved soil infiltration rate,root length density and wheat grain yield(Kahlon and Khurana 2017). Subsoiling to 38 cm promoted post-anthesis dry biomass accumulation and remobilization to grain,and increased water use efficiency (WUE) of winter wheat (Chuet al.2016).
Rotation tillage of deep tillage with other tillage is also studied to better improve soil quality. Rotary tillage (10–15 cm)in rotation with plowing tillage (30–35 cm) reduced soil bulk density,increased soil organic carbon,soil enzyme activities and grain yield of wheat–maize cropping system (Zhanget al.2018). Rotary tillage (15 cm) after subsoiling (38 cm)with an interval of two years increased soil water content at 100–160 cm soil layer,WUE and winter wheat grain yield(Maet al.2015).
Deep vertical rotary tillage (DVRT) is a deep-tillage technology that combines the advantages of subsoiling,deep tillage,rotation tillage,and vertical tillage. It is carried out by a novel powerful machine equipped with six vertical spiral drills,and allows compacted plough pans to be broken up and soil layers to be loosened without disturbing soil horizons and producing new hardpan (Schneideret al.2017; Wei 2017). The working depth can be 30–100 cm.DVRT had been reported to improve yield and efficiency in many crops such as cassava,sugarcane,rice,and maize,especially on saline-alkaline land and dry land (Zhaiet al.2019). In addition,the Ministry of Agriculture and Rural Affairs of the People’s Republic of China (MARA,formerly Ministry of Agriculture (MOA)) published the“National Implementation Plan for Deep Loosening and Land Preparation of Agricultural Machinery (2016–2020)”to promote the use of deep tillage to improve the quality of cultivated land and solve problems caused by intensive cultivation and land degradation in China (MOA 2016).However,the effects or post-effects of DVRT on the grain yield and resource use efficiency of winter wheat have not yet been studied in detail in the winter wheat–summer maize cropping system in the HHH Plain of China. Single use of DVRT practice may be a new tillage mode that would have long-term positive effects for small farmer households in this region. To compare the effects of DVRT and CT modes on winter wheat production in the HHH Plain,a three-year field experiment was conducted to examine the soil bulk density and water content,the agronomic traits of winter wheat at different yield levels,and the nitrogen and water use efficiencies at different yield levels. Also an optimal agricultural management would be suggested.
2.Materials and methods
2.1.Experimental site
A three-season field experiment was carried out at Luancheng Agro-Ecosystem Experimental Station (37°53´N,114°41´E,50 m a.s.l.) of the Chinese Academy of Sciences in Shijiazhuang City,Hebei Province,China,in the seasons from October 2016–June 2017 (S1),October 2017–June 2018 (S2) and October 2018–June 2019 (S3),corresponding to winter wheat growing seasons in the HHH Plain. This region has a tropical and subtropical steppe climate (Köppen Climate Classification,http://www.weatherbase.com/weather). A winter wheat–summer maize double cropping system is commonly used by farmers in this agricultural zone. Prior to 2016,the DVRT and CT sites had both undergone CT tillage before the sowing of winter wheat and had been treated with nitrogen fertilizer for many years as local farmers had done. In June 2016,tillage practices were conducted in each field that incorporated the chopped straw and fertilizer into the soil (Table 1). DVRT,with a tillage depth of about 45 cm,and CT,with a tillage depth of about 15 cm as per the local farmers’ standard practice were carried out before the maize was planted. The innovative machine used for DVRT was the same one used in previous studies of our research group (Zhaiet al.2017,2019). The average winter wheat growth season temperatures in S1,S2 and S3 were 8.8,7.9 and 8.0°C,respectively,and the average precipitation levels were 119,161 and 113 mm,respectively,accounting for approximately 24,50 and 32% of the total annual precipitation. The average daily temperature and monthly precipitation in all three seasons are shown in Fig.1. The weather data were monitored using an automated weather station located at the agricultural station.The cultivated farm soil in the area is light loam.The nutrient contents of the 0–20 cm topsoil layer of the experiment field before wheat sowing in S1 were 1.52%organic matter,0.10% total nitrogen,6.2 mg kg–1available phosphorus (P),and 116.9 mg kg–1available potassium (K).
2.2.Experimental design
A two-factor split-plot design was used,in which the main plots corresponded to two different tillage practices (DVRT and CT). Each main plot was divided into four subplots corresponding to different grain yield levels,with three replicates each. Each sub-plot was about 72 m2(8 m×9 m).The crop was planted at row spacing of 15 cm and plots were separated by 1 m land planted by winter wheat. Jimai 22,a multi-spike winter wheat cultivar widely planted in the HHH Plain,with a growth period of about 240 days,was used.Wheat seeds were sown on October 4,2016,October 15,2017 and October 10,2018 using a seeder machine that can adjust seeding rates to a planting density of 300 basic seedlings m–2. Wheat harvesting was done on June 9,2017,June 9,2018 and June 11,2019. During harvesting,the wheat straw was smashed and returned evenly to the field by machine,then summer maize was sown in the retained stubble. After harvesting of summer maize,the maize straw was buried into the soil by using a traditional shallow rotary tillage machine before row seeding of winter wheat.The four productivity levels in the subplots included the super high productivity level (SH),the high productivity and high efficiency level (HH),the farmer productivity level (FP),and the inherent soil productivity level (ISP) with no fertilizer input as a blank control. Details of the fertilizer application regimes are provided in Table 2.

Table 1 Soil tillage practices performed before summer maize and winter wheat seeding in the main plots from 2016–2018
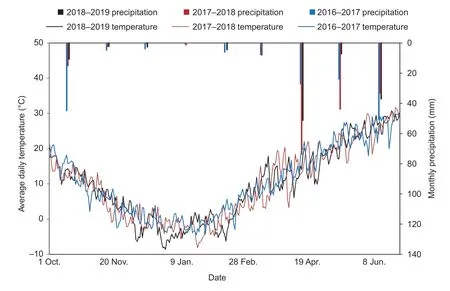
Fig.1 Daily average temperature and monthly precipitation during the 2016–2017,2017–2018 and 2018–2019 winter wheat growing seasons.

Table 2 Fertilizer application regimes in the winter wheat growing seasons of 2016–2017,2017–2018 and 2018–2019
In S2,pre-sowing irrigation was performed due to dry weather conditions,and in S1 and S3,irrigation was applied immediately after wheat sowing according to the conventional farmers’ practice. The irrigation amount was approximately 60 mm per application,administered with a plastic hose receiving water from an electrically powered deep well (the powered pump is equipped with a water meter). In the same experimental field,a second round of irrigation was performed during the jointing stage of winter wheat,from the end of March to the start of April. A third round of irrigation was carried out at the beginning of the grain filling stage. The irrigation regimes for the three seasons are shown in Table 3. Other field management practices,such as pesticide and herbicide application,followed the standard practices of local farmers.
2.3.Sampling and measurement
Soil water contentSoil samples were collected for measuring the soil water content (SWC) from 6–12 random undisturbed cores in S1,S2 and S3 using a soil auger(4.5 cm inner diameter) at 10 cm increments to a depth of 100 cm in both the DVRT and CT plots. The SWC(gravimetric water content,%) of the top 100 cm soil layer was measured using the oven-drying method (Maet al.2015). The SWC was obtained by dividing the weight difference between the dried soil and the fresh soil by the weight of the dried soil. Measurements were carried out before sowing,beginning of the anthesis stage and the end of the maturity stage.
Soil bulk densityThe soil bulk density (SBD) wasmeasured before winter wheat sowing and after harvesting.Samples were collected using a steel cylinder (7 cm inner diameter,5 cm height) with a 1.2-m handle to take soil cores from each 10 cm layer to a soil depth of 100 cm. Each soil core was numbered and placed in a separate nylon bag before air-drying to a constant weight. The SBD was calculated by dividing the weight of the dried soil by the volume of the soil (Kahlon and Khurana 2017).

Table 3 Irrigation regimes in the winter wheat growing seasons of 2016–2017 (S1),2017–2018 (S2) and 2018–2019 (S3)
Dry matter accumulation and harvest indexIn the middle of each plot,sampling area was selected (two rows,each 1 m in length),plants were manually collected at the ground level at maturity. The stems were separated into stalks,leaves and spikes and oven-dried at (85±5)°C to a constant weight to measure the dry matter weight of the respective parts (Shiet al.2016). Total above-ground dry matter accumulation (DM) of wheat is the total dry matter of stalks,leaves and spikes. The spikes were further separated into grain and husk to measure the dry weight of grains in each plot. The harvest index (HI) was computed by dividing the weight of dried grains by the DM.
Agronomic traits of winter wheatThe agronomic traits of winter wheat investigated included grain yield and three yield components:spike number m–2(SN),grain number per spike (GN) and thousand-grain weight (TGW).
At maturity,wheat plants from three sites (six rows,each 1 m in length) selected randomly at the center part of each plot were collected manually to determine the populationlevel grain yield after threshing with a small stationary thresher. After sun-drying of the grains,the dry weight and water content of the grains were measured. The grain yield(GY) was finally determined under the condition of 12.5%water content and 99% purity according to the national standard.
The SN was counted in six inner rows with each 1 m length,and the GN was determined by counting thegrains per spike from 10–15 randomly selected plants in each plot before harvest. The TGW (with 12.5% water content) was calculated by weighing 1 000 seeds from the grain yield measurement samples. The SN,GN and TGW were all measured with three replicates for each plot in every season.
Nitrogen use efficiency and WUENitrogen use efficiency was calculated based on the partial factor productivity of nitrogen (PFPN),which is an indicator of nitrogen use efficiency. ThePFPN(kg kg–1) was calculated by dividing the grain yield with the nitrogen application rate (Brennanet al.2014).
The WUE was calculated according to the following formulae (Liet al.2011):

where GY (kg ha–1),grain yield; ET (mm),evapotranspiration;I (mm),irrigation; P (mm),precipitation; R (mm),surface runoff; D (mm),drainage from the root zone; ΔSW (mm),change in stored soil water (0–100 cm) between the presowing and maturity stages; SW (mm),stored soil water(0–100 cm) at the pre-sowing or maturity stages; SBD (g cm–3),soil bulk density; H (cm),soil depth; SWC (%),soil water content. R and D can be ignored due to the conditions at the experimental site (no significant surface runoff and a low groundwater table).
2.4.Data analysis
Microsoft Excel 2016 (Microsoft Corp.,Redmond,WA,USA)was used for data processing. SPSS Software (ver.19.0;SPSS Inc.,Chicago,IL,USA) was used to performt-test for the difference determination of SWC,SBD,GY,and other traits between the two tillage modes. Figures were plotted using either Microsoft Excel 2016 or SigmaPlot 12.5 (Systat Software Inc.,San Jose,CA,USA). ThePFPN,WUE,GY,SN,GN,TGW,HI,and DM were subjected to analysis of general linear model (GLM) in SPSS to assess the effects and interactions of year,tillage mode,productivity level and block,respectively. Year,tillage mode and productivity level were set as the fixed factors,block was set as a random factor. Path analysis was carried out in Stepwise Linear Regression in SPSS.
3.Results
3.1.Soil water content (SWC)
The SWC of DVRT and CT modes in the 0–100 cm soil layer at anthesis in all three years are shown in Fig.2. In S1,there was no difference of SWCs between the DVRT and CT modes. In S2,the DVRT mode resulted in significantly higher SWCs than the CT mode in the 20–40 cm soil layer and non-significantly higher values in the other soil layers.In S3,the SWC in the 40–60 cm soil layer was significantly higher under DVRT mode than under CT mode,and was non-significantly higher in the other soil layers. These results showed that the SWC at the anthesis stage was 4.3% higher in the 20–40 cm soil layer and 11.4% higher in the 40–60 cm soil layer after two and three years of DVRT mode,respectively,than after CT mode. No difference of SWCs in the 0–100 cm soil layer was found between the DVRT and CT modes before sowing and after harvesting.
3.2.Soil bulk density (SBD)
The SBD at maturity,which can indicate complex changes in soil structure,was affected differently by the two tillage practices during the experimental period (Fig.3). In S1,the SBD decreased dramatically in the 0–20 and 20–40 cm topsoil layers under DVRT mode compared with CT mode.DVRT mode significantly reduced the SBD of the 0–20,20–40,40–60,and 80–100 cm soil layers in S2,as well as the 0–20 cm soil layer in S3,compared with CT mode.Under DVRT mode in S2,the SBD significantly decreased by 8.0,4.1,3.2,and 1.9% in the 0–20,20–40,40–60,and 80–100 cm soil layers,respectively,and non-significantly decreased by 5.4% in the 60–80 cm soil layer. In S3,DVRT reduced the SBDs by 7.4,1.5,6.6,3.1,and 2.9% in the 0–20,20–40,40–60,60–80,and 80–100 cm soil layers,respectively. These results indicated that DVRT mode had persistent effects on loosening the soil structure for three years of study.
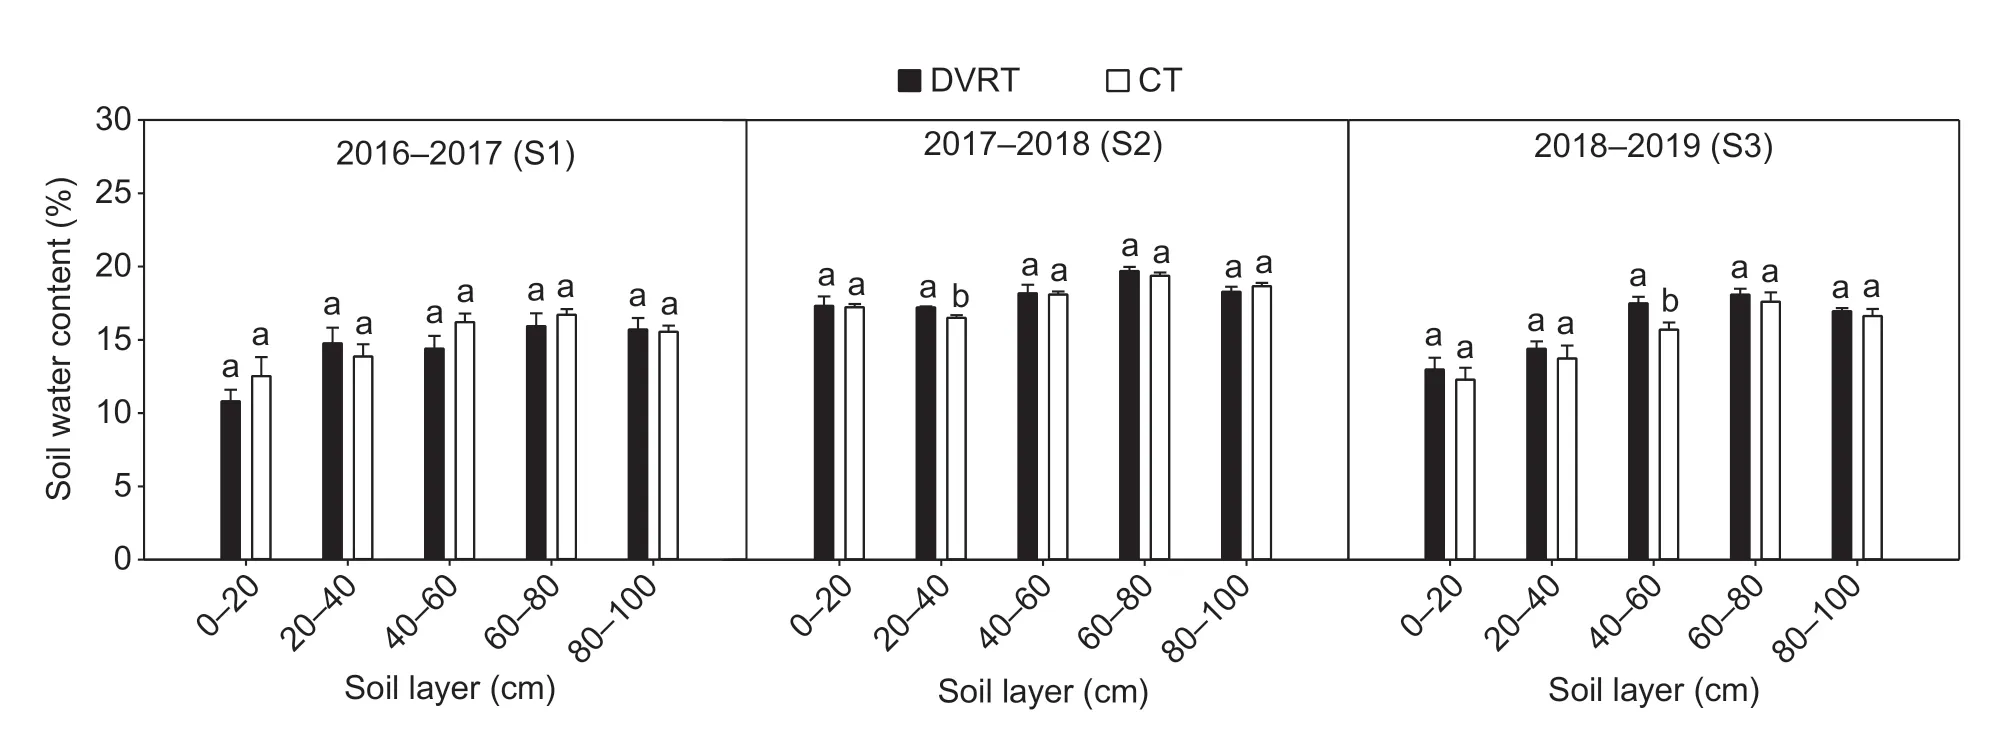
Fig.2 Soil water content in the 0–100 cm topsoil layer under deep vertical rotary tillage (DVRT) and conventional shallow rotary tillage (CT) modes at the anthesis stage in the 2016–2017,2017–2018 and 2018–2019 winter wheat growing seasons. Bars mean SE (n=3). Different letters under the same soil layer indicate significant differences (P<0.05) in t-test between the two different tillage modes.
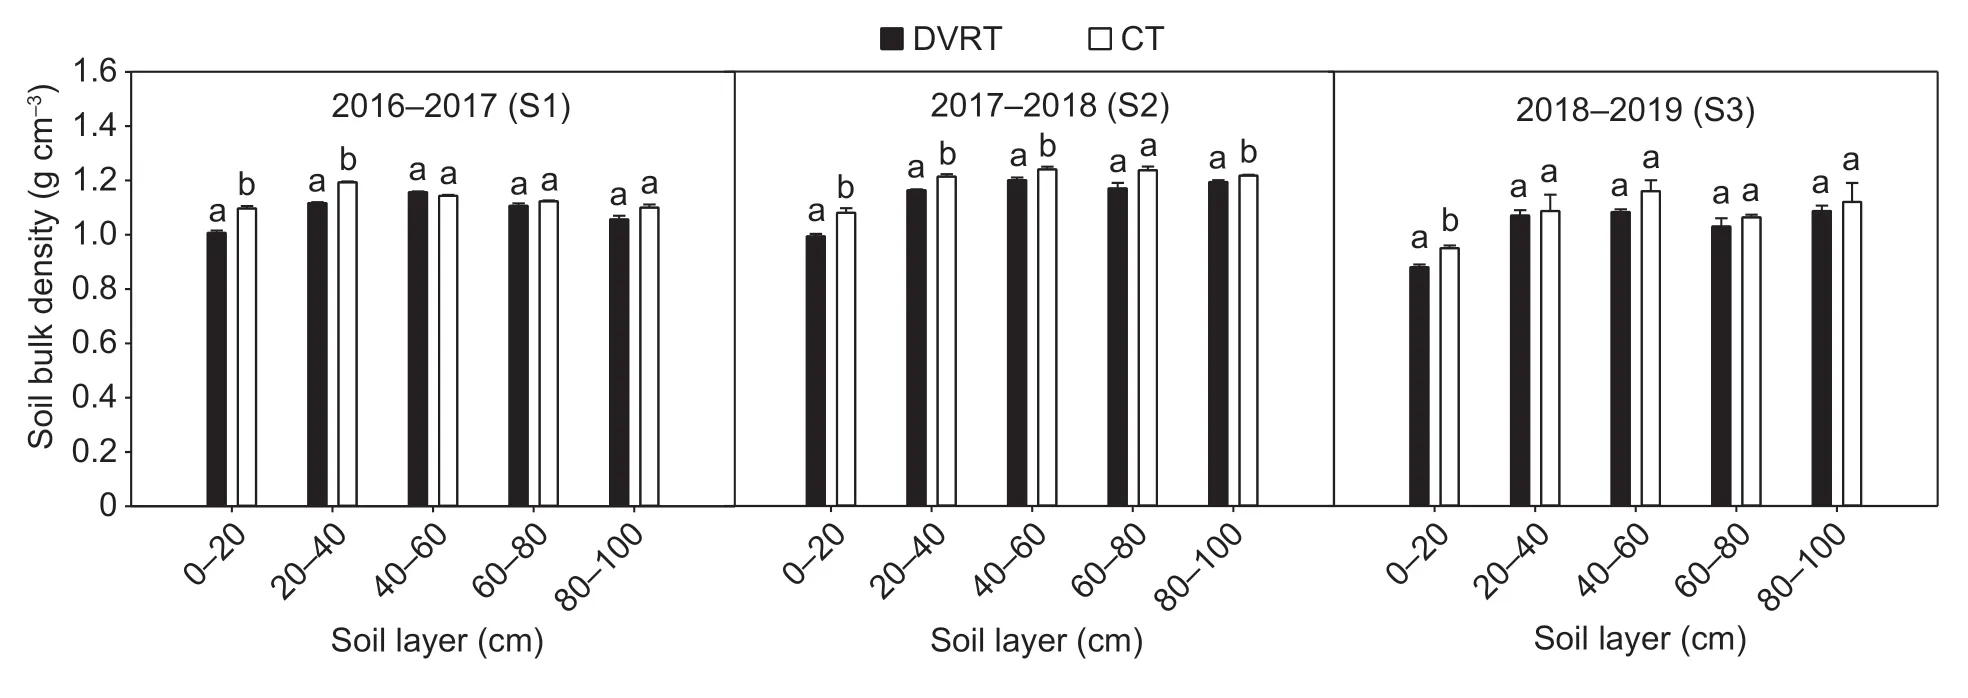
Fig.3 Soil bulk density in the 0–100 cm topsoil layer under different tillage modes in the 2016–2017,2017–2018 and 2018–2019 winter wheat growing seasons. DVRT,deep vertical rotary tillage; CT,conventional shallow rotary tillage. Bars mean SE (n=3).Different letters under the same soil layer indicate significant differences (P<0.05) in t-test between the two different tillage modes.
3.3.GY and yield components
The values for GY,TGW,GN,SN,DM,and HI of winter wheat are shown in Table 4. The effects of the two tillage modes on GY differed among the productivity levels.Significant differences in the GY were observed between DVRT and CT modes at all four productivity levels in S1. In HH and ISP in S2,and in FP in S3,the GYs were significantly higher under DVRT mode than that under CT mode. In summary,DVRT improved GY across the three years,by 8.4% in SH,16.0% in HH,25.2% in FP,and 55.4% in ISP,and by 22.0% across all productivity levels.
Variation analysis of the GY among the four productivity levels in every year showed that average GY across different productivity levels under DVRT was greater than that under CT,and with smaller coefficient of variation (CV),as in Fig.4-A.That indicated that DVRT improved winter wheat GY in low productivity levels (FP and ISP) more than high productivity levels (SH and HH). Variation analysis of the GY among the three years in each productivity level illustrated that yearly average GY under DVRT was greater than that under CT,and with higher CVs in high productivity levels,but smaller CVs in low productivity levels,as in Fig.4-B.
The degree of effects of DVRT on yield components,compared to CT,also differed among the productivity levels (Table 4). Correlation analysis showed that grain yield of winter wheat under DVRT and CT was correlated significantly with SN (0.803**) and DM (0.778**) at α=0.01 level,significantly with GN (0.470*) and HI (0.470*) at α=0.05 level. Path analysis and direct correlation decomposition furtherly illustrated that SN was mostly contributed to GY under DVRT and CT,path coefficient and decision factor of SN under DVRT was larger than that under CT (Table 5).Linear regression equations showed a larger slope of SN under DVRT than that under CT.
Besides purely comparing the effects of two differenttillage modes on grain yield and other agronomic traits when other factors were all the same,the variation source of year,productivity level,block and their interactions were furtherly analyzed (Table 6). The results showed year,productivity level,tillage mode,and their interactions significantly affected grain yield of winter wheat,but block did not. TGW was significantly affected by year,productivity level and their interaction,but not by tillage mode. GN variation mostly caused by year,productivity level and their interaction,as well as tillage mode and productivity level interaction. The variance of SN came from productivity level,year,tillage mode,and the interaction of year and productivity level.DM variance contributed mostly to productivity level,the respective interactions of productivity level,year and tillage mode,as well as tillage mode. Year and the interaction of productivity level with tillage mode made notable effects on HI.
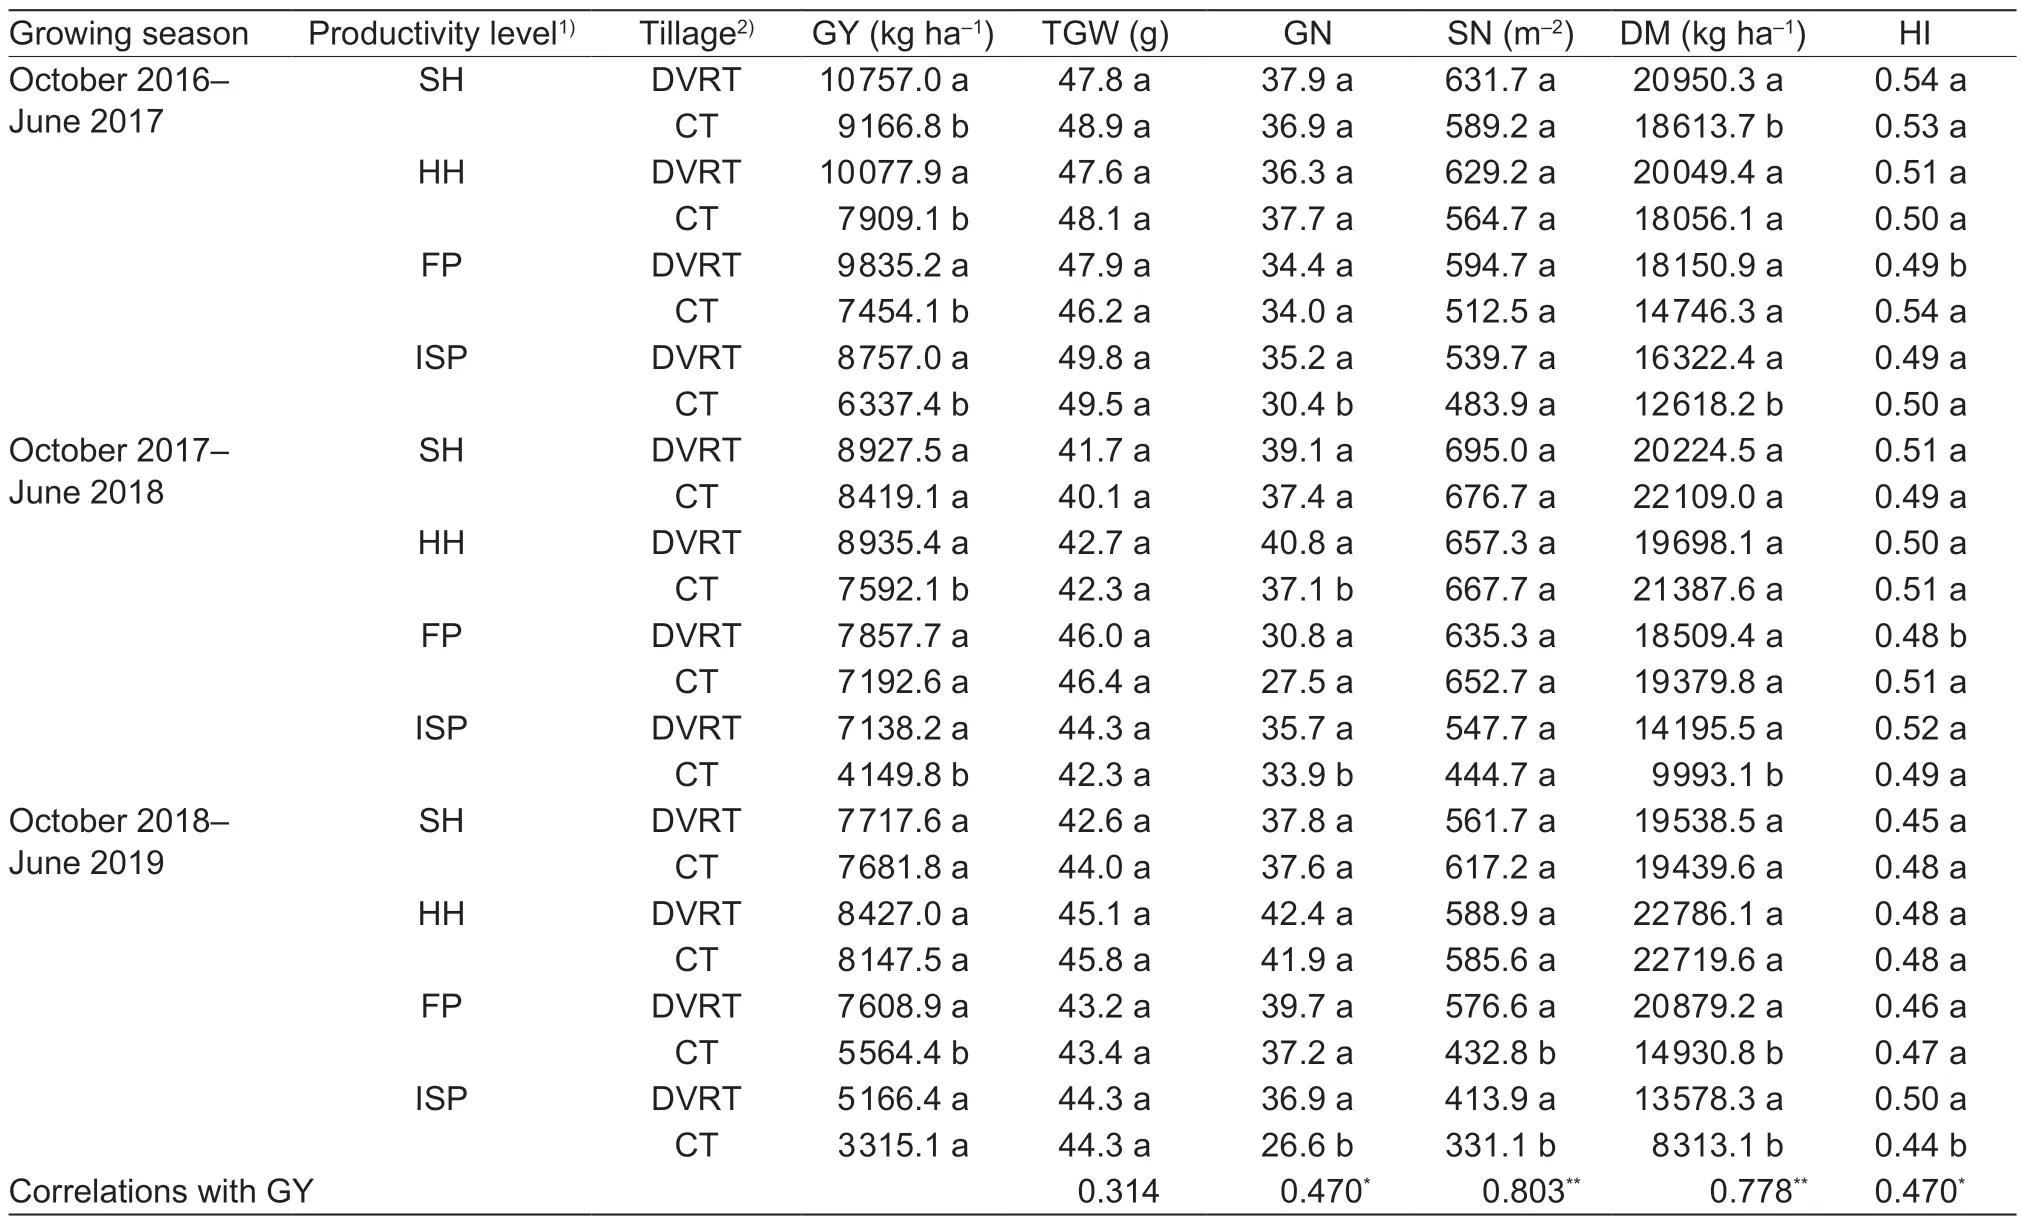
Table 4 Grain yield (GY),thousand-grain weight (TGW),grain number per spike (GN),spike number per hectare (SN),total aboveground dry matter accumulation (DM),and harvest index (HI) of winter wheat under different tillage modes in three growing seasons
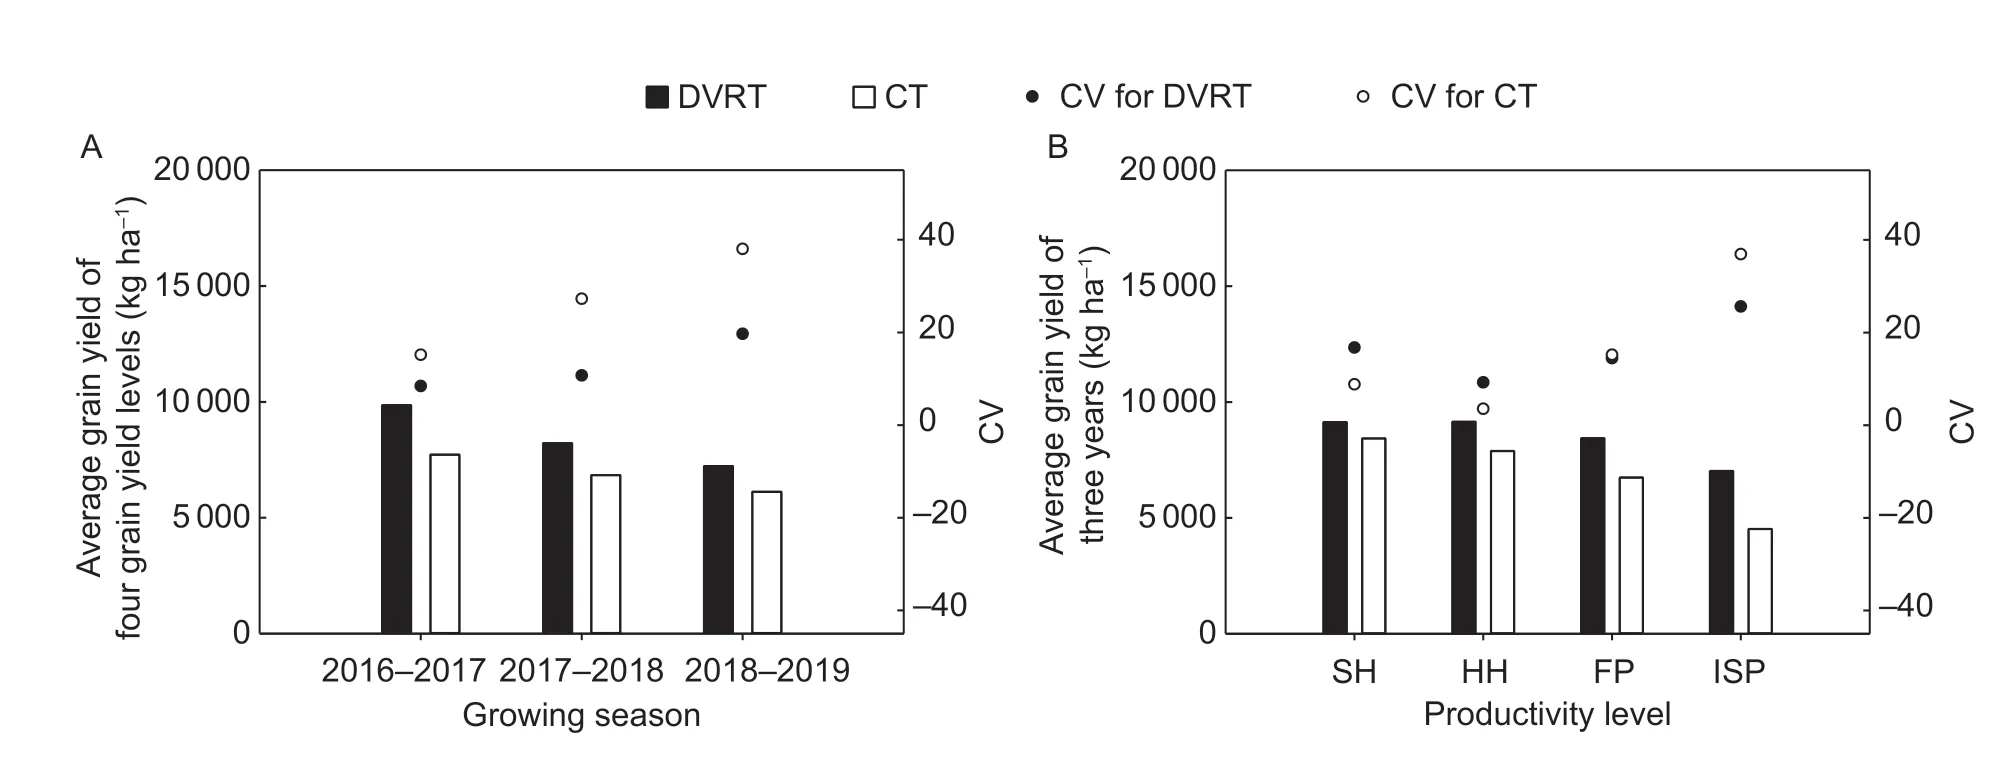
Fig.4 Average grain yields over four productivity levels under different tillage modes in the 2016–2017,2017–2018 and 2018–2019 winter wheat growing seasons (A) and average grain yields under different tillage modes over three years at four different productivity levels (B). DVRT,deep vertical rotary tillage; CT,conventional shallow rotary tillage. CV,coefficient of variation.SH,the super high productivity level; HH,the high productivity and high efficiency level; FP,the farmer productivity level; ISP,the inherent soil productivity level.

Table 5 Simple correlation coefficient decomposition between grain yield and yield components under DVRT and CT modes

Table 6 Analysis of variance for grain yield and yield component traits of winter wheat under different treatments
3.4.Nitrogen use efficiency and WUE
ThePFPNand WUE values at different productivity levels under DVRT and CT are shown in Figs.5 and 6. As Fig.5 shows,the averagePFPNacross the three years under DVRT was higher by 8.5% in SH (33.8 kg kg–1),16.0%in HH (43.6 kg kg–1) and 25.2% in FP (25.5 kg kg–1),and 14.5% across the three productivity levels than that under CT. ThePFPNvalues were the highest in HH under DVRT in all three seasons. Correlation analysis showed that grain yield of winter wheat was significantly positively correlated withPFPNat α=0.01 level,correlation coefficient was 0.715**.
The data in Fig.6 shows that there was a significant increase in the WUE at all four productivity levels under DVRT compared with CT in S1. In S2,the WUEs in HH and ISP were significantly higher under DVRT than those under CT. In S3,the WUEs in FP and ISP were 26 and 67% higher,respectively,under DVRT than those under CT. The highest WUE occurred in HH grain under DVRT in all three years.Overall,compared with CT,the average WUE across the three years under DVRT increased by 6.6% in SH (2.21 kg m–3),12.8% in HH (2.59 kg m–3),20.9% in FP (1.97 kg m–3),and 50.1% in ISP (1.74 kg m–3),and by 19.0% across all productivity levels. Correlation analysis showed that grain yield of winter wheat was significantly positively correlated with WUE at α=0.01 level,correlation coefficient was 0.891**.

Fig.5 Nitrogen use efficiencies at different productivity levels under different tillage modes in the 2016–2017,2017–2018 and 2018–2019 winter wheat growing seasons. DVRT,deep vertical rotary tillage; CT,conventional shallow rotary tillage. SH,the super high productivity level; HH,the high productivity and high efficiency level; FP,the farmer productivity level. Bars mean SE (n=3).Different letters under the same yield level indicate significant differences (P<0.05) in t-test between the two different tillage modes.
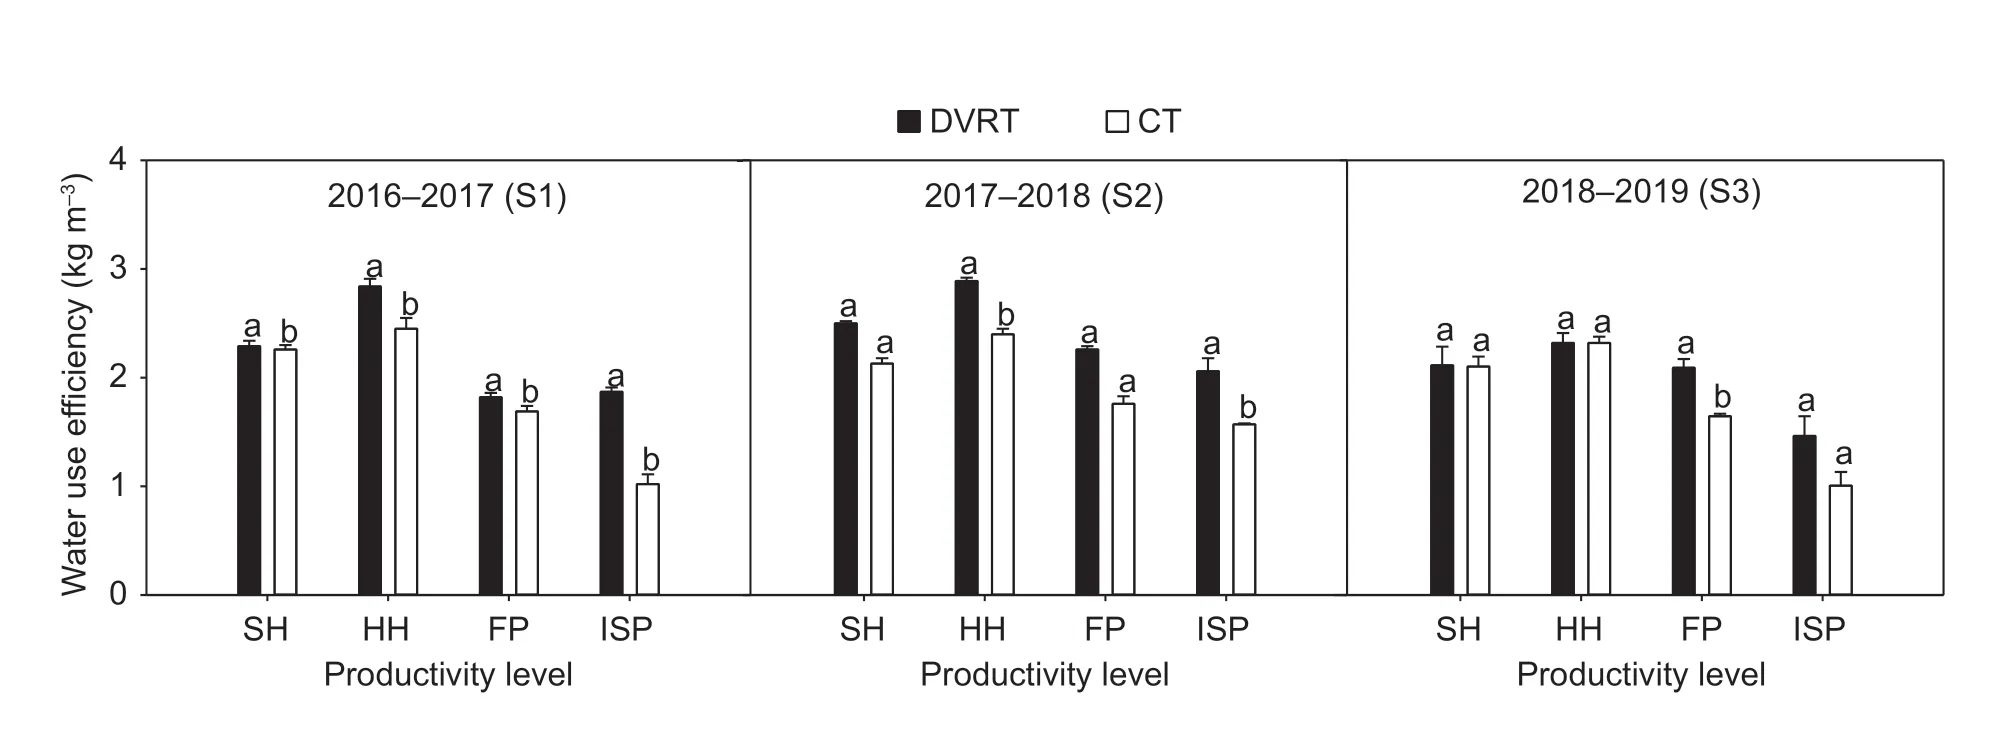
Fig.6 Water use efficiencies at different productivity levels under different tillage modes in the 2016–2017,2017–2018 and 2018–2019 winter wheat growing seasons. DVRT,deep vertical rotary tillage; CT,conventional shallow rotary tillage. SH,the super high productivity level; HH,the high productivity and high efficiency level; FP,the farmer productivity level; ISP,the inherent soil productivity level. Bars mean SE (n=3). Different letters under the same yield level indicate significant differences (P<0.05)in t-test between the two different tillage modes.
WUE andPFPNwere remarkably affected by year,productivity level,and their interactions,as well as the tillage mode (Table 7).
4.Discussion
4.1.Effects of DVRT on SWC and SBD
As shown by the results of the second national land survey of China in 1979 (http://vdb3.soil.csdb.cn/),a shallower topsoil layer has become a major limiting factor for crop production due to the use of heavy machinery or no tillage with straw return to the field,especially in the water-limited regions of HHH Plain (Lindert 2000). The SBD is a reliable indicator of soil compaction and other physical properties(Zhanget al.2012),and is negatively related to the wheat tiller number and yield (Gill and Aulakh 1990). As shown in Fig.3,the SBD reduced over the course of three years under DVRT mode,and the increased tiller number led to an increased SN (Table 5). The direct effects of DVRT on SBD reduction were most obvious in S1,the first year (June 2016) when DVRT was implemented. Surprisingly,the SBD significantly decreased in DVRT-treated fields in S2,possibly due to the long-term ameliorating effects of DVRT on the soil micro-environment. These results are consistent with those of previous studies (Muet al.2016; Schneideret al.2017; Zhanget al.2018),and may be explained based on the use of high-speed vertical drilling in the DVRT mode to break up the plough pan,improving the soil environment and loosening deep soil layers with long-lasting effects. CT mode could decrease the SBD to some extent as well (Houet al.2012),that may explain why the SBD in the 0–20 cm soil layer decreased to a different extent under DVRT than that under CT while in other soil layers with no obvious differences in the third year.
The SWC can serve as an indicator of soil water stress conditions,which are a major limiting factor for the growth of winter wheat,especially in the water-limited HHH Plain.In this region,most farmers limit the use of flood irrigation during the long,dry growth period of winter wheat,and the soil water storage ability is thus very important for winter wheat growth. Schneideret al.(2017) concluded that successful deep tillage would increase the SWC and the plant-available water pool. Varying tillage practices can affect the soil moisture content and soil water storage,and deep tillage with straw return can improve the soil waterholding capacity (Maet al.2015). Deep tillage increased the soil moisture content at the critical anthesis period (Sunet al.2013). In the present study,DVRT mode increased the SWC in the 0–100 cm soil layer (Fig.2),indicating that it may be able to offset the adverse effects of waterlogging and deep percolation during flood irrigation (Zhou and Zhao 2019),and that was beneficial for winter wheat growth.
The results of previous studies (Jabroet al.2011; Liuet al.2015) suggested that the SBD and SWC can be influenced markedly by various tillage practices,which play an important role in a healthy water-soil-returned straw-crop complex system. The results of the present study confirmed that DVRT has long-term effects in reducing the SBD and increasing the SWC.Notably,previous experiments performed by Zhaiet al.(2017,2019) on two study sites,one of which was the same as in the current study,showed that DVRT reduced the SBD and increased the SWC in the 0–60 cm soil layer.
4.2.Effects of DVRT on grain yield and yield components
Deep tillage to 50 cm increased the crop yield by 0.1–0.5 Mg ha–1,and this effect persisted for three years after the treatment was applied (Hallet al.2010). Previous research in our group on the first crop summer–maize after DVRT practice showed DVRT practice increased yield due to amelioration of soil properties and root system development(Zhaiet al.2019). The current study found that the GY of the second crop winter–wheat (in S1) after DVRT practice significantly improved at all four productivity levels. The GY of winter wheat also increased at almost every productivity level in the following years,but most notably in HH in S2 and in FP and ISP in S3. GLM analysis revealed that tillagemode had a significant direct effect on GY variation and SN variation,and a significant interaction with productivity level on GN variation. SN was the crucial component that was improved by tillage mode and then determined higher GY of winter wheat as shown in Table 5. The underlying reasons might be that tillage mode increased the land soil productivity by overcoming the soil limitation factors,thus improving soil properties and water infiltration,enhancing soil fertilizer to be better absorbed by winter wheat. Moreover,the interaction between tillage mode and productivity level was worth noting. In FP,fertilizer was overused and tillage mode could facilitate nutrient absorption and use efficiency such asPFPN. In ISP,tillage mode could enhance winter wheat proliferation by motivating inherent soil activity through reducing compaction and water retention. In SH and HH,the management practices were recommended for higher grain yield for the balanced fertilizer application,which determined the high grain yield,so tillage mode played a less obvious role on grain yield increase. In addition,productivity level factor may have been the primary determining factor for more DM production in the Jimai 22 variety,which has a steadily high HI (Songet al.2010). Above-ground DM was significantly directly affected by tillage mode due to healthy under-ground soil environment and good leaf photosynthesis improved by deep tillage (Shiet al.2016). HI did not differ between tillage modes over the study period,however,tillage mode did affect HI through positive interaction with productivity level factor.

Table 7 Analysis of variance of water use efficiency and partial factor productivity of applied nitrogen (N)
Grain yield variation is a significant concern in the context of climate change and other uncertain environmental factors(Hochmanet al.2017). The year factor indeed showed significant effect on the grain yield and related agronomic traits (Table 6). Fig.4-B shows that the CV values were greater under DVRT at SH,HH yield levels,this may indicate that the grain yield decreases with the time elapsed since DVRT practice,but may also be explained by factors such as climate change. This may indicate that the grain yield was higher under more favorable weather conditions,and could be maximized by DVRT regardless of the conditions.This is consistent with the suggestion by Schneideret al.(2017) that deep tillage makes crops more resilient in face of climate change and other challenges. Moreover,as shown in Fig.4-A,DVRT reduced the grain yield gaps among the four productivity levels by enhancing yield at low productivity levels (FP and ISP) more than at high productivity levels (SH and HH),compared with CT.
Overall,although the grain yield of winter wheat is determined by complex factors,we found that DVRT as a better tillage mode could increase the grain yield by positively affecting its components,and that these effects could persist over at least three years,potentially making wheat crops more resistant to climate change influences such as drought through better water storage in soil.
4.3.Effects of DVRT on NUE and WUE
ThePFPNand WUE were significantly affected by tillage mode in all three seasons (Figs.5,6 and Table 7).PFPNdecreased with increased nitrogen application (Yanget al.2017). Similarly,in the present studyPFPNdecreased with increasing nitrogen fertilizer application rate (FP>SH>HH)under both tillage modes in each season. DVRT mode significantly increasedPFPNcompared with CT,which was consistent with the results of previous studies regarding the beneficial effects of positive tillage on nitrogen use (Chenet al.2017). The underlying reason may be that DVRT could break the soil obstacles that limit nitrogen assimilation (Liet al.2014),mitigate nitrogen loss,buffer nitrogen availability(Schneideret al.2017) and promote winter wheat growth which led to increased DM and spikes,particularly in the nitrogen-overfertilized farmland (FP) (Fig.4). Moreover,the soil under DVRT had better water reservoir available to winter wheat growth (Schneideret al.2017),especially at anthesis which is a critical stage for water usage (Fig.2).That had also facilitated winter wheat to utilize stored soil water in deeper layer (Maet al.2015),particularly in 20–60 cm soil layer in this research (Fig.2),consequently enhancing WUE (Fig.6).
The grain yield didn’t show much difference between SH and HH through the three years,but the best nitrogen and water use efficiencies were observed in HH under DVRT(Figs.5 and 6),indicating that DVRT may allow nitrogen fertilizer input to further decline under water-restricted conditions by improving soil quality through tillage in the HHH Plain. Moreover,in S3,the GY was even significantly higher in FP under DVRT,indicating that a single DVRT practice may have more long-term benefits than an annual CT treatment.
5.Conclusion
The present study showed that DVRT mode had stronger beneficial effects on farmland soil quality,water storage ability,winter wheat grain yield,and resource use efficiency than CT mode,which could last for three years. The SBD in the 0–20-cm soil layer under DVRT was obviously reduced across the three years,and the SWC at anthesis in the 20–40-cm (S2) and 40–60-cm (S3) soil layers was improved. These resulted in a more favourable underground environment for winter wheat growth,especially for SN formation and DM. Taken together,DVRT increased the use efficiency of water and nitrogen,as well as the grain yield of winter wheat. The present results suggested that the optimal management regime in terms of higher grain yield and the highest resource use efficiency was HH (nitrogen application rate of 210 kg ha–1,with a basic and top-dressing ratio of 6:4 and top-dressing at the jointing stage; P2O5and K2O application rates of 120 kg ha–1; irrigation regime with pre-sowing and jointing stage irrigation) under DVRT.
Acknowledgements
This study was supported and funded by the National Key Research and Development Program of China(2016YFD0300105,2017YFD03002 and 2016YFD0300106)and the Key Research and Development Program of Hebei Province,China (20326403D).
杂志排行
Journal of Integrative Agriculture的其它文章
- Closing crop yield and efficiency gaps for food security and sustainable agriculture
- lmproving maize grain yield by formulating plant growth regulator strategies in North China
- lmproving winter wheat grain yield and water-/nitrogen-use efficiency by optimizing the micro-sprinkling irrigation amount and nitrogen application rate
- Effects of mechanized deep placement of nitrogen fertilizer rate and type on rice yield and nitrogen use efficiency in Chuanxi Plain,China
- lmproving grain yield,nitrogen use efficiency and radiation use efficiency by dense planting,with delayed and reduced nitrogen application,in double cropping rice in South China
- Differences of yield and nitrogen use efficiency under different applications of slow release fertilizer in spring maize
