A new feasible method for yield gap analysis in regions dominanted by smallholder farmers,with a case study of Jiangsu Province,China
2021-01-18SHAOJingjingZHAOWenqingZHOUZhiguoDUKangKONGLingjieWANGYouhua
SHAO Jing-jing,ZHAO Wen-qing, ,ZHOU Zhi-guo, ,DU Kang,KONG Ling-jie,WANG You-hua,
1 Key Laboratory of Crop Eco-physiology and Management,Ministry of Agriculture and Rural Affairs/Agronomy College,Nanjing Agricultural University,Nanjing 210095,P.R.China
2 Jiangsu Collaborative Innovation Center for Modern Crop Production (JCIC-MCP),Nanjing Agricultural University,Nanjing 210095,P.R.China
3 Food Crop Research Institute,Jiangsu Academy of Agricultural Sciences,Nanjing 210014,P.R.China
Abstract In the regions where crops were mostly produced by smallholder farmers,the analysis of yield gap is difficult due to diverse cultivars,crop managements and yield levels. In order to find an effective method that can reasonably verify the yield gap and the limiting cultivation factors in narrowing yield gaps in areas that are dominanted by smallholder farmers,we worked out a method consisting five progressive procedures as follows:questionnaire investigation of farmer cultivation regime,identification of yield levels and yield gaps,generalization of key cultivation measurements,reconstruction of representative maize populations,and process-based analysis of yield gap. A case study was carried out in Jiangsu Province,China,in which maize is mostly produced by smallholder farmers. A questionnaire investigation of 1 023 smallholder farmers was carried out firstly,then the frequency distribution of maize yield was simulated by an normal distribution function,and then the covering range and average value of the basic yield,farmer yield and high-yield farmer yield levels were calculated out from the equation. Hereby,the yield gaps 1,2 and 3 were calculated along with the record highest yield from literature and experts,which were 2 564,2 346 and 2 073 kg ha–1,respectively. Moreover,with the covering range of each yield level,the suveyed farmers belonging to each yield level were grouped together and then their major cultivation measures were traced and generalized. With the generalized cultivation measures,representative maize populations of the four yield levels were reconstructed,and thereby clarifing lots of characters of the populations or single plant of each population with processbased analysis of the reconstructed populations. In this case,the main factors causing the yield gap were plant density,fertilizer application rate,logging caused by hurricane,and damages caused by pests. The case study primarily indicated that this five-step method is feasible and effective in yield gap study,especially in smallholder farmers dominant regions.
Keywords:Jiangsu Province,maize,production investigation,yield level,yield gap
1.Introduction
The concept of yield gap was first proposed in 1981 (De Datta 1981),and it was later refined by many scholars.Normally,it can be divided into five yield levels as lighttemperature potential yield,record highest yield (RY),highyield farmer yield (HY),average farmer yield (FY),and basic yield (BY) (De Bie 2000; Lobellet al.2006; Liet al.2010;Liu 2013). In the last 20 years,great progress has been achieved in the theory of yield gap but advances in applying yield gap theory in narrowing yield gaps in crop production were quite less (Menget al.2013; Yang and Liu 2014;Liuet al.2015). Thus,the next works in this area should strengthen the integration of theory research with finding effective cultivation measures which could substantially narrow yield gaps and enhance crop yield.
In the northern region of China,there were some similar studies based on large scale. Zhaoet al.(2016) quantified yield gaps of winter wheat/summer maize and yield limiting factors based on years of farmer survey. Then,the high yield and high efficient technologies under conventional farming were optimized and established through the multiyear comparative experiments of farmers on the same field.Caoet al.(2019) obtained information of wheat cultivation managements of wheat cultivation and yield data of small farmers through monitoring,and analyzed yield gap and the contribution of yield components by Path analysis. There were many other studies that determined the limiting factors by simply analyzing the data of the farmer survey,and some were determined with the help of models which had not been well verified.
Most current reports of yield gaps were concentrated on large-scale areas dominant with largeholder farmers,and few were on middle-scale regions dominant with small holder farmers. Moreover,extensive studies had been conducted on maize yield and yield gaps in national and regional scales (Yanget al.2014; Liuet al.2015).Within a large-scale region,it is really difficult to figure out valuable comprehensive means to narrow yield gaps as climatic conditions,economic conditions and cultivation measurements vary greatly (Chenet al.2008). Within a middle-scale region,it may be also difficult to figure out feasible technical solutions that could substantially narrow yield gaps even the climate and economic conditions insides are very similar. The main difficulty is that if the area is dominant with smallholder farmers,it is very hard to figure out the real yield gaps and the yield gap causing because of their ever-changing cultivation measures and yield levels (Chenet al.2011; Shenet al.2013; Huanget al.2015).
In south maize production areas of China,such as Jiangsu,Hunan and Sichuan provinces,most maize planting patterns are small householder farmers (Brouder and Gomez-Macpherson 2014; Amaralet al.2015). In many cases,even the farmers are in a same ecological region,their yields vary greatly because of diverse cropping systems,cultivars,sowing dates,various nutrient managements,and crop protections (Godfrayet al.2010;Grassiniet al.2011; Renet al.2017). As maize is also a very important crop in these regions,it’s very necessary to clarify the yield gaps and to work out practical solutions for narrowing the gaps.
Thus,the objective of this study is to work out a method that can effectively clarify the yield gap and the analysisi of yield gap in the maize production region of Jiangsu Province,which is dominanted by smallholder farmers. We hope the method could be used widely,or shed light on yield gap study in middle-scale areas that are dominanted by smallholder farmers.
2.Materials and methods
2.1.Study region
The main maize-producing area of Jiangsu Province was taken as the investigation area (Fig.1). It located in the lower reaches of the North Yangtze River Basin (30°45´–35°20´N and 116°18´–121°57´E),which lies in the central East China.The terrain,climate,precipitation,economy,and culture do not change very much in the study region.
2.2.Data sources
The data were collected from 14 counties,Dongtai,Dafeng,Xiangshui,Binhai,Xuyi,Shuyang,Sihong,Siyang,Guanyun,Donghai,Ganyu,Suining,Fengxian,and Pizhou,and the distribution of the survey area in Jiangsu Province(Fig.1). The survey included basic information of farmers and maize production information such as variety,yield,fertilization amount,planting method,and farming cost.The data cover during 2013–2017,and available data were imported to the National Crop Yield Gaps and Efficiency Gaps (http://101.200.124.93:9350/).
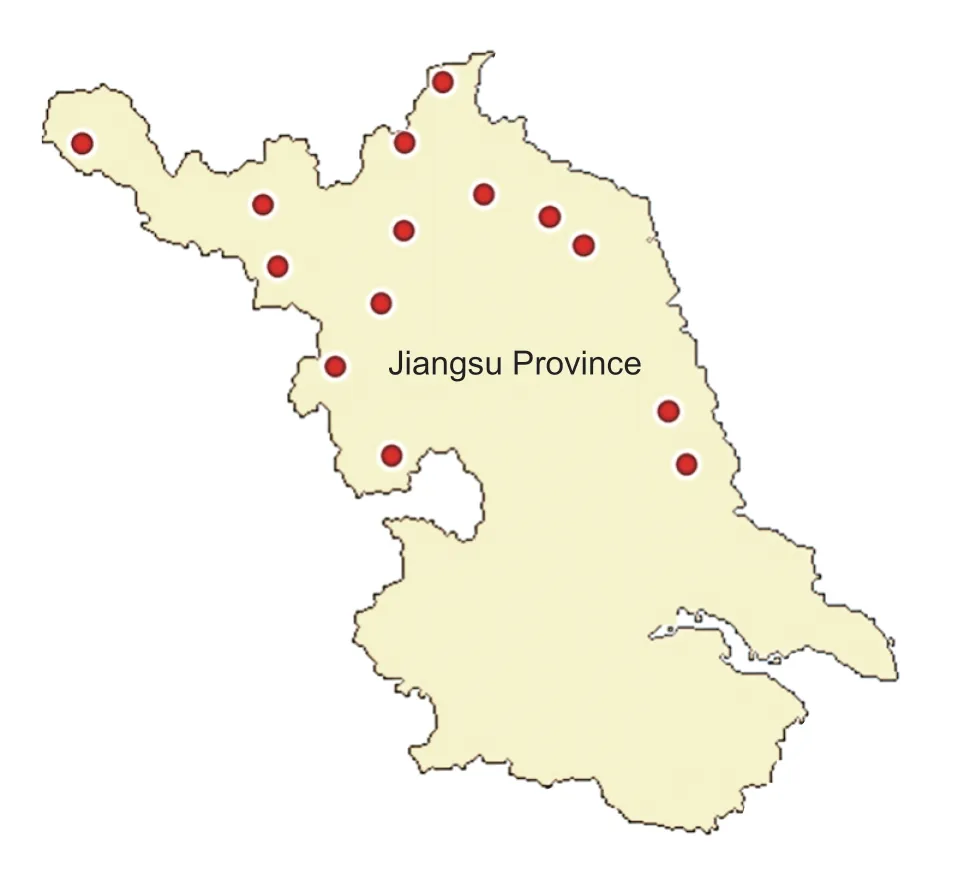
Fig.1 Location distribution of the questionnaire investigation.
The maize population reconstruction of four yield levels was carried out at Dafeng Experimental Station,Jiangsu,China (33°19´N,120°45´E) in 2017 and 2018,using widelyused cultivar Suyu 29 as experimental materials. The experimental soil is sandy loam. This test used a large area design with an area of 666.7 m2per plot. Pests and weeds control were carried out according to the recommendation of local agricultural bureau.
2.3.Yield levels and yield gaps calculating
Yield distribution simulatingBased on overall data brief analysis,the continuous yield distribution from 5 000 to 10 400 kg ha–1was phased into 108 yield level sections with intervals of 50 kg ha–1. And the farmers were grouped into appropriate level sections according to their yield level.Then,the calculated number of farmers in each yield level section was used as the normal distribution equation to simulate the frequency distribution.
Yield level calculationWith the simulated normal distribution equation,the three yield levels and their respective covering range were calculated. BY was defined and calculated as the average yield of the 5% farmers on the far-left side of normal distribution. FY was defined and calculated as the average yield of the middle 68.27% farmers of the normal distribution,as 68.27% is the integral sum from (μ–σ) to (μ+σ) on the normal distribution curve. HY was defined and calculated as the average yield of the 5%farmers yield on the far-right side of the distribution. The RY level was the highest yield recorded in Jiangsu Province.The RY was referred from experts and the local literature(Zhenget al.2018).
Yield gaps calculationWith the data of four yield levels,the yield gaps were calculated as follows:
Yield gap 1 (YG1)=FY–BY
Yield gap 2 (YG2)=HY–FY
Yield gap 3 (YG3)=RY–HY
2.4.Cultivation parameter generalization for maize populations of different yield levels
The information sheet of farmer investigation was grouped into three groups as BY,FY and HY according to the identified range of each yield level by Section 2.3.And the key cultivation parameters under the regional environment condition were nailed down by consulting the local agronomic technicians or experts. Then in light of the investigation sheet of each group,the values of the cultivation parameters of each group were worked out.
In addition,based on the yield and its corresponding fertilizer application rate in the database,the yield change curve functioning by N application was simulated. With the simulated equation,yield,per-unit fertilizer productivity,and marginal per-unit fertilizer productivity could be retrieved,calculated or deduced at every given fertilizer application rate.Conversely,the theoretical fertilizer application rate at a given yield level could also be retrieved from the simulated curve.
Yield=Grain output per unit area
Per-unit fertilizer productivity=Grain output per unit area/Fertilizer input per unit area
Marginal per unit fertilizer productivity=Per unit fertilizer productivity at N rate–Per unit fertilizer productivity at (n+1)rate
2.5.Reconstruction of the maize populations
A search site was selected that can represent the regional ecological environment. And the maize population was constructed according to the cultivation parameters or measures for each yield maize population that worked out in Section 2.4.
2.6.Data analysis tools
The data were processed by Microsoft Excel 2016,the data map was drawn using Origin 2015 and the statistical analysis was performed using SPSS 22.0 version software.
3.Results
3.1.Frequency and covering range analysis of yield distribution
The average yield of the small householder farmers showed a trend of increasing year by year (Table 1). From the overall yield distribution,the proportion of farmers in the section of 6 001–7 500 kg ha–1was the largest,followed by those in the section of 7 501–9 000 kg ha–1. And the proportion of farmers in the section of 7 501–9 000 kg ha–1and >9 000 kg ha–1showed an increasing trend,indicating that the farmers yield was gradually increasing from 2013 to 2017 in Jiangsu Province.
The frequency of smallholder farmers yield followed a normal distribution ofX~N(7 617,1 379 923) by whichμ=7 617 andσ=1 175 (Fig.2). After normalized the distribution tou~N(0,1) byu=(X–μ)/σ,by citing the cumulative normal distributionFN(y) value,the theoretical yield covering range of each yield level could be calculated according to its coverage definitions on the normalized distribution. The theoretical yield coverage range of BY,FY and HY was <5 700,6 450–8 775 and >9 600 kg ha–1(Figs.2 and 3).
3.2.Yield values and yield gaps of the three levels
With the covering range of the three yield levels,yield value of the farmers in each yield scope was traced back and calculated. The BY,FY and HY were 5 017,7 581 and 9 927 kg ha–1,respectively (Fig.3). RY was 12 000 kg ha–1(Fig.3). And consequently,the yield gaps between BY and FY (gap 1), FY and HY (gap 2),HY and RY (gap 3) were 1 256,2 346,2 346 kg ha–1,respectively.
3.3.Planting density generalization of each yield level of maize population
The theoretical maize planting density of each yield level was calculated by averaging the planting density values of the farmers traced back from each yield level scope. The average planting densities of BY,FY,HY,and RY were 52 185,59 160,67 425,and 75 000 plants ha–1,respectively(Fig.4).
3.4.Nitrogen efficiency gaps between different yield level populations
As the application rate of nitrogen increased,the nitrogen marginal per-unit productivity firstly increased in a short range and then slowly decreased toward zero (Fig.5;Table 2). The increasing speed of grain output gradually decreased,as the marginal per-unit productivity declined towards zero as nitrogen increased. The nitrogen per-unit productivity (kg kg–1N) decreased fast as the nitrogen application increased (Fig.5).
With the dynamic curve of the grain output,per-unit productivity and marginal per unit productivity that functioned by N application rate,the nitrogen efficiency of the BY,FY and HY were retrieved respectively from the curve according to the nitrogen application rate. The nitrogen application amount of BY and FY was 88.6 and 317.0 kg ha–1,respectively.
The nitrogen marginal per unit productivity of HY and RY all tended to zero (Table 2). The per-unit productivity gap between BY and FY was 32.71 kg kg–1,and the nitrogen marginal per-unit productivity gap was 3.74 kgkg–1. The per-unit productivity gap between FY and HY was 16.37 kg kg–1,and the nitrogen marginal per-unit productivity gap was 8.90 kg kg–1.
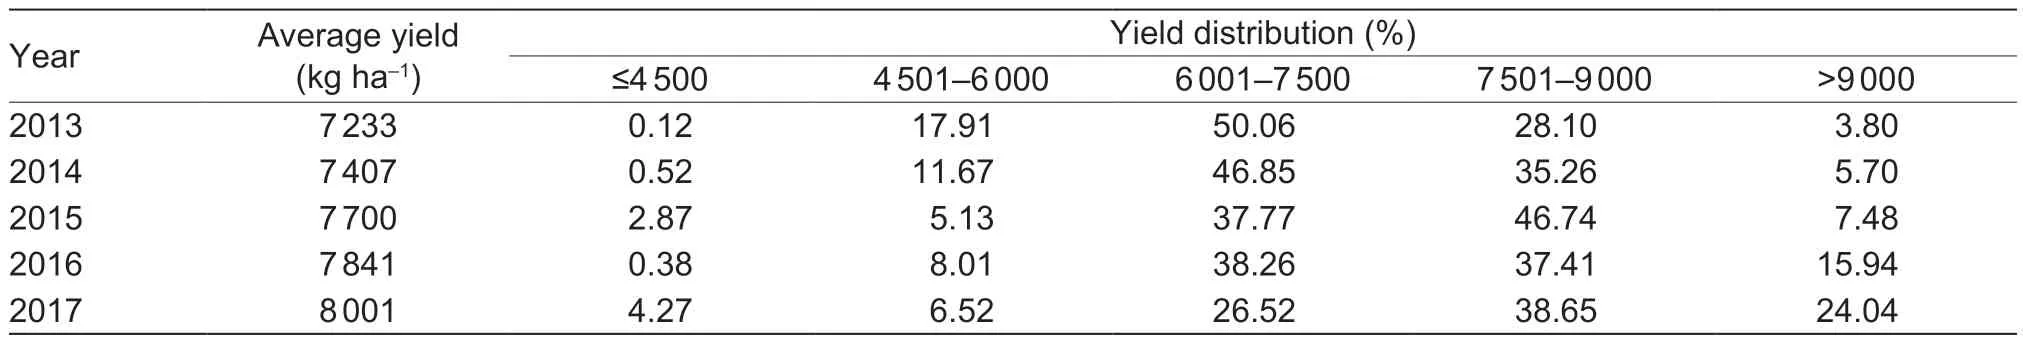
Table 1 Maize yield level distribution (2013–2017)
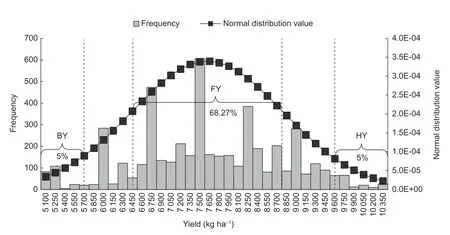
Fig.2 Farmers’ maize yield distribution in Jiangsu Province,China and its simulated normal distribution curve. BY,basic yield;FY,farmer yield; HY,high-yield farmer yield.

Fig.3 Farmers’ maize yield,theoretical yield levels and yield gaps of Jiangsu Province,China. I,theoretical basic yield; II,theoretical farmer yield; III,theoretical high-yield farmer yield;IV,record highest yield.
3.5.Generalization of key cultivation measures of different yield level populations
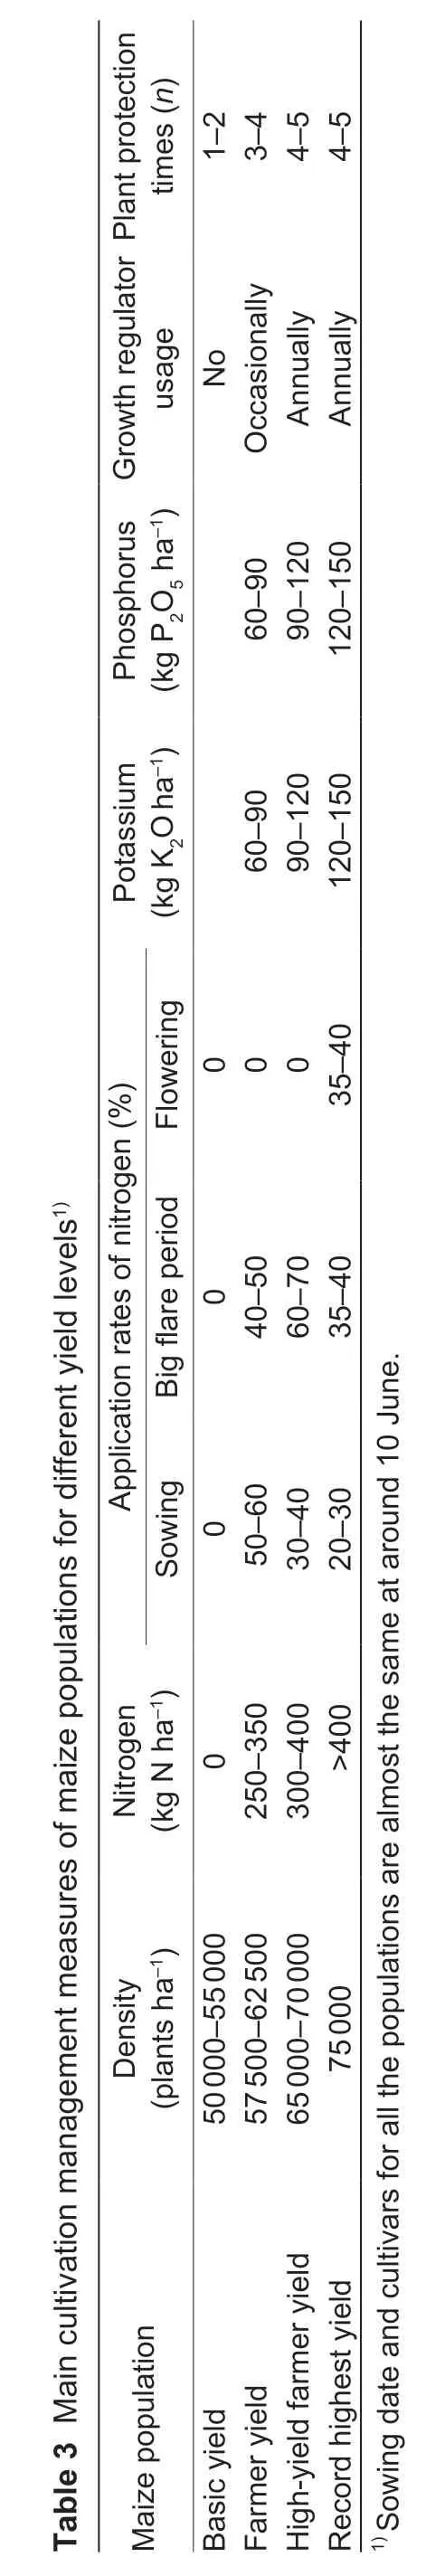
By tracing back the survey data,consulting the local agronomic technicians or experts and reviewing local production literature,the general cultivation measures of different yield level populations and the dominant differences were worked out (Table 3). The dominant differences between yield levels were planting density,fertilizer application rate and fertilizer application manner.And difference of nitrogen application rate and application manner was the dominant factor among the three majority fertilizers. Phosphate and potash fertilizer were generally applied as base fertilizer. Whether use growth regulators and the number of plant protections were also different at the three yield level populations (Table 3). And growth regulators application and 3–5 times pest control are the general cultivation measures of high-yield level farmers (Table 3).

Fig.4 Planting density of maize populations for different yield levels.
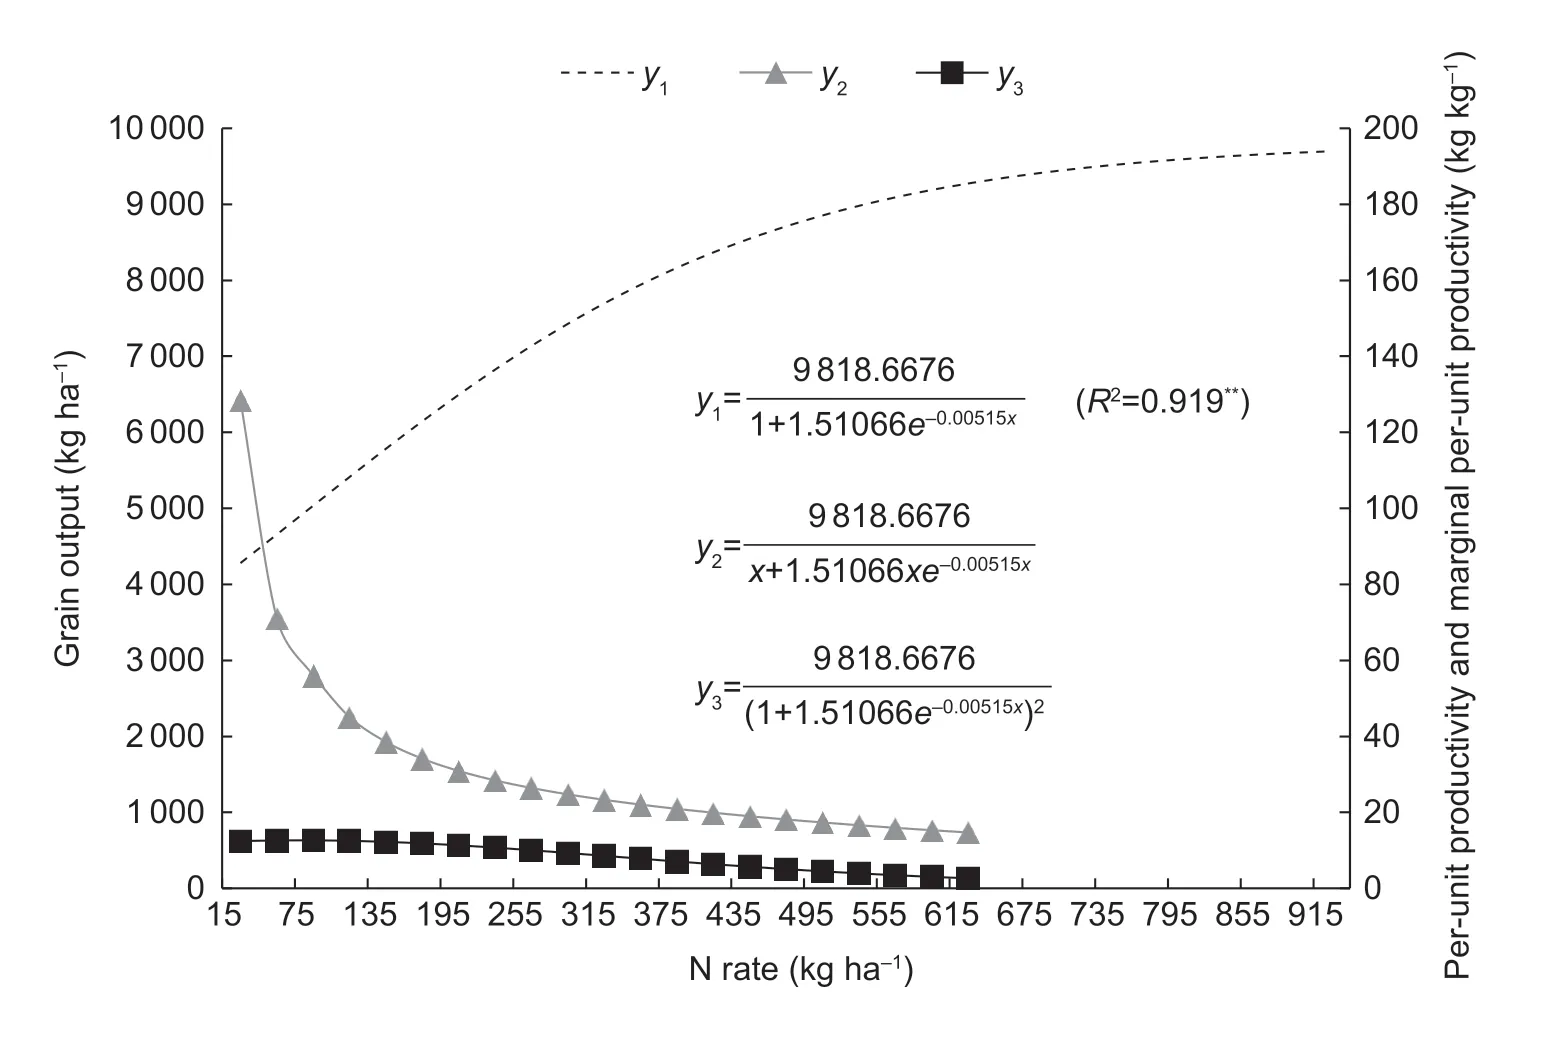
Fig.5 Nitrogen (N) efficiency changes with N application rate variation. y1,grain output; y2,per unit productivity; y3,marginal per unit. **,significant difference at 0.01 probability level.
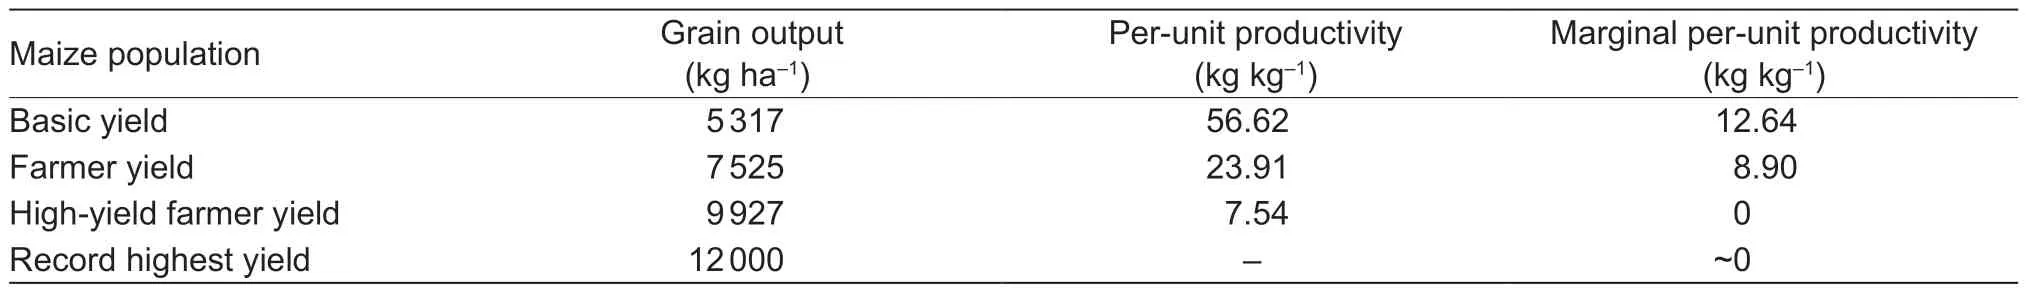
Table 2 Nitrogen efficiency of different yield levels in Jiangsu Province,China
3.6.Comparison of the parameters between the generalized populations and the re-constructed populations
Analysis of yield gap is a key point in yield gap researches,while in smallholder farmer dominant region it is also a difficult point. With the key cultivation measures of different yield level populations worked out in Section 3.4 and with some necessary adjustment,representative maize populations were re-constructed in our research stations (Table 4). The plants within a population were very consistent and the differences between populations were significant (Fig.6). Above all,the yield of the re-constructed population matched the objective yield of the four yield levels (Table 5). In other words,the re-constructed maize populations have reached their goal,which is helpful to study the yield gap of small farmers and analyze the causes of the yield gap.
4.Discussion
Normally,maize yield gap studies usually apply the Agricultural Production System Simulation Model (APSIMmaize) to calculate the yield gaps (Wanget al.2007; Liuet al.2012). The mathematical operations of the model are based on meteorological data,agro-meteorological observations and agricultural statistical data,which are very abstracted to be understood and optimized according to the characteristics of a place. The model is suitable for yield gap analyse in many scenarios of large-scale region,but it is not good at generalizing representative measures for each yield level in a selected agro-climatic zone. However,for a given middle scale region,the yield difference or yield gap is usually caused by cultivation management measures (Li and Wanget al.2016). The advantage of the method we proposed in this research is that the concept of survey and statistical analysis is simple and easy to be operated,it is more suitable for yield gap study in middle-scale regions or regions dominanted by smallholder farmers.
4.1.Method for yield gap analysis in smallholder farmers dominant regions
In most south regions of China,smallholder farmers do not have a definite cultivation scheme,their cultivation measures change from one to another farmer,as well as their yield (Li and Li 2015). So,in smallholder farmers dominant region,yield gap study and yield gap narrowing practice are more complicated than that in regions dominanted by large farmers. It is hard to distinguish HY from FY. Therefore,to narrow yield gaps in crop production practice in smallholder farmers dominant region,the primary problem to be solved is to clarify who should virtually increase their yield,what is their target yield and what cultivation scheme they should apply. Thus,in our study,we tried to solve the problem.
In our study,we proposed a method special for yield gap study in regions dominanted by smallholder farmers. The method includes five steps as:questionnaire investigation of farmer cultivation regime,yield levels and yield gaps identification,key cultivation measurements generalization,representative maize populations reconstruction,and process-based yield gap causing analysis.
The method proposed in this research is a sort of participatory evaluation method (Huet al.2004; Wang and Li 2010; Yanget al.2014). Its advantage is very closer to crop production than general large-scale yield studies.It can clarify what farmers should virtually increase their yield (farmers whose yield was covered by the range of the defined average farmers yield level),what is their target yield (the average level of the defined high-yield farmers)and what cultivation measurements they should apply (the cultivation measurements generalized from the defined high-yield farmers). While general methods are usually focused in theoretical yield level and yield gap analysis,and they pay much less attention on finding practical and technical cultivation measures to narrow yield gap in crop production practice.

4.2.Determination of yield levels
Our definitions of yield levels were carried combinedly followed some former studies (Aggarwalet al.2008; Tittonellet al.2008; Lobellet al.2009; Ittersumet al.2013). The high-yield farmer was defined as those whose yield was in the top 5% of the yield distribution,and HY was the average value of the yield of the top 5% farmers. And correspondingly,BY was defined and calculated as the average yield of the 5% farmers on the far-left side of normal distribution.In previous studies,some farmer yield level data were derived from statistical yearbooks (Liuet al.2017),while others came from farmer survey,but they screened out low-yield farmer yield and HY without sufficient basis,and the average farmer yield was simply the mean yield of the remaining farmer yield (Huanget al.2016;Zhaoet al.2016). An important difference between this study and most former studies is that in this research,the average farmer was defined as those whose yield level was in the middle 68.27%farmers of the normal distribution and the average farmer yield level was the average value of the middle 68.27% farmers,which is quite different from other reports of yield gap studies. The key point is why 68.27% was chosen as the criterion? It is because in statistics the integration from (μ–σ) to (μ+σ) on the normal distribution curve is 68.27%,so the farmers in this section are statistically the most representative farmers. Therefore,it is reasonable to define the average yield value of the middle 68.27% farmers as the farmer yield level,especially in smallholder farmer dominant regions. This makes the value range of the average farmer yield level in the survey data of the entire farm household more statistically significant,and makes the whole method more scientific.
4.3.Reconstruction of the four yield level populations
Another difference between our method and former yield gap studies is that this method payed plenty attention on the steps of reconstruction of the representative populations,questionnaire investigation,identification of yield levels and generalization of cultivation measurement were all carried for the representative populations’ reconstruction. Well generalized cultivation measures are the premise to well reconstruct the populations,but in many of former studies,insufficient attention has been paid on generalization of key cultivation measurements and representative populations reconstruction. Thus,with the re-constructed populations,processbased yield gaps analysis could be carried out and detailed difference of population traits or plant traits,such as yield components,plant development dynamics,single plant characters between the four yield level maize populations could be studied carefully. And hereby,the yield gaps analysis and methods to narrow yield gaps could be easily worked out. And in regions dominanted by smallholder farmers,the generalization process is really a technical and timeconsuming step,this should also be concerned.
Moreover,in order to ensure the effectiveness of this series of methods in the “representative population reconstruction” step,the key was that the characteristics of the reconstructed population must be consistent with the target population.Therefore,in this study,we consulted the local agronomic technicians or experts and reviewing local production literature by tracing back the survey data to determine cultivation measures for different yield level populations.Based on these,representative population reconstruction was conducted to ensure that the characteristics of the reconstructed population were consistent with the target populations,and the final yield of the reconstructed populations also met the target yield. The case study was carried out with the data of maize cultivation from Jiangsu Province,which is one of the main grains producing areas in China (Sheet al.2016). It is comparatively a welldeveloped region and grain output in the area has not been increase significantly for couple of years. One important and widely accepted explanation is that it is a smallholder farmer dominant region and there are hundreds of cultivation models,so farmers usually do not know whether their cultivation measures are virtually different from others and which cultivation models they should follow to increase grain yield. The development of crop science in recent years indicated that yield gap theory may provide tools to achieve breakthrough of grain production in this area (Lobellet al.2009; Ittersumet al.2013). And our method in this research can provide ideas to develop feasible way to further increase grain yield in smallholder farmer dominant regions.
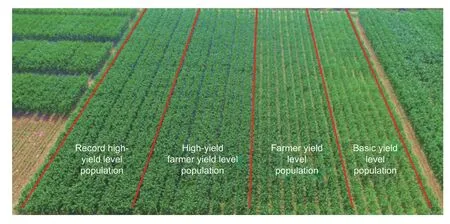
Fig.6 Canopy comparison of the re-constructed populations of different yield levels.

Table 5 Major characters of the re-constructed populations at physiological maturity stage1)
5.Conclusion
In the regions dominanted by smallholder farmers,yield gap study is more complicated than those dominanted by largeholder farmers. The primary difficulty in gaps causing analysis is to work out the yield levels and generalize their respective cultivation measures. The five-step method (farmer cultivation regime investigation,yield levels clarification,representative cultivation measures generalization,maize populations reconstruction,processbased yield and efficiency gaps causing analysis) proposed in this study may be an effective solution for yield gaps causing analysis in smallholder farmer dominant region.
Case study of smallholder farmers in Jiangsu Province indicated that,the yield gaps between BY and FY,FY and HY,HY and the record high yield were 2 564,2 346 and 2 073 kg ha–1,repectively. The main factors that caused the yield gap were plant density,fertilizer application rate,loggings caused by hurricanes and damages caused by pests. The density for high-yield and high-efficiency maize population range from 65 000 to 70 000 plants ha–1,and the nitrogen application rate range is 300–400 kg ha–1. Growth regulators application and 3–5 times pest control are general cultivation measures of high-yield level farmers.
Acknowledgements
This work was funded by the National Key Research and Development Program of China (2016YFD0300109).
杂志排行
Journal of Integrative Agriculture的其它文章
- Closing crop yield and efficiency gaps for food security and sustainable agriculture
- lmproving maize grain yield by formulating plant growth regulator strategies in North China
- lmproving winter wheat grain yield and water-/nitrogen-use efficiency by optimizing the micro-sprinkling irrigation amount and nitrogen application rate
- Effects of deep vertical rotary tillage on the grain yield and resource use efficiency of winter wheat in the Huang-Huai-Hai Plain of China
- Effects of mechanized deep placement of nitrogen fertilizer rate and type on rice yield and nitrogen use efficiency in Chuanxi Plain,China
- lmproving grain yield,nitrogen use efficiency and radiation use efficiency by dense planting,with delayed and reduced nitrogen application,in double cropping rice in South China