Powerful quantifiers for cancer transcriptomics
2021-01-14DumitruAndreiIacobas
Dumitru Andrei Iacobas
Dumitru Andrei Iacobas, Personalized Genomics Laboratory, CRI Center for Computational Systems Biology, Roy G Perry College of Engineering, Prairie View A&M University, Prairie View, TX 77446, United States
Abstract Every day, investigators find a new link between a form of cancer and a particular alteration in the sequence or/and expression level of a key gene, awarding this gene the title of “biomarker”. The clinician may choose from numerous available panels to assess the type of cancer based on the mutation or expression regulation(“transcriptomic signature”) of “driver” genes. However, cancer is not a “onegene show” and, together with the alleged biomarker, hundreds other genes are found as mutated or/and regulated in cancer samples. Regardless of the platform,a well-designed transcriptomic study produces three independent features for each gene: Average expression level, expression variability and coordination with expression of each other gene. While the average expression level is used in all studies to identify what genes were up-/down-regulated or turn on/off, the other two features are unfairly ignored. We use all three features to quantify the transcriptomic change during the progression of the disease and recovery in response to a treatment. Data from our published microarray experiments on cancer nodules and surrounding normal tissue from surgically removed tumors prove that the transcriptomic topologies are not only different in histopathologically distinct regions of a tumor but also dynamic and unique for each human being. We show also that the most influential genes in cancer nodules[the Gene Master Regulators (GMRs)] are significantly less influential in the normal tissue. As such, “smart” manipulation of the cancer GMRs expression may selectively kill cancer cells with little consequences on the normal ones. Therefore,we strongly recommend a really personalized approach of cancer medicine and present the experimental procedure and the mathematical algorithm to identify the most legitimate targets (GMRs) for gene therapy.
Key Words: Cancer biomarkers; Cancer nodule; Gene therapy; Kidney cancer; Prostate cancer; RNA gene; Thyroid cancer
INTRODUCTION
According to the 22.0 release of the NIH National Cancer Institute Genomic Data Commons Data Portal[1]on July 5, 2020 there are now 3142246 certified mutations detected all over the 22872 genes sequenced from 84031 cases of cancers localized in 67 primary sites. In addition to the millions of mutations, the “transcriptomic signatures”of thousands of genes involved in various forms of cancer were published since the first “cDNA microarray analysis of gene expression patterns in human cancer”[2]. Most of these transcriptomic signatures resulted from meta-analyses of microarray or next generation RNA-sequencing data[3-6]whose purpose was to reduce the number of cancer-associated genes to the most frequently altered in large populations of cancer patients.
All high throughput transcriptomic studies that compared gene expression levels in cancer nodules and normal surrounding tissues of the same subject reported hundreds of significantly regulated genes[7-10]in no exactly repeatable combination in any other human. As illustrated below for two cases of prostate cancer with the same phenotype,not only the gene expression profiles but also the transcriptome topological structure differs from person to person. This observation indicates that multiple transcriptomes can be associated to the same phenotype (transcriptomic entropy), raising serious doubts about the existence of a single common genomic cause for all patients affected by the same form of cancer. Also, the possibility of a single gene therapy good for everybody looks like an impossible wish.
In this Review, we show that the overall transcriptomic variability is the largest for normal (healthy states) and it decreases when the disease aggravates. On several animal models of human diseases we found that the expression variation decreases with the progression of the sickness but increases back in response to an adequate treatment. Alteration of gene networking, higher in later stages of the disorder, also decreases after treatment. Therefore, beyond improving the characterization of individual genes, we have introduced holistic features that can better characterize the cancer-associated transcriptomic alterations.
The large numbers of gene mutations and regulations in cancer[11-13]makes it impossible to assess predictive values to all their possible combinations for the number of these combinations exceeds by far the estimated number of atoms in the Universe(approximately 1078-82). For instance, there are over 10272distinct combinations of 100 regulated out of 20000 genes, number that should be multiplied by 1.27 × 1030possibilities of the 100 genes to be up-/down-regulated. If one restricts the number of candidate genes to only 776 as in the Nanostring panel that claims to identify the subtype across 23 key breast cancer pathways[14], there are still 2.1 × 1025possible combinations of 10 genes whose up-/down-regulation is specified. Yet, clinicians recognize that such panels do not contain enough genes to cover more than 5%-10% of cases[15]. There are also platforms where one can compare the gene expression levels from surgically removed tumors with documented cancer samples[16]. How the developers of these platforms have determined the predictive values of the test results is still a mystery.
In mathematically rigorous studies, the biomarkers are determined from highthroughput omics datasets with the Principal Component Analysis[17]as metagenes that encompass the largest variability across several conditions. Because the metagene,as a mathematical object without a well-defined molecular correspondent, is not an intuitive concept, in the vast majority of studies, the biomarkers are selected from the most frequently altered genes in cancer populations with respect to healthy counterparts.
It is natural to assume that a cell invests energy to protect the sequence and/or expression level of a gene proportional to the importance of that gene for the phenotypic expression, survival and/or integration into multicellular structures.Hence, because of their frequent alteration, the biomarkers appear to be less protected than other genes as are the low players in cell life suggesting that restoration of their normal sequence or/and expression level may be of little consequence. Thus, although cancer biomarkers may be useful for diagnostic purposes, they appear worthless for therapeutic purposes.
As proved in numerous studies, a major problem in the transcriptomic signature is that the expression profile is modulated by factors such as: Genetic background[18],sex[19], age[20], medical history[21], hormonal activity[22], diet[23], cellular environment[24],exposure to toxins[25], hypoxia[26], life style[27]etc. Owing to the unique combination and fluctuations of such factors, although a trained pathologist can identify common phenotypes, each human has a unique transcriptome whose features and dynamics are never exactly repeated in another human being. Therefore, it is imperative to develop adequate procedures and resources by which to tailor a really personalized[28]and time-sensitive cancer gene therapy for each patient, building on the successes of the combined therapies[29]and matched targeted therapy[15,30,31].
Because, as any other disease, cancer is not a “one-gene show”, instead of the regulation of individual gene biomarkers, one may characterize the cancer transcriptome from the holistic perspective of the Genomic Fabric Paradigm[32]. The genomic fabric of a functional pathway was defined as the “transcriptome associated to the most interconnected and stably-expressed gene network responsible for the pathway”. The paradigm was successfully used to quantify the transcriptomic alterations occurring in some chronic diseases[33-37]and efficacy of certain treatments[33,36].
The genes responsible for the analyzed functional pathways were selected from Kyoto Encyclopedia for Genes and Genomes (KEGG)[37]. However, KEGG, as any other specialized software (DAVID[38], Ingenuity[39], GeneMAPP[40]etc.) to ensemble genes into functional pathways, is a text miner from trustable peer-reviewed publications that explores gene and protein expression profiles. Although species-dependent, their pathways are universal (identical regardless of the tissue, race/strain, sex, age,environment,etc.), unique (no alternative wirings of the same genes) and rigid (no remodeling during ageing, progression of a disease or in response to a treatment).
Since chemical elements like carbon and hydrogen can combine in so many ways to form alkanes, how to accept that much more and many more complex units (genes,proteins) will always combine the same way? And how to conceive that while the distribution of alkane types adjusts with changes in pressure and temperature, the gene networks do not change when the environment is modified beyond critical limits? Therefore, we have generalized Dalton’s Law of Multiple Proportions[41],assuming that genes encoding functionally related products are coordinately expressed to respect a kind of “transcriptomic stoichiometry”[42]. If true, the significant expression coordination of two genes most likely indicates their interaction within a functional pathway. In contrast, their significant independent expression indicates that the paired genes are not functionally related, or, very unlikely that their synergistic expression in a part of the tissue is fully compensated by their antagonistic expression in other part.
Here, we consider the transcriptome as composed of partially overlapping multidimensional dynamic genomic fabrics whose topology and interplay remodels during ageing and progression of a disease but may recover in response to a well guided therapy. In this view, each biological functional pathway is the result of several gene networks (distinct wirings) expressed simultaneously. The distribution of the gene networks associated to a particular functional pathway depends on tissue, race/strain,sex, age, environment, and changes during ageing, progression of a disease or in response to a treatment
This Review presents the experimental requirements, strategies, quantifiers and analytical tools to characterize and quantify the cancer transcriptome and identify the most legitimate targets for gene therapy.
CANCER SAMPLES
Population meta-analysis or patient-oriented comparisons?
Most transcriptomic studies compare the average gene expression profiles in cancer patients with corresponding values in tissues from (not always demographically matched) healthy patients[43-45]. However, owing to the (mostly neglected albeit not always negligible) contributions of the influencing factors making each human unique,such very popular comparison in meta-analyses produces misleading results.
The best reference for the genomic alterations in solid tumors is the normal tissue adjacent to the cancer nodule as it became standard in several laboratories[46-49]. We used such reference when profiling surgically removed tumors from persons affected by clear cell renal cell carcinoma[7], papillary thyroid cancer[8]and prostate cancer[10]. In addition to providing much more accurate information, patient-oriented comparison is preferable because the therapy should restore what is normal for that person’s tissue and not for an imaginary human whose characteristics were obtained by averaging those of many healthy individuals. Moreover, very often the “standard human features” were not obtained from adequately demographically stratified population as race, sex, age and other important risk factors. In the case of leukemia, the best practice would be to sort out the normal and modified cells from the same blood sample,profile them separately and compare the results. Interesting methods have been also developed for circulating tumors[50].
Heterogeneous tissue or cell line?
Tissues are composed of several cell phenotypes whose gene expression profiles and susceptibility to alteration in disease may be largely different. The worst scenario for the genomist is when the up regulation of a key gene in some cells is balanced by the downregulation in others, so that the respective gene appears as unchanged. The traditional alternative to the heterogeneous tissue is to create, profile separately and compare immortalized cell lines from normal and cancer samples[51]. However,regardless of such advantages as low-cost and repeatability, the value of the immortalized cell lines for clinical research is limited due to significant genetic modifications undergone during passages[52]and immortalization procedure. Cell lines are usually developed from advanced cancer stages, unsuitable to understand cancer progression. Moreover, as proved by insert experiments, the cellular environment is a very strong modulator of the transcriptomeviamolecular factors (like cytokines,neurotransmittersetc.) released by the neighboring cells in the medium[24,53,54]. The transcriptome is also very sensitive to the direct intercellular communicationviagapjunction channels[55]as well as to local electrical stimulation[56]. Therefore, the investigator should isolate and quickly profile the most histo-pathologically homogeneous small regions of the tumor s/he can dissect. In spite of still unresolved technological and computational problems mainly related to the sparsity of transcripts quantified from different phenotypes, the most promising way to address tissue heterogeneity is the single-cell RNA-sequencing[57,58].
Patient Derived Xenograft animal models
By preserving the original cellular environment (at least for a while) when grown subcutaneously or orthotopically in an immune-deficient mouse, and then subcultured into new mice, the Patient Derived Xenograft (PDX) models look well-suited for cancer research[59]. Although expensive and time-consuming to generate, the PDX models have the undisputable advantage to allow large scale drug screening and coclinical trials. However, in time, the different hormones, diet and physiological constraints of the animal body take their toll, and the PDX not only loses some of the initial human features, but even the original human cells are gradually replaced by the cells of the host animal[60].
3D organoids
The 3D organoids, most frequently generated byin vitroself-organizing of pluripotent stem cells in three-dimensional culture to produce simplified versions of human organs[61], are excellent systems to study cancer development and test drug, radiation or gene therapies. 3D organoids are also suitable to studying the spatial interactions between cells of the same or different phenotype[62]. The cellular heterogeneity of the organoids can be explored using single-cell RNA sequencing[63]. Instead of primary cultures, some investigators try to create 3D organoids from cancer patient derived xenografts[52,60,64].
GENE EXPRESSION PROFILE
Biological and technical replicates
Transcriptomic results are affected by both technical noise of the method and natural variability of the specimens. Therefore, the experiments need to be repeated on both technical and biological replicates to determine the statistical relevance of their outcomes. Biological replicates could be the four quarters of a biopsy from a cancer nodule or the four dishes of the same cell culture, while technical replicates are obtained by profiling several times the same RNA extract. Expression differences among biological replicates encompass both biological variability and technical noise,while those in the technical replicates “see” only the technical noise. The technical noise in the microarray platforms can be also evaluated from the background subtracted fluorescence of the control spots when profiling biological replicates.
Four biological replicates are needed for the statistical significance of the results.While the traditional three biological replicates experiment provides acceptable estimate for the average expression level, it is not sensitive enough for the expression variation and much less for the expression coordination. However, more than four replicates are overkilling because the accuracy gain is overshadowed by the technical noise of the used platform as it can be determined by technical replicates.
Experimental data
The transcriptomic analyses and quantifiers presented here were applied to expression profiles generated by our group using Agilent G2519F whole (human, mouse, rat,rabbit, dog and chicken embryo) genome 4x44k two-color microarrays and our standard experimental protocol[35]. A transcript was considered quantifiable if its foreground fluorescence in the array was more than twice the background for its probing spot.
Data on human samples were obtained from Dr. Iacobas’ project approved by the New York Medical College’s and Westchester Medical Center Committees for Protection of Human Subjects L-11,376/2015. The Institutional Review Board approval granted access to frozen cancer specimens and depersonalized pathology reports,waiving patient’s informed consent. Expression data from surgically removed tumors are available from the https://www.ncbi.nlm.nih.gov/gds/?term=iacobas as GSE72304 (kidney cancer), GSE97001 (papillary thyroid cancer), and GSE133891 and GSE133906 (two cases of prostate cancer). The same website has also expression data for several human cell lines profiled also by us: 850c (anaplastic thyroid cancer), A549(alveolar basal epithelial adenocarcinoma), BCPAP (papillary thyroid cancer), DU145(metastatic to the brain androgen non responsive prostate cancer), HL-60 (acute promyelocytic leukemia) and LNCaP cells (prostate cancer androgen-sensitive adherent epithelial cells).
GSE72304 data that illustrate most of the analyses presented in this Review were obtained from the four frozen samples of a 74 years old man who died because of metastatic Fuhrman grade 3 clear cell renal cell carcinoma (CCRCC). From this patient,we profiled all four quarters from biopsies of a chest metastasis (MET) and two primary cancer nodules (PTA and PTB) from the right kidney. The gene expression profiles of the cancer samples were compared with that of the surrounding normal tissue (NOR) from the right kidney[7]. One purpose of this study was to check whether the gene networks depend on phenotype.
We have compared also the transcriptomes of the normal (N) surrounding tissues and the (Gleason score 4 + 5 = 9) cancer nodules (C) of surgically removed prostate tumors from a 47 years old white man (hereafter denoted as P1) and from a 65 years old black man (hereafter denoted as P2). The comparison aims to test whether the same phenotype in two persons is associated with identical transcriptomic alterations.
Independent features
Regardless of the used high-throughput platform (Affymetrix, bead chips,microarrays, RNAseqetc.), a well-conducted transcriptomic experiment with at least four biological replicas produces three independent features for every single quantified gene: Average expression level, expression variability and coordination with expression of each other gene. As numerically illustrated in a recent paper[65]and in Figure 1 below, the three features are as independent and complementary to each other as are the impressions of a blind person and of a deaf one in a movie theater.
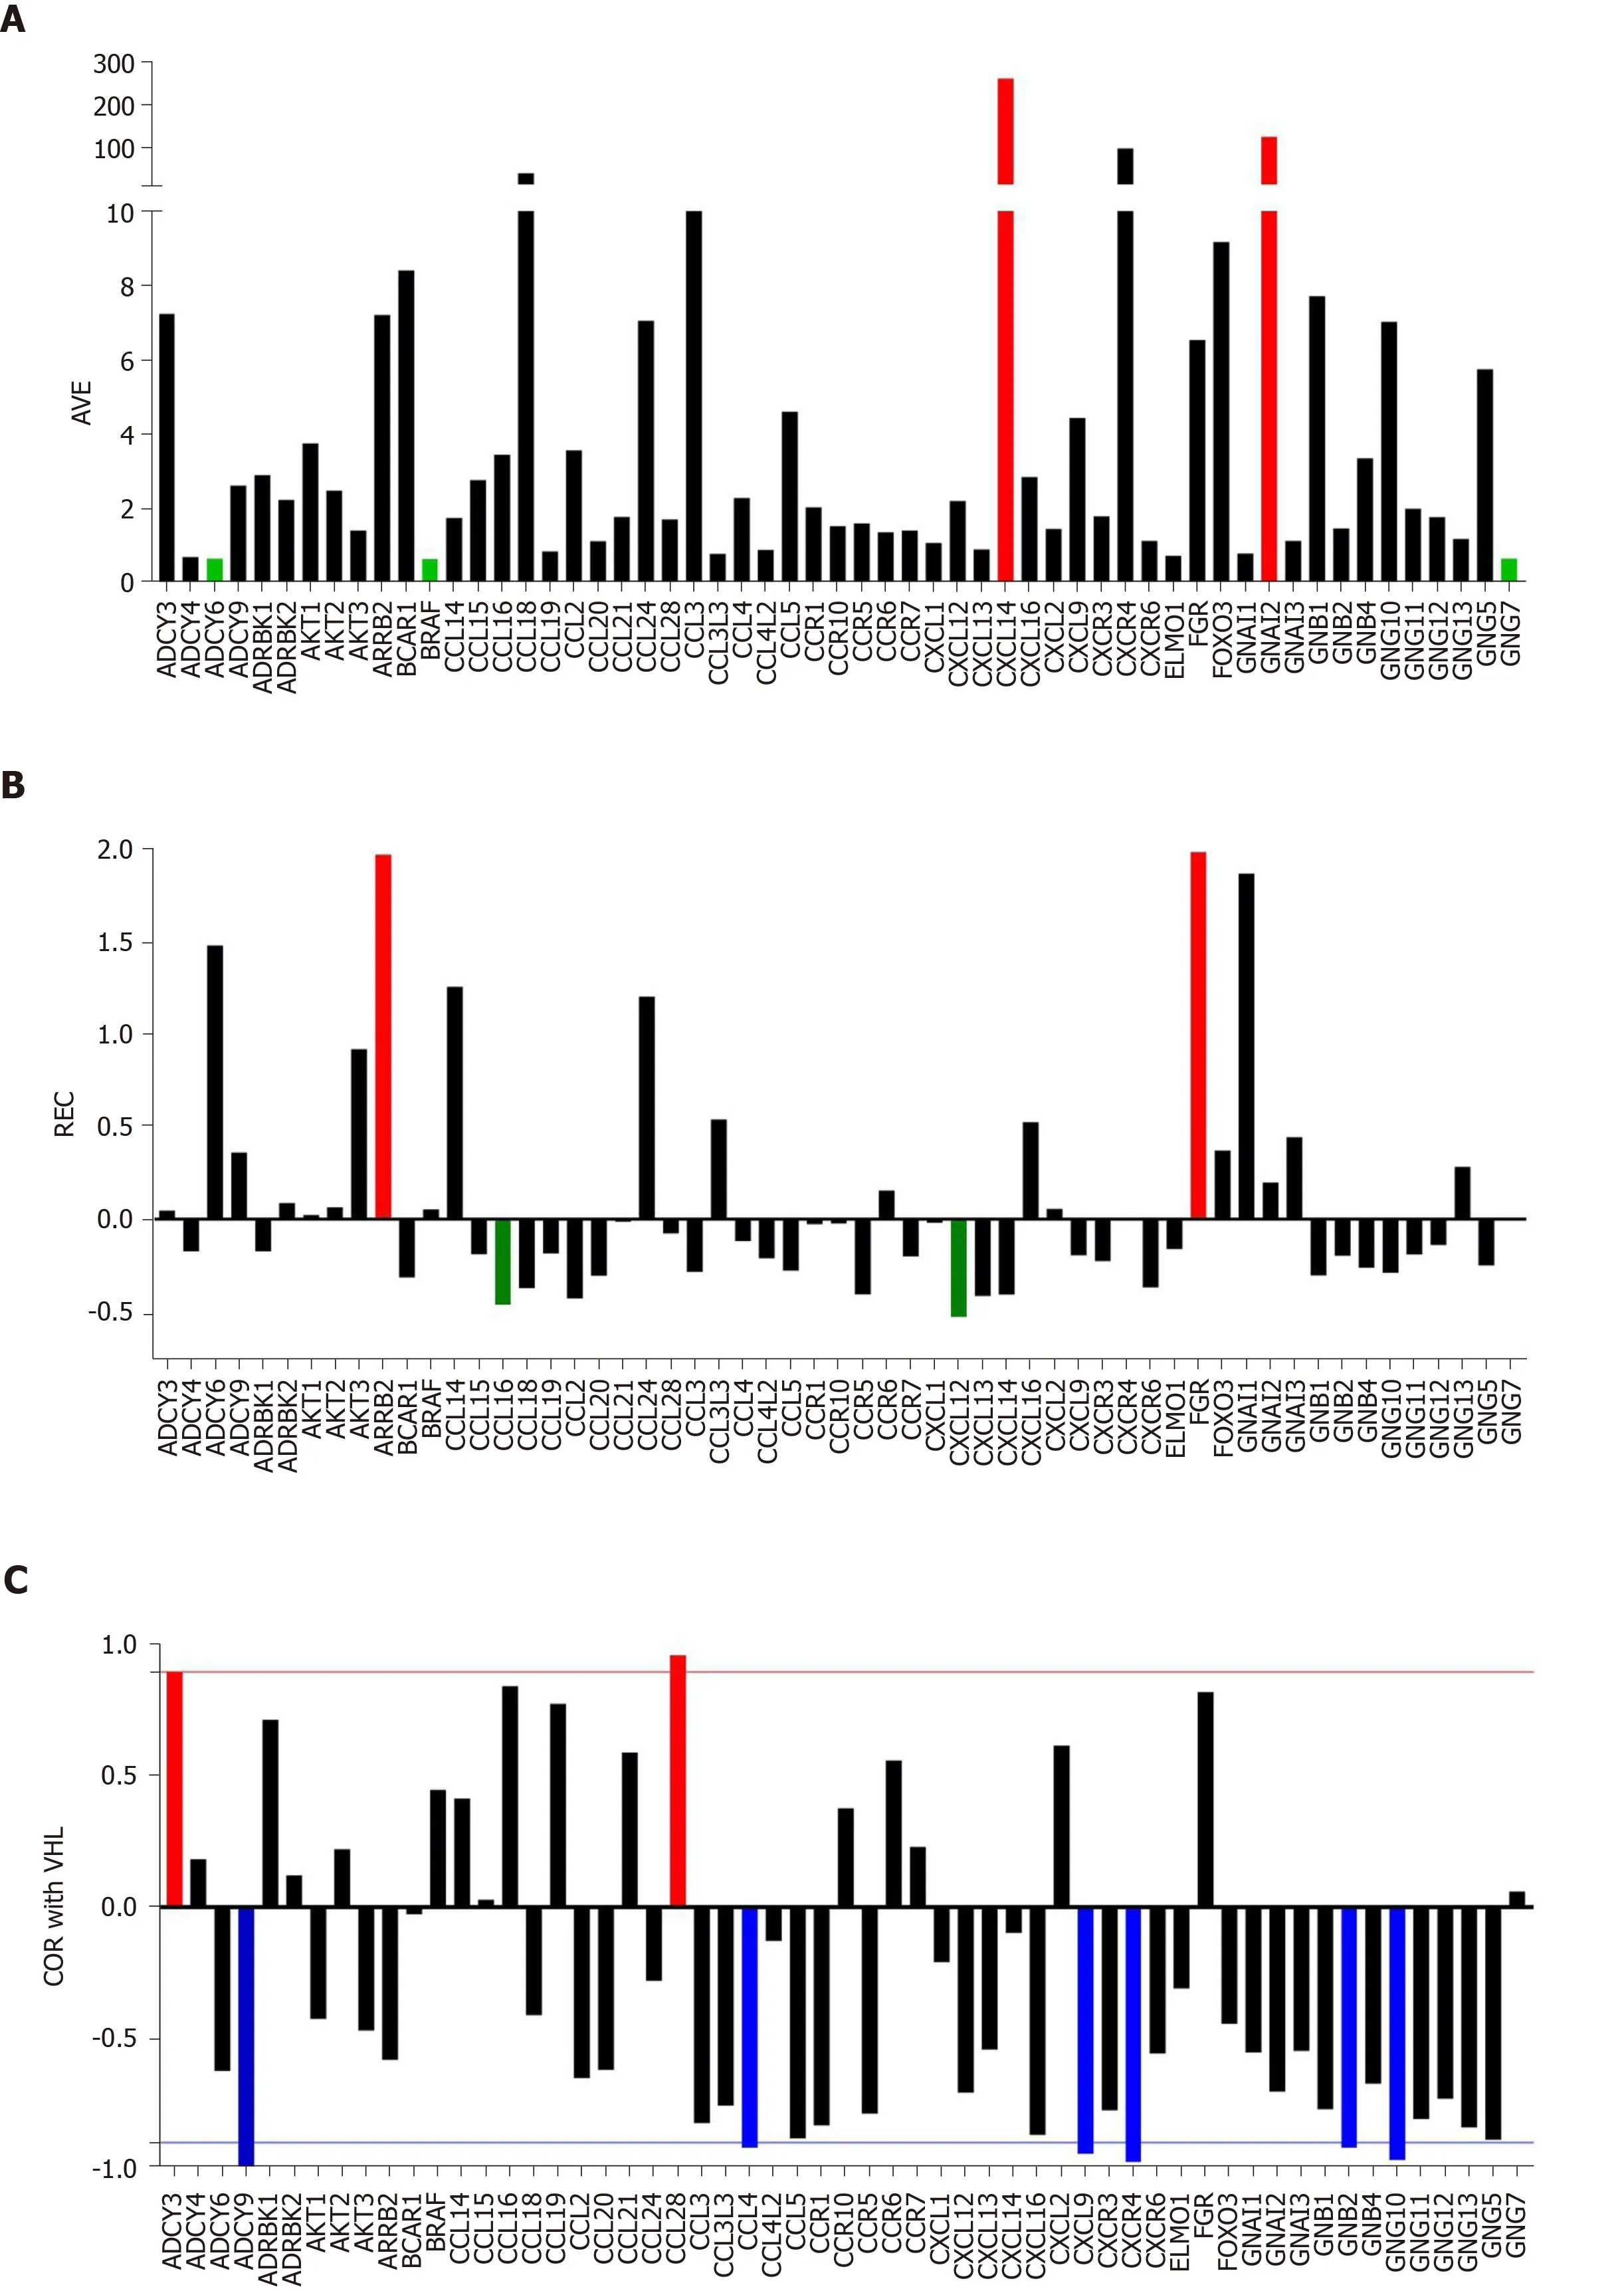
Figure 1 Individual gene quantifiers in the normal kidney tissue (NOR) from a 74-year-old clear cell renal cell carcinoma patient. A:Average expression levels of the first alphabetically ordered 60 genes involved in the chemokine signaling. Brown columns indicate the most highly expressed genes and the blue ones the least expressed genes; B: Relative expression variability of the first alphabetically ordered 60 genes involved in the chemokine signaling.Brown columns indicate the most controlled genes and the blue ones the least controlled genes; C: Pearson product-moment correlation coefficient (COR) of VHT with the first alphabetically ordered 60 genes involved in the chemokine signaling. Brown columns indicate the significantly synergistically expressed partners of VHL and the blue ones the significantly antagonistically expressed partners. Note the independence of the three features. COR: Pearson product-moment correlation coefficient of VHT; REV: Relative expression variability.
By comparing the average expression levels in the cancer nodule and surrounding normal tissue), we find what gene was up-/down-regulated or turned on/off by cancer. While the average expression level is used in all studies, the other two characteristics are unfairly neglected although they provide extremely useful complementary information that cannot be obtained from other sources. The expression variability provides an estimate of the control of transcript abundance(essential to determine what genes are critical for the phenotypic expression) and the expression coordination indicates how the genes are networked in functional pathways.
The investigator can combine the independent features from one or more conditions(e.g., normal tissue w/o treatment and/or cancer nodule w/o treatment) in several ways to get additional characterizations of both individual genes and functionally related groups of genes. In this review, in addition to derived measures to strength the genes transcriptomic features like: Weighted Individual (gene) Regulation (WIR),Weighted Pathway Regulation, we present also the composite measures: Pair-Wise Relevance (PWR) and Gene Commanding Height (GCH).
QUANTIFIERS OF INDIVIDUAL GENES IN ONE PHENOTYPE
Average expression level
The expression levels in all replicas and all phenotypes were made comparable by iterative alternation of intra- and inter-array normalization to the median of all valid spots until the maximum error of estimate became less than 5%.
Figure 1A presents the expression levels of the first 60 alphabetically ordered genes involved in chemokine signaling in the normal tissue (NOR) profiled from the surgically removed right kidney. Note the wide spectrum of the average expression levels, from less than 0.70 of the median expression forADCY6,BRAFandGNG7to over 100 forCXCL14andGNAI2.CXCL14is particularly important for its role in apoptosis[66].
Expression variation
Formally, the biological replicas can be considered as the same system subjected to non-regulating, slightly different local conditions. As such, lower expression variability indicates increased control of the transcript abundance exerted by the cellular homeostatic mechanisms. Agilent microarrays probe some transcripts by multiple spots. For instance, the human 4 × 44 k two-color microarray probesMIEF1andSRRT(RNA effector molecule) with 20 spots each,PPIA,ABCC6,CXCL12and 6 other genes with 12 spots and so on.
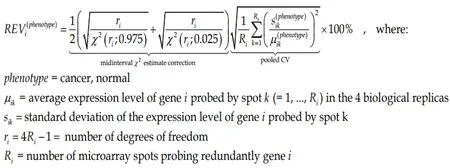
Because of this non-uniform redundancy and in order to correct for the multipletesting, instead of the coefficient of variation (CV) we use to compute the Relative Expression Variability (REV)[65]for every single geneiin each phenotype (cancer nodule or normal tissue).
(1)Formula 1
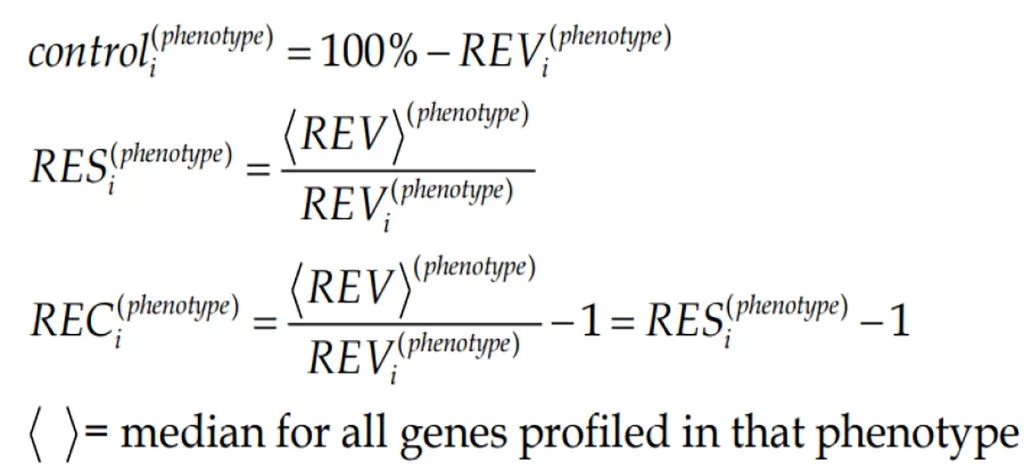
REV can be used to estimate the strength of the “control” of the transcript abundance (control) as the complement to 100%. By comparing the REV score of the gene with the median REVs for all genes quantified in that phenotype, one gets the REV and the Relative Expression Control (REC). REC takes positive values for genes under a stricter control and negative values for those with a lesser control with respect to the median gene, providing a valuable indication about the importance of that gene for the survival, phenotypic expression or/and integration in a multicellular(heterogeneous) tissue.
(2)Formula 2
Figure 1B presents the REC’s of the same selection of chemokine-signaling genes in the normal kidney tissue. Again, there is a wide spectrum of values, from the very controlledFGR(REC = 1.979) andARRB2(REC = 1.964) to the least controlledCXCL12(REC = -0.531) andCCL16(REC = -0.427). The higher gene expression control in cancer tissues may express the cell’s effort to limit the transcriptomic alterations.
Expression coordination
We compute Pearson pair-wi se product-moment correlation coefficient “ρ” between the (log2) expression levels of pair of genes in all ordered spots in the four biological replicates of each phenotype. As illustrated in Supplementary Figure 1A for the coordination ofAKT2, AKT3, CCL19withAKT1in the normal kidney tissue, the analysis identifies the genes whose expressions are significantly (P< 0.05)synergistically (ρ > 0), antagonistically (ρ < 0) or independently (ρclose to0) expressed.Interestingly in Supplementary Figure 1 is the opposite coordination ofAKT1withAKT2, while in all three profiled CCRCC nodules it is positive, indicating that cancer switched the relationship between the twoAKTisoforms.
Based on our hypothesis that genes encoding functionally related products should be synergistically or antagonistically expressed (“transcriptomic stoichiometry”) the analysis of the expression coordination can be used to test and refine the functional pathways[42,65]. The statistical significance is determined with the heteroscedastict-test for the number of degrees of freedom df = 4 (biological replicas) × R (number of spots probing redundantly each of the correlated transcripts) – 2. When using human Agilent microarrays, df is a natural number between (4 × 1 – 2 =) 2 and (4 × 20 – 2 =)78, so that the corresponding significantP< 0.05 absolute |ρ| for synergistically or antagonistically expressed genes is a real number decreasing from 0.950 to 0.219 as the number of the spots probing redundantly the same transcripts increases[67].
Figure 1C presents the expression coordination in the normal kidney tissue of selected chemokine signaling genes withVHL(E3 ubiquitin protein ligase), a gene whose mutation allegedly causes von Hippel-Lindau disease and clear cell kidney tumors[68]. Note thatVHLis significantly (P< 0.05) synergistically expressed withADCY3andCCL28.VHLis antagonistically expressed withADCY9,CCL4,CXCL9,CXCR4,GNB2andGNG10. For the other plotted genes, there is not enough statistical evidence to characterize them as synergistic or antagonistic partners ofVHL.
Figure 1 clearly shows that the three features: Average expression level, expression variation and expression coordination with other genes are independent to each other,providing complementary information for the transcriptome organization principles[55].
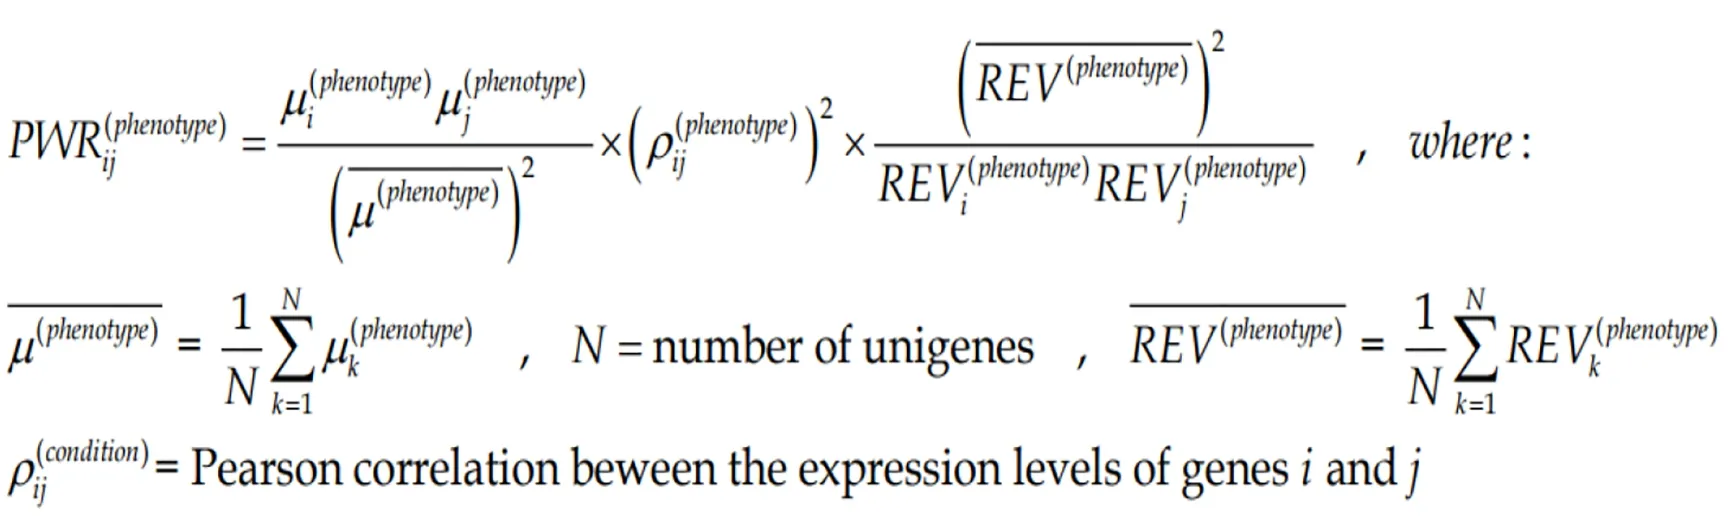
Pair-wise relevance
The three independent features of each gene can be combined into more complex indicators as presented here and in the subsequent sections. In all our experiments with genetically modified animals[69]and genetically manipulated cell cultures[70], we found that any significant change in the expression level of one gene alters the expression levels of hundreds other. Since a gene cluster can be decomposed into gene pairs, we use the Pair-Wise Relevance[65]to characterize the strength of genes reciprocal influence in a particular condition (here region of a tumor).
(3)Formula 3
The two genes can be from the same pathway, providing the “landscape” of the associated genomic fabric, or from two distinct pathways to “see” their interplay.Figure 2 presents such analysis for the oncogene genomic fabric (A-D) and for the interplay between oncogenes in mitochondrial genes (E-H) in the four regions profiled from the CCRCC patient. The most relevant pairs and their PWR scores are shown for each landscape. Note the substantial differences among the landscapes. However, for the analyzed subgroups of genes,ARAF2Pforms the most prominent pairs with the mitochondrially encoded cytochrome c oxidasesCOX1andCOX2.
COMPARING INDIVIDUAL GENES IN TWO OR MORE PHENOTYPES
Expression regulation
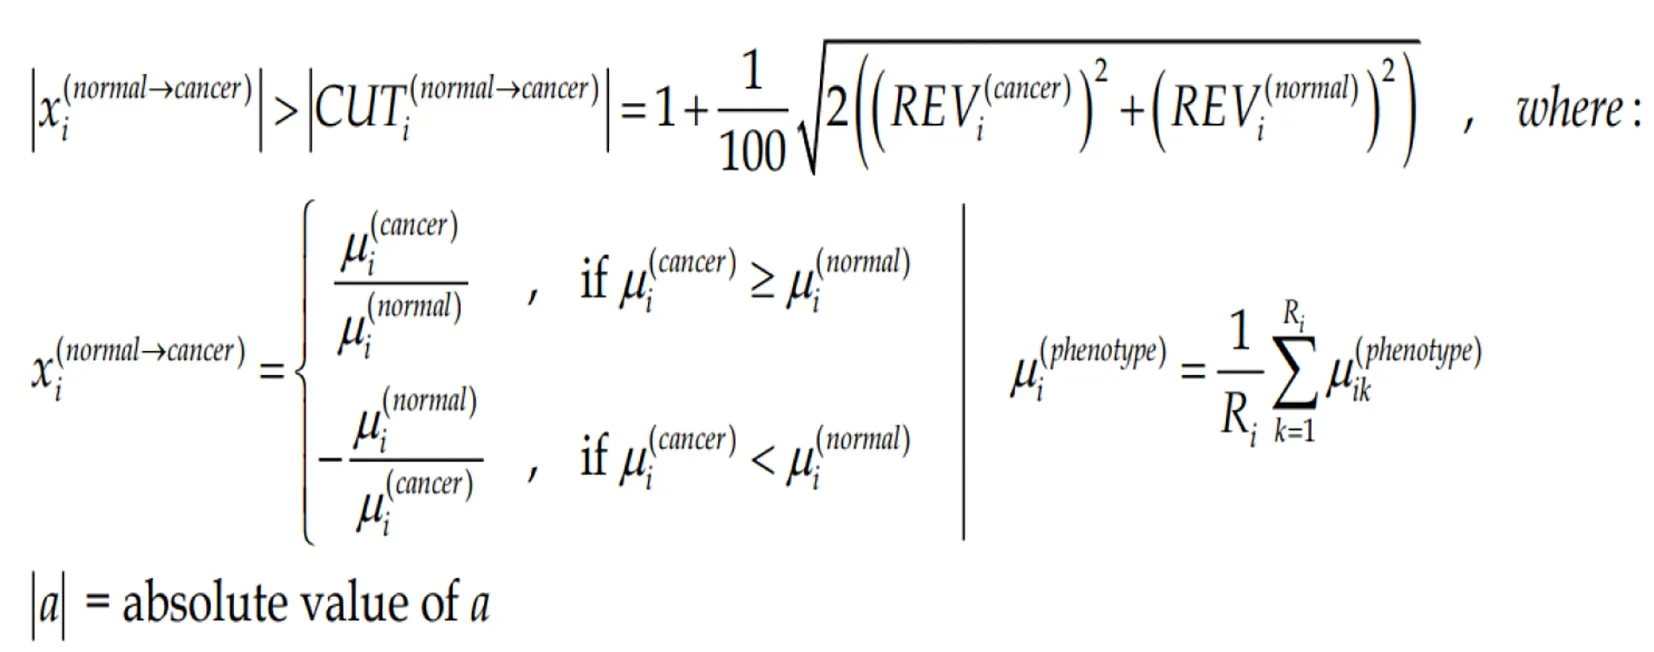
Owing to the non-uniform technical noise of the individual spots probing the gene transcripts and the non-uniform expression variability of the gene expression in different phenotypes, we have renounced to the uniform 1.5× cut-off of the expression ratio. To us, gene “i”is significantly regulated in the cancer nodule with respect to the cancer-free surrounding tissue if the absolute expression ratio |xi| is above the foldchange cut-off (CUTi) computed for that for the compared conditions:
(4)Formula 4
Figure 3A presents the expression ratios (negative for down-regulation) of 14MRPLgenes in the three cancer samples (PTA, PTB, MET) with respect to the normal tissue(NOR) from the studied CCRCC case. The corresponding CUT value is plotted next to the expression ratio column. Note the non-uniformity of the CUT values for this selection from 1.35 forMRPL35in PTA and MET, (less than the uniform arbitrary cutoff of 1.5× adopted in most studies) to 2.45 forMRPL10in PTB (more than the standard 1.5×). Only the genes whose absolute expression ratio exceeded the corresponding CUT for the compared conditions. Three (MRPL36, MRPL40, MRPL45)out of this 14 genes selection would be false hits in PTB if the uniform 1.5× cut-off is applied. Note also that the regulations are different in the three cancer regions, with predominantly higher values in the MET. In a previous report[7], we have determined that the metastatic cells most likely came from the PTA nodule.
REV
Figure 3B presents the REV values of 59 randomly selected mitochondrial genes(average values in Supplementary Figure 1B) profiled in the four frozenly preserved specimens of the CCRCC patient. The most variably expressed genes within the selected mitochondrial genes areATP 6in both NOR (100%) and PTB (129%).TIMM10(REV = 96%) is the most variably expressed in PTA andSLC25A6(mitochondrial carrier; adenine nucleotide translocator) the most variable in MET (51%). Note the significantly lower average REVs in the cancer nodules (26% in MET, 33% in PTA and 38% in PTB) than in the healthy tissue (50% in NOR). The differences between the REV distributions in NOR and cancer samples are statistically significant:P< 10-7for PTA,P< 10-4for PTB andP< 10-15for MET.
As reported by us in numerous other studies on samples from diseased humans and animal models of human diseases[20,32,35]and verified in this example, genes of the normal tissues bear larger variability than the disease-affected ones. According to this criterion, MET region was more affected than PTA that was more affected than PTB.Clinicians also reported larger variability of pathophysiological features in the healthy than in the diseased population. If the second law of thermodynamics is considered,that means that the normal tissue is closer to the equilibrium than the cancer nodules.
Gene hierarchy
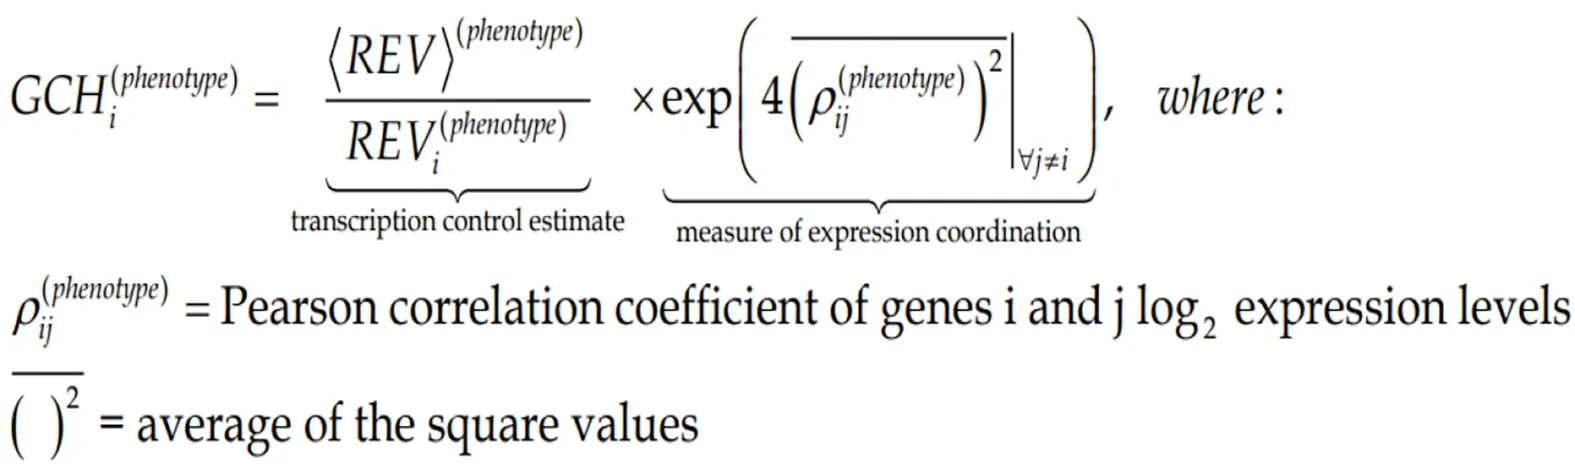
The GCH was introduced by us[7,8,10]to establish the gene hierarchy in each condition.It combines the estimate of the transcription control of that gene with a measure of its expression coordination with each other gene:
(5)Formula 5
Figure 3C presents the GCH scores of the top 3 genes in each condition plus 48 randomly selected genes profiled in the four human CCRCC samples. Of note is that cancer and normal phenotypes in the same tumor have distinct gene hierarchies.
The top ranked gene in the hierarchy of a particular phenotype is termed the Gene Master Regulator (GMR) of that phenotype. As defined, the highly protected expression of the GMR is the strongest modulator of the major functional pathways in the cell.

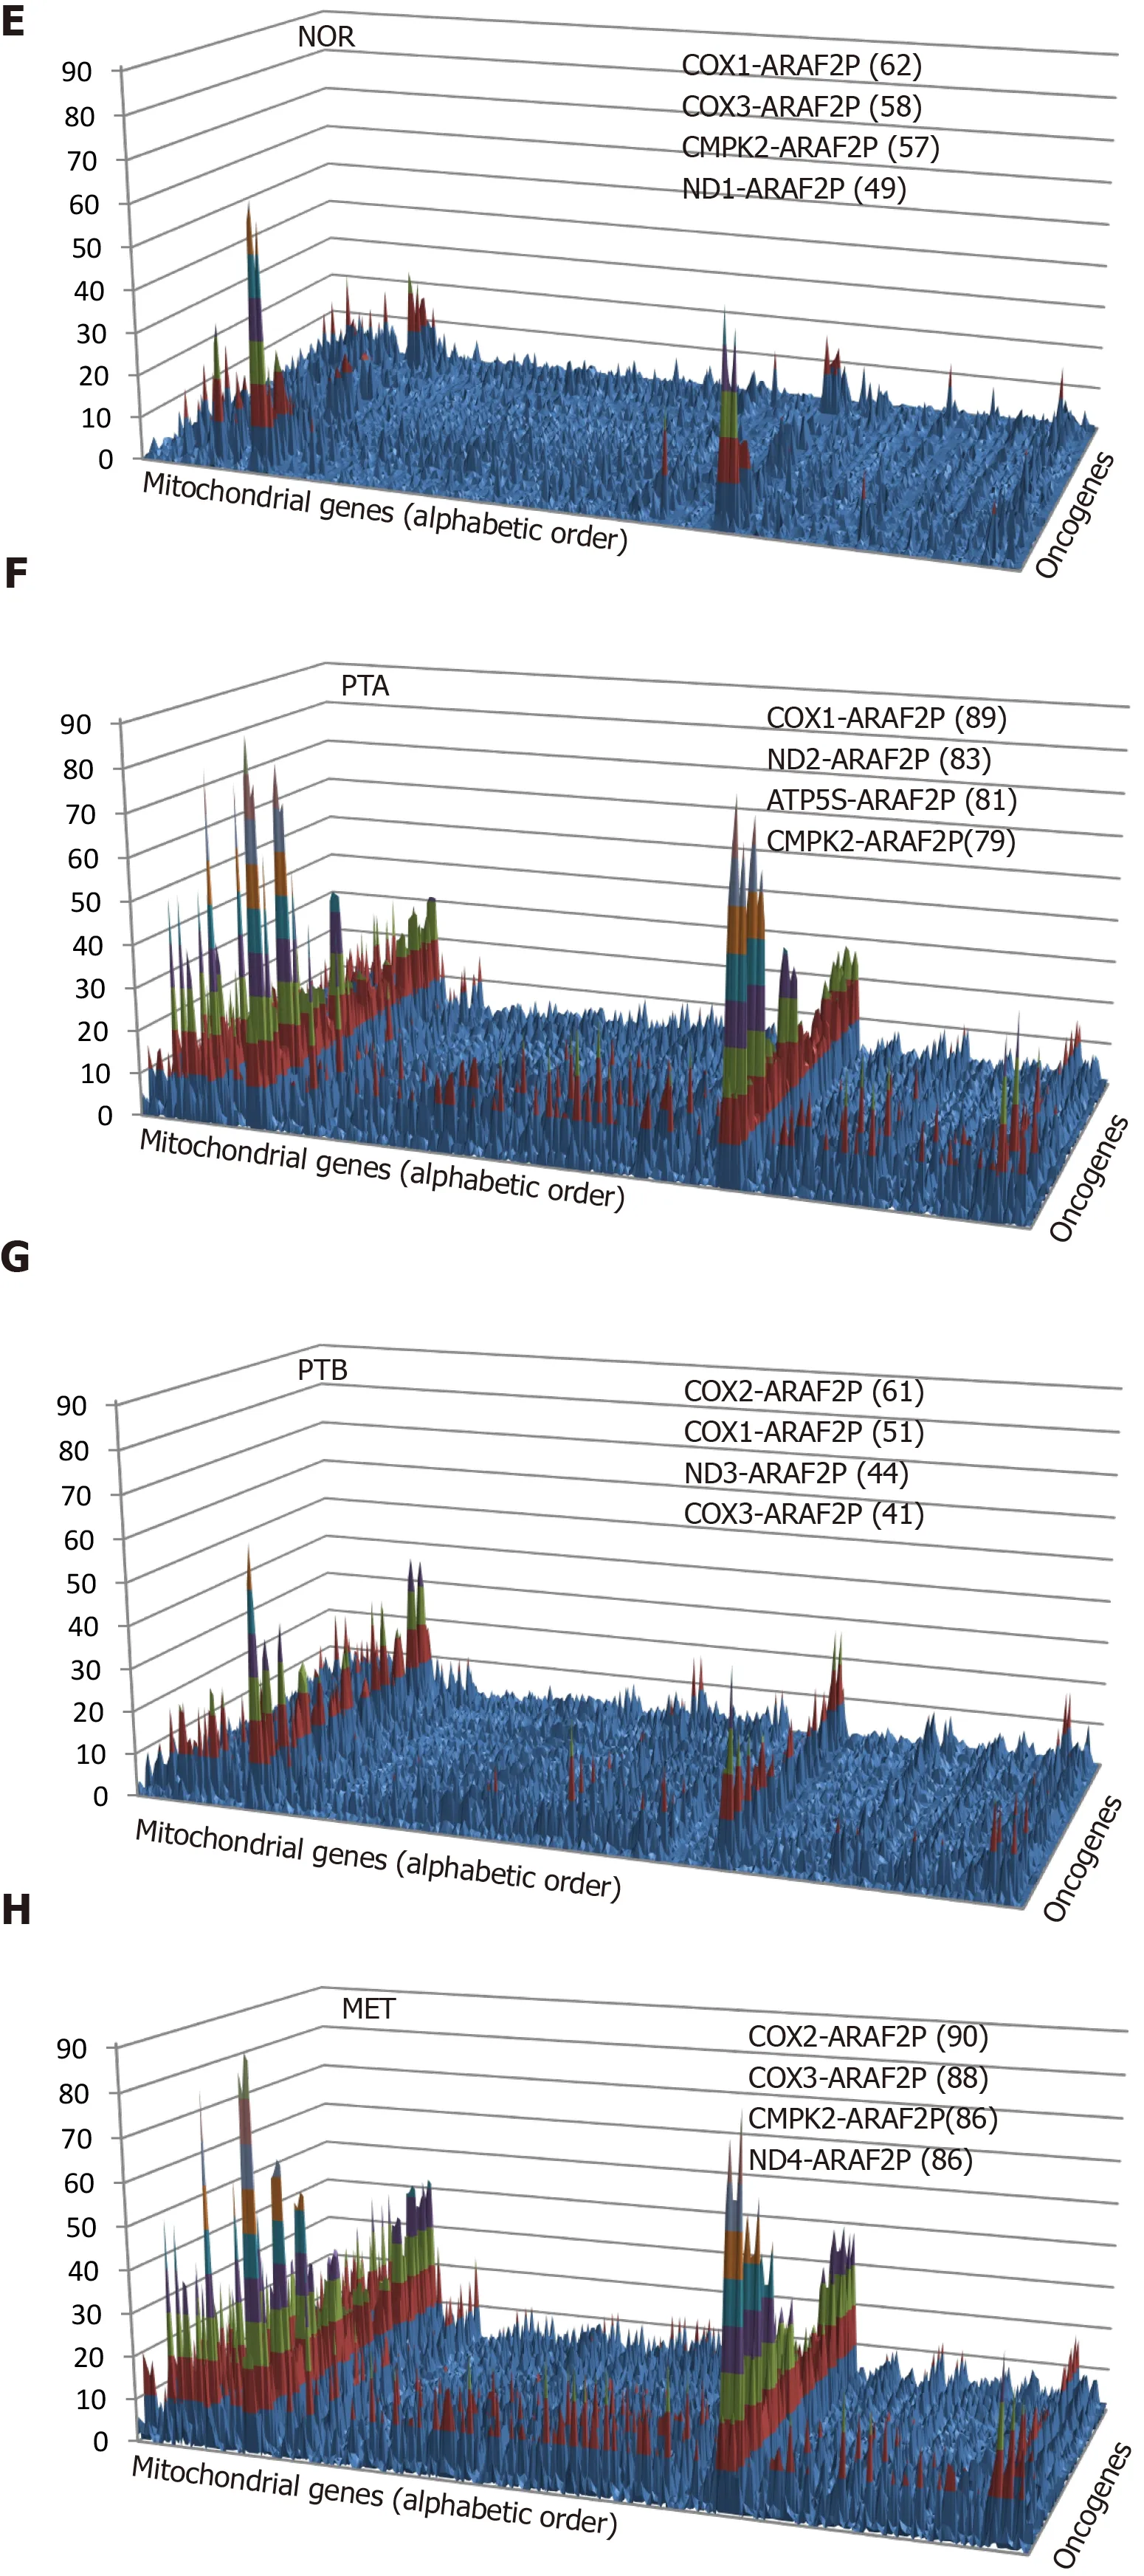
Figure 2 Pair-Wise Relevance Analysis of the oncogenes and interplay of oncogenes with mitochondrial genes in the normal tissue(NOR) from the right kidney, two primary cancer nodules (PTA, PTB) from the right kidney and the metastasis region in the chest wall of a clear cell renal cell carcinoma patient. A-D: Pair-Wise Relevance Analysis of the oncogenes in the normal tissue (NOR) from the right kidney, two primary cancer nodules (PTA, PTB) from the right kidney and the metastasis region in the chest wall of a clear cell renal cell carcinoma patient; E-H: Interplay of oncogenes with mitochondrial genes in the normal tissue (NOR) from the right kidney, two primary cancer nodules (PTA, PTB) from the right kidney and the metastasis region in the chest wall of a clear cell renal cell carcinoma patient.
Importantly, the GMRs of cancer nodules have very low GCHs in the normal tissue and vice-versa, the GMR of the normal tissue scores poorly on the cancer nodules. We arrived at the same conclusion when profiling cancer nodules and adjacent normal tissues also from surgically removed tumors of a case papillary thyroid cancer[8]and two cases of prostate cancer[10].
Expression coordination depends on the phenotype and alternative splicing
Although all pathway software packages network the genes the same way regardless of cell specificity and condition, our analysis reveals a strong dependence on the cellular phenotype within the same tumor. Figure 4 illustrates this finding with the expression coordination ofHIF1A, VEGFA, MTOR, RICTORandRPTORwith other genes from theVEGFAsignaling pathway in the four phenotypes profiled from the CCRCC patient. Note the substantial differences between the cancer samples (PTA,PTB, MET) and NOR and also the similarity of PTA and MET, indicating again that PTA cells formed the MET in MET region.
We had a number of reasons to choose this illustration. First,VEGFApathway and mTOR-signaling (centered onMTOR, RICTOR, RPTOR) are targeted by several drugs in the CCRCC therapy[71,72]. Second,HIF1Ais recognized for its role in the renal cancer[73]. Third, there is enough evidence of the importance of the alternative transcription and alternative splicing in cancer[74].
We presented the coordination of two transcript variants ofVEGFAwith opposite functions (pro-angiogenic and anti-angiogenic) because of their distinct association with the cancer[75,76]. In theVEGFApathway, we included also two transcript variants ofPXN, known for their differential binding to focal adhesion proteins[77].
Percentage of regulated genes or Weighted Individual (gene) Regulation?
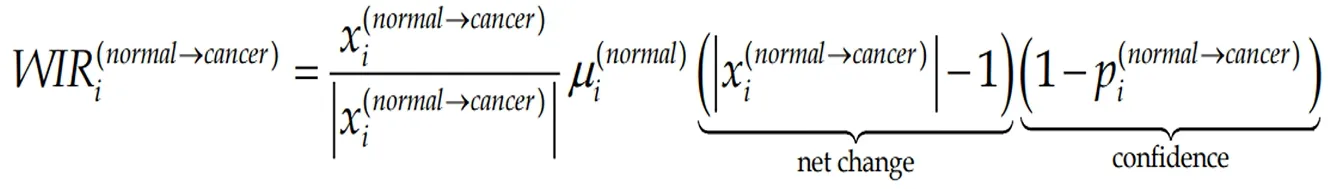
It is customarily to evaluate the transcriptomic alteration by the percentage of significantly regulated genes. Although widely used, this evaluation considers all regulated genes as equal contributors, regardless their fold-change, confidence of the significant regulation or expression level in the normal phenotype. A better alternative is the Weighted Individual (gene) Regulation,WIR, defined as:
(6)Formula 6
wherepi(normal→cancer)is thePvalue of the heteroscedastict-test of the equality of the average expression levels in the compared phenotypes.
The averageWIRfor all genes of a functional pathway, the Weighted Pathway Regulation (WPR)[33,35,36], provides a good measure to compare the alterations of different pathways in the phenotype or alterations of the same pathways in different cancer nodules from the same tumor. For instance, WPRs of the quantified cyclins in the CCRCC experiments were: 1.22 in PTA, -0.46 in PTB and 1.82 in MET, confirming again that MET region was the most affected (largest absolute value). The overall upregulation of cyclins in both PTA and MET, opposite to the overall downregulation in PTB indicates that MET was generated by cells originated in PTA. In the case of the prostate cancer pathway, WPR in the first patient was 5.09 and in the second -8.64,indicating that the overall transcriptomic alteration differs from person to person, even for the same cancer phenotype (here Gleason score 4 + 5 = 9).
Figure 5 presents how the contribution of regulated genes to the transcriptome alteration is considered in: Percentage of regulated genes, expression ratios, and WIRs.The examples are from the prostate cancer pathway in the cancer nodules of two patients (P1C and P2C) with respect to the corresponding cancer-free surrounding tissues (P1N, P2N, expression data from GSE133891 and GSE133906). In the percentage expression, each gene contributes the same regardless of how much is the fold change and thepvalue of the regulation. While the expression ratio offers a more accurate description, it is WIR weighting the expression ratio with the normal expression level and the confidence in the expression regulation, which is the best descriptor out of the three.
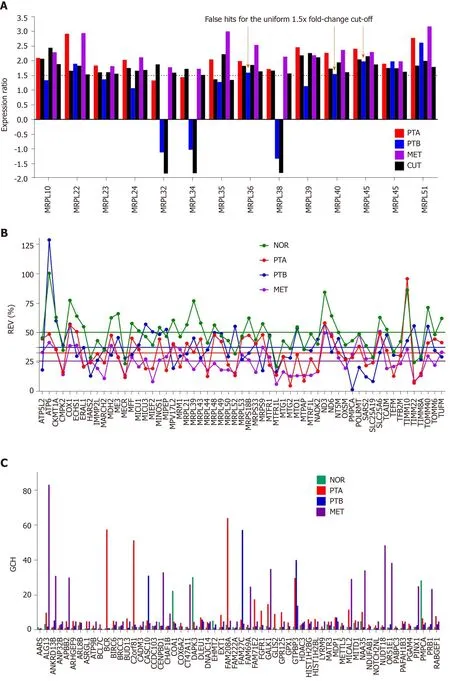
Figure 3 Comparing individual gene quantifiers in the four frozenly preserved specimens of a clear cell renal cell carcinoma 74 years old man. A: Expression ratios (negative for down-regulation) of 14 MRPL genes in the three cancer samples (PTA, PTB, MET) with respect to the normal tissue (NOR)from the studied clear cell renal cell carcinoma case. The arrows indicate the genes which would be false hits in the standard uniform 1.5× absolute fold-change cut.Note that regulation is higher for most genes in MET than in PTA which at its turn is higher than in PTB; B: Relative expression variability (REV) of 59 randomly selected mitochondrial genes. Note the significantly lower averages for the cancer regions with respect to the control (healthy) tissue; C: GCH of the top 3 genes in each condition plus 48 randomly selected ones. NOR: Normal kidney tissue; PTA: Cancer nodule (primary tumor) A; PTB: Cancer nodule (primary tumor) B; MET:Metastatic chest wall. Colored continues lines are the average REVs in each condition. Note that the GCHs of the same gene are region dependent.
Note the large range of gene contributions to the alteration of the pathway and the substantial differences between the two persons. Thus,HSP90B1with WIR = 69 in P1C and WIR = -141 in P2C was not only the most altered gene in both patients but its regulations were opposite. Higher expression ofHSP90B1was associated with poor prognosis in non-small cell lung cancer patients[78]but the regulation of this gene during the progression of the prostate cancer is not yet known. There are, however,reports on how this gene is affected when the androgen-sensitive LNCaP and the androgen-insensitive prostate cancer cell lines are treated with androgen[79]or boric acid[80].
Other oppositely regulated genes in this pathway include the v-akt murine thymoma viral oncogene homologsAKT2andAKT3, CREB3L1andIGF1up-regulated in P1C but down-regulated in P2C. In contrast,Lef1, MAPK3, PDGFC, SOS2andTCF7were down-regulated in P1 but up-regulated in P2.
Measures of gene expression restoration
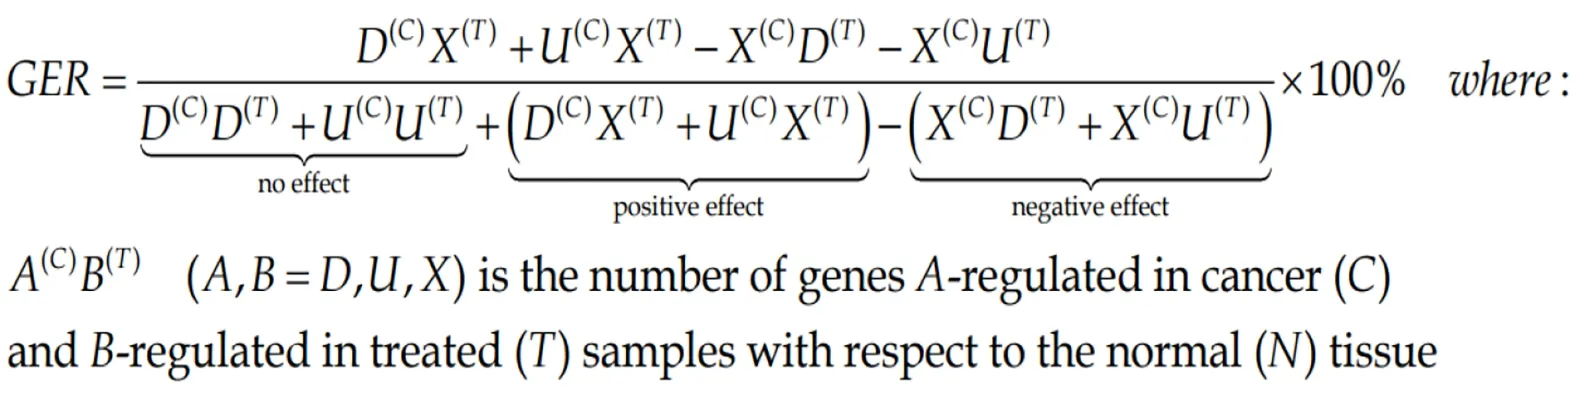
Both percentage of regulated genes and weighted pathway regulation can be used to quantify how efficient was a treatment to restore the normal expression levels for all genes or just for a particular pathway. Thus, Gene Expression Recovery,GERis:
(7)Formula 7
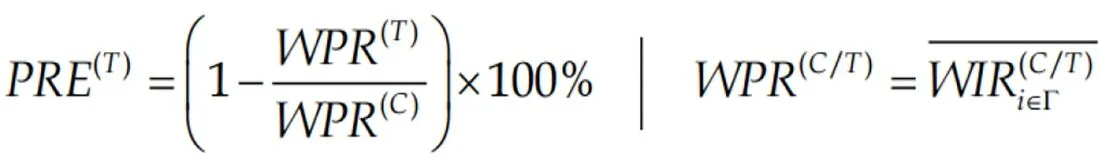
We consider that the Pathway Restoration Efficiency (PRE) is the better measure.
(8)Formula 8
For both measures, the ideal treatment yields 100%, an ameliorative one between 0%and 100%, the neutral one 0% and one that gets you sicker (contradicting “primum non nocere” principle of Hippocratic Oath of the medical practice) takes negative values. We have used these measures to quantify the efficiency of the ACTH and PMX53 treatment of the infantile spasms in rats[36]and of the bone marrow mononuclear cells of the myocardium infarct[81]and Chagas cardiomyopathy[33]in mice.
One phenotype, two persons, two distinct transcriptomes
In this section, we show that the same phenotype has different transcriptomic expressions in different persons. Because of this, it makes no sense to compare the average expression levels in distinct populations of health and cancer individuals. For example, Figure 6 shows the regulation of genes included by KEGG in the prostate cancer pathway in the cancer nodules of two men with the same phenotype, prostate cancer Gleason score 4 + 5 = 9. Thus, patient P1 had 39% of the pathway genes upregulated and 23% down-regulated, while P2 had 23% up-regulated and 17% downregulated with respect to the corresponding cancer-free tissue collected from the same tumors. Interestingly, some of the usual suspects in prostate cancer, the oncogene androgen receptor and the tumor suppressorsCDKN1B, NKX3-1andPTENwere not regulated in either patient.TMPRSS2was not regulated in P1 but down regulated in P2). Like for the CCRCC samples (Figure 2), the CUT criterion detected significant regulations neglected by the uniform 1.5× cut-off and eliminated those over the absolute 1.5× fold-change but below the CUT computed for individual transcripts in the compared conditions. For instance,CREB3is down-regulated with x = -1.43 in P1C(CUT = 1.35×), but not with x = 1.57 in P2C (CUT = 1.58×).
Note that there is not perfect overlap of the sets of the regulated genes. Moreover, as illustrated also in Figure 4, the common hits may have not only different fold-changes,but the regulations can be even in opposite directions, as are the cases ofAKT2/3,CREB3L1, HSP90B1, IGF1, LEF1and other genes. While the different fold-changes suggest different severities of the disease (even in this example both persons have the same Gleason score), the opposite regulations indicate distinct molecular mechanisms.
Differential expression regulation is only a part of the transcriptome uniqueness of each of us; expression control and coordination are also unique. For example, Figure 7 presents the expression coordination ofPTENwith apoptotic genes. Only the significant synergistic, antagonistic and independent pairings in at least one out of the four conditions are presenting. Although not regulated in either patient,PTENwas chosen for this illustration owing to its polymorphism in prostate cancer patients[82].We found that cancer turned the negative (antagonistic) coordination ofPTENwithDDIT3in P1N into a positive (synergistic) one in P1C. Also, the coordination ofPTENwithATF4is positive in the normal tissue of patient P1 but negative in P2.
Biomarkers and GMRs
Gene hierarchy is also different for the same phenotype profiled from different persons as we verified in the two cases of prostate cancer. Figure 8 presents the GCH of the top 10 genes in the cancer nodules of the two prostate cancer patients (P1C and P2C) and the corresponding scores of the same genes in the normal adjacent tissues(P1N and P2N). Interestingly, the first two genes for P1 are: The uncharacterizedLOC145474and the pseudogeneSCARNA7(also known asU90), the latter being associated with the non-small cell lung cancer[83]. The top 2 genes in P2C are:DENND1B, associated with gastric cancer[84]andTOR1Aassociated with dystonia and spermatogenesis[85]. Note the lack of overlap between the top 10 genes of the two persons and that the GCHs of the cancer top genes have much lower scores in the normal tissue. Observe also that the highly ranked elements may be both coding - or non-coding (RNA) as reported also in other studies[83].
Interestingly but not surprisingly because of the low expression control, all considered prostate cancer biomarkers have modest GCH scores in the cancer nodules as illustrated in panels B and C for the two profiled prostate cancer tumors. This result confirms our anterior finding for the biomarkers in a surgically removed papillary thyroid cancer[8]. Thus, whileLOC145474(the GMR of P1C) has a GCH = 126 andDENND1B(the GMR of P2C) has GCH = 150, the best ranked biomarker,TP53(tumor protein p53)[86]has GCH = 25 in P1C (GCH = 1 in P2C). Another biomarker with better score (GCH = 22) in P1C is the transcription factorE2F1, whose role in the development of the prostate cancer is still conflicting[87]. Moreover, none of the known biomarkers performs higher thanPDGFC(platelet derived growth factor C)[88,89], GCH= 8.15 in P2C.
The GMRs approach of cancer gene therapy
The above sections suggested that a cancer phenotype may be compatible with as many transcriptomes as human beings that were, are, or will be affected by the same disease. Hence, there is not one gene whose alteration would explain all cases, nor one gene whose targeting would treat each and everyone. Therefore, a really personalized genomic medicine needs to be developed in which only the procedures to be applied are common but not the targeted gene and the concrete result. Cancer surgery residents learn the general procedures[90]but not the exact anatomy of every patient they will ever have to deal with nor the exact consequences of their intervention.Because of these, let us switch the focus from identifying THE (non-existing) gene that will cure everybody to the PROCEDURE that identifies and manipulate the most legitimate target genes for THIS person and NOW.
In recent publications, we proposed that the GMRs of cancer nodules could be the most legitimate targets for cancer gene therapy[8,10,91]because: (1) The strict control of the expression level indicates that the right amount of GMR transcripts is critical for the cell survival; (2) The high coordination degree with expressions of many other genes shows how influential the GMR is for the cell physiology; and (3) The very low GCH scores of the cancer nodule GMR in the surrounding normal substance suggest that silencing the GMR may selectively kill the cancer cells from the tissue.
As the most frequently altered genes in large population, the biomarkers are among the most alterable genes of the individual and, by consequence, they would never be the GMRs, nor reasonable targets for gene therapy.
The reason for the “c” suggestion came from the results of transfecting the same gene in two standard human thyroid cancer cell lines, BCPAP (papillary) and 850C(anaplastic), and determine the effects. We found that manipulating the expression of:NEMP1,PANK2,DDX19BandUBALD1had transcriptomic consequences in line with their GCH in the untransfected cells[8,10].
The GMR approach can be easily turned into a clinical practice by profiling the four quarters of the biopsy from a cancer nodule (or the modified white blood cells),determine the GMRs and silence them by CRISPR-Cas9 or other gene editing method[92]. In time, the industry will produce ready-to-use CRISPR-Cas constructs for every gene, so that, once identified the GMR(s) of the cancer nodule(s), the procedure can be applied to the patient with similar costs as the biomarker-based therapy but
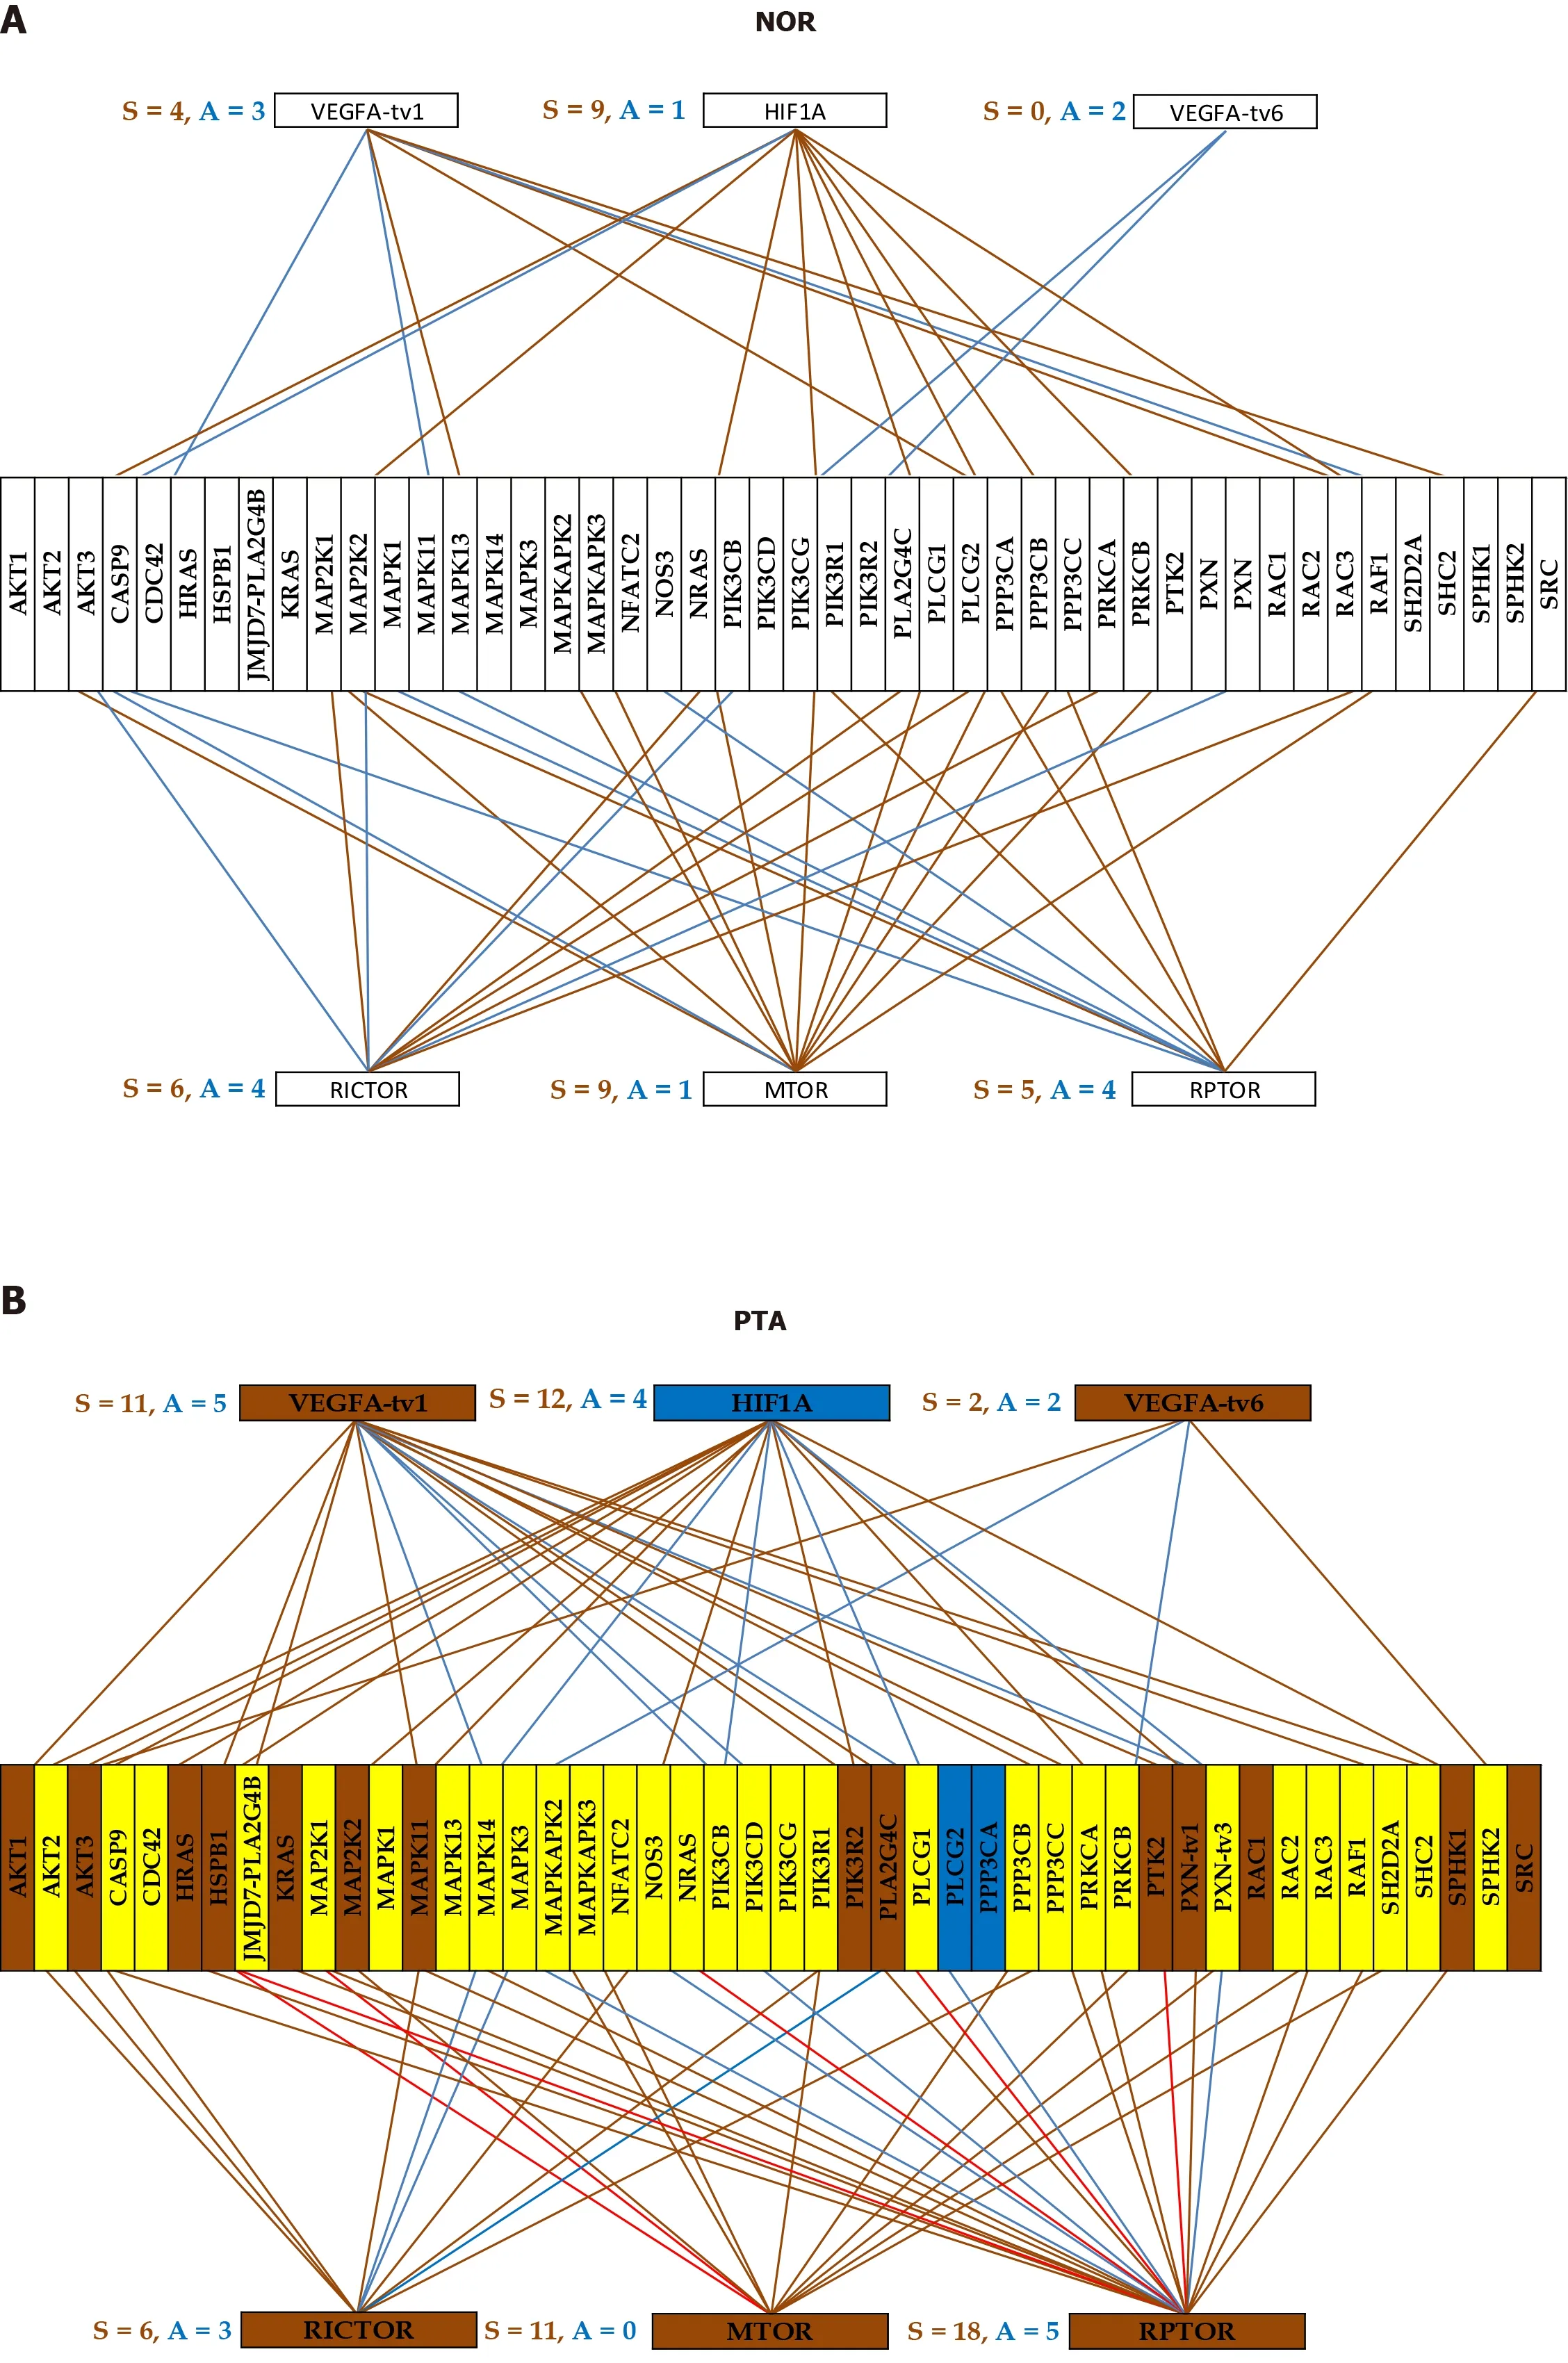

Figure 4 Gene networking depends on phenotype and may include different coordination for alternative transcripts. A-D: A brown/blue line indicates that the connected genes are (P < 0.05) significantly synergistically/antagonistically expressed. Brown/blue background of the gene symbol denotes significant up-/down regulation, while the yellow background stands for not statistically significant expression change. NOR: Normal kidney tissue; PTA: Cancer nodule (primary tumor) A; PTB: Cancer nodule (primary tumor) B; MET: Metastatic chest wall.
with much better results.
CONCLUSION
“There is no sickness but sick persons” is what all medical courses start with all over the world, although after that they teach only the sickness…
The transcriptomic differences between people encompass the expression profile,strength of the control of transcript abundance and gene networking. The existence of three independent transcriptomic features of a gene indicates that just restoring the normal expression of the biomarkers included in the transcriptomic signature of the disease is not enough to cure the disease. We need to restore also their allowed expression fluctuations and the right networking. For analogy, it is not enough to restore the number of functional diodes in a TV set, they need the normal voltages and the right wiring.
There are two major options for cancer gene therapy: (1) To force the cancer cells to go back to the normal differentiation state and programmed cell death; or (2) To clean the tissue by selectively killing them. The second option needs either to make the cancer cells vulnerable to the immune response or to silence their GMRs.
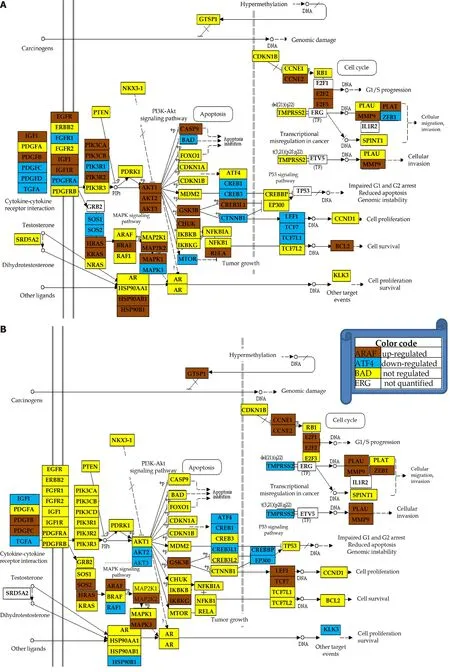
Figure 6 Regulation of the prostate cancer pathway. A: Patient 1; B: Patient 2. Note the different regulations of the pathways although the two patients have the same Gleason score.
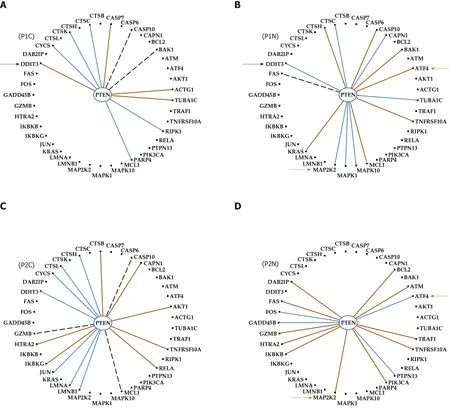
Figure 7 Even with the same phenotype and Gleason score, the genes are networked differently in the prostates of distinct persons. A:Cancer of patient P1; B: Normal tissue of patient P1; C: Cancer of patient P2; D: Normal tissue of patient P2; Continuous brown/blue lines indicate statistically (P <0.05) significant synergistic/antagonistic pairing of the connected genes, while dashed black ones that the two genes are independently expressed. Black arrows point to a gene whose coordination with PTEN was switched from negative in the normal tissue to positive in the corresponding cancer nodule. Brown arrows mark the opposite coordination when comparing the normal tissues of the two patients.
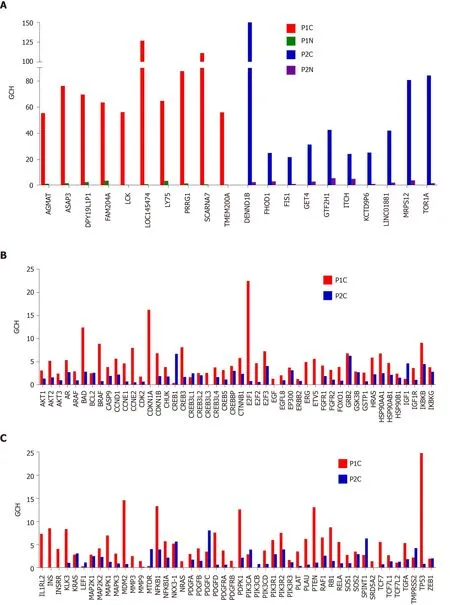
Figure 8 Biomarkers are not the most important genes for the cell phenotype. A: Top 10 genes in the prostate cancer nodules of the two patients and their scores in the corresponding normal prostate tissues; B and C: Gene commanding height scores of the known prostate cancer biomarkers in the cancer nodules of the two pattients. GCH: Gene commanding height.
杂志排行

World Journal of Clinical Oncology的其它文章
- Comparison of efficacy between adjuvant chemotherapy and chemoradiation therapy for pancreatic cancer: AJCC stage-based approach
- Diacerein treatment prevents colitis-associated cancer in mice
- Circulating tumor DNA: Where are we now? A mini review of the literature
- Healthcare delivery interventions to reduce cancer disparities worldwide