A Proposal for an Integrated Model to Evaluate the Circadian Effects of Mesopic Light Sources
2021-01-09WeisenZengandYuBian
Weisen Zeng and Yu Bian
(1. School of Physics and Optoelectronics, South China University of Technology, Guangzhou 510640, China; 2. State Key Laboratoryof Subtropical Building Science, School of Architecture, South China University of Technology, Guangzhou 510640, China)
Abstract: With the increasing attention on circadian effects driven by light, lighting industry has inspired a revolution of photobiological lighting design. Due to diverse evaluation criteria for visual and non-visual systems, models that combine these evaluation parameters are indeed urgent. Thus, an integrated model for mesopic lighting evaluation of circadian effects was proposed. The circadian efficiency function adopted in this study was synthesized by CIE 1931 XYZ 2 deg color matching functions and standard scotopic sensitivity function. Then, the integrated model composed of International Commission on Illumination 1931 xy chromaticity coordinates, scotopic/photopic ratio, and illuminance could be obtained with synthesized circadian efficiency function. The model showed that for light sources with fixed chromaticity coordinates and fixed illuminance, enhancing the circadian effects is equivalent to increasing the scotopic/photopic ratio, which suggests a useful method for practitioners to explore the photobiologically reasonable spectrum for mesopic lighting. Light-emitting diodes spectra optimized by four-component color-mixing method were employed to figure out the property of the integrated model.
Keywords: circadian effects; mesopic lighting; scotopic/photopic ratio
1 Introduction
In the last century, experimental studies indicated that melatonin suppression of human is controlled by light and intensity dependent[1-3]. Melatonin is a hormone that is majorly secreted by pineal gland[2]. The abnormal variation of light-induced melatonin might accompany with adverse effects of human from physiology to psychology, including loss of core body temperature[3], circadian disorder, insomnia[4], and emotional negativity[5]. However, light additionally has positive effects on clinical therapy for specific diseases, such as sleep problems, circadian disruptions, and seasonal affective disorder (SAD)[4].
The discovery of intrinsically photosensitive retinal ganglion cell (ipRGCs) makes it possible to establish a distinct pathway to investigate how light impacts melatonin secretion[6]. This pathway consists of ipRGCs and a distinct intracerebral neural pathway[7]. Light stimulus signal is transmitted along this pathway to pineal gland. Then, the pineal gland designated as a major melatonin producer starts to mediate the melatonin secretion[4,7]. The effects of light on human via this access are called circadian effects, which is also known as non-visual effects[4]. Subsequently, a study reported that Californian teachers who live in areas with high levels of ambient light at night may be at an increasing risk of getting breast cancer[8]. Another research had a similar conclusion for female nurses[9]. It is suggested that high levels of outdoor light at night may result in invasive breast cancer risk. Thus, outdoor lighting might have great potential for human health, and the mesopic evaluation model of circadian effects is worth studying.
In the past two decades, pioneers have turned to explore the evaluation, quantification, and implementation of circadian effects in lighting design[10-15]. After Brainard et al.[16]and Thapan et al.[17]had independently measured the circadian spectral sensitivity based on melatonin suppression, Gall et al.[10]and Rea et al.[12]respectively proposed a circadian sensitivity functionC(λ), as is shown in Fig.1, in whichV(λ),V′(λ), andC(λ) represent photopic, scotopic, and non-visual spectral sensitivity curves, respectively. Then, Gall and Bieske[10]put forward circadian action factor (acv) model to evaluate circadian effects of light source without considering the non-linear influence of light intensity on melatonin suppression[16-18]. Theacvmodel is analogous to scotopic/photopic ratio (RSP) which is a key parameter of mesopic lighting[19]. This model has been suitably utilized to optimize the spectral power distribution (SPD) of photobio-friendly light source[14-15]. Similarly, mesopic circadian action factorac, mesmodel was used to photobiologically rationalize the SPD of outdoor light source[11]. Rea et al.[12]came up with the circadian light (CLA) model, which is usually used with a prediction model of melatonin suppression, i.e., circadian stimulus (CS) model[20]. To enhance the practicality, a simplifiedCLAmodel incorporatingacvmodel and corneal illuminance was raised by Bellia and Seraceni[13]. Recently, many efforts have been made in the comprehensive review of light sources by analyzing non-visual, photopic, scotopic, and mesopic evaluation parameters[21-23]. The constraints between the above models and the visual parameters are ambiguous, which may be considered an obstacle to lighting design.
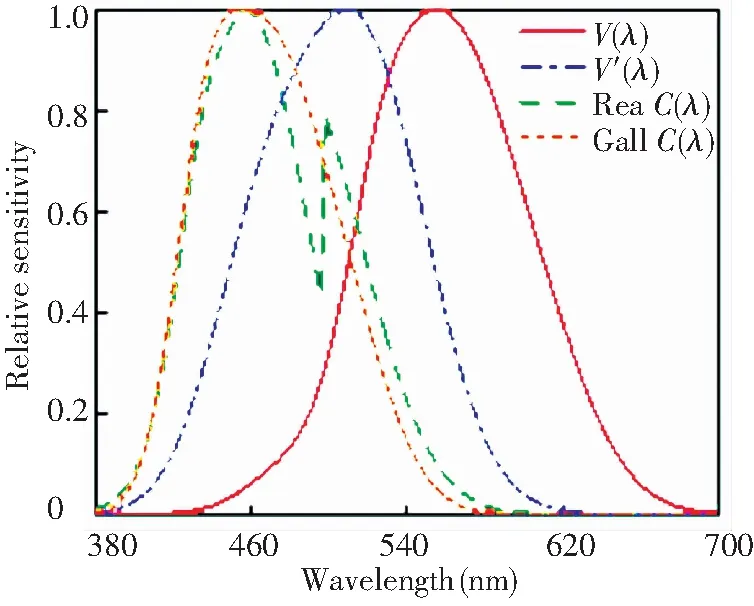
Fig.1 Spectral sensitivity curves
This paper shows that the relationships among evaluation parameters of non-visual, photopic, scotopic, and mesopic efficacy are numerically constrained by SPD, and those constraint relationships were explored by the method of synthesizing spectral sensitivity curve. First, International Commission on Illumination (CIE) 1931XYZ2 deg color matching functions[24]and standard scotopic sensitivity function[24]were employed to obtain new circadian sensitivity functionC′(λ) by fitting Brainard’s and Thapan’s spectral sensitivity data[12]with maximum coefficient of determination (R2). Note that the synthesis method is based on mathematics and independent of physiological basis. Then,C′(λ) was applied to transform the originalacvmodel to a new one. Finally, an integrated model was obtained by revising the BelliaCLAmodel with the newacvmodel. This integrated model, which can be used to evaluate the circadian effects of mesopic light sources, showed the constraint relationships among 1931xychromaticity coordinate, scotopic/photopic ratio, and illuminance. To investigate the universal characteristics of the model, four-component color-mixing method[15,25]will be wielded to optimize SPD.
2 Circadian Sensitivity Function
A reasonable lighting can bring efficient work and health benefit[4,26]. Traditional lighting design generally concerns photopic and mesopic efficacy, since scotopic efficacy may not be necessary and non-visual efficacy is previously unknown. With the discovery of circadian effects, a comprehensive evaluation of conventional vision efficacy and non-visual efficacy for light sources has become a consensus. Fig.1 presents two visual spectral sensitivity curves and two non-visual spectral sensitivity curves. The mesopic sensitivity functionVmes(λ) (not given) is determined byV(λ) andV′(λ) with various adaptation coefficients[11,19]. Because of the difference of spectral sensitivity, various evaluation models have been adopted to estimate visual and non-visual efficacy, which troubles the practitioners. For example,RSPfactor defined in Eq.(1)[19]is applicable in mesopic lighting for its indicational function on the brightness performance of light source, and theacvfactor defined in Eq.(2)[13]signifies the circadian effects of light source. They are defined with different spectral sensitivity curves and individually describe the efficacy of two vision systems[22], which might increase the complexity of spectral optimization. Therefore, the distinct relationship between them is worth studying. To find out this relationship, the method of synthesizing spectral sensitivity curves rather than traditional ratio methods was adopted.
(1)
(2)
whereE(λ) is spectral irradiance distribution,V(λ) andV′(λ) represent photopic and scotopic sensitivity functions respectively, andC(λ) is a circadian sensitivity function proposed by Gall et al.[10]

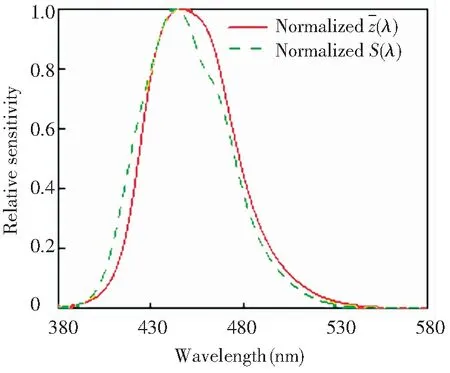
Fig.2 Normalized spectral sensitivity of S(λ) and
M·C′(λ)=A·ST
(3)
whereMis a coefficient that normalizes the peak ofC′(λ) to one.Ais coefficient vector andSrepresents spectral sensitivity curves vector.
A=[azayaxas]


Exhaustive method was employed to list possible cases ofAwith an accuracy of 0.01. The optimalC′(λ) was obtained with the maximum coefficient of determination that is calculated by approved data[12]and corresponding values ofC′(λ). WhenA= [1.48 -0.45 0.29 1.92] andM=3.6377, the best fit was obtained whenR2=0.86. Then,C′(λ) can be rewritten as


(4)

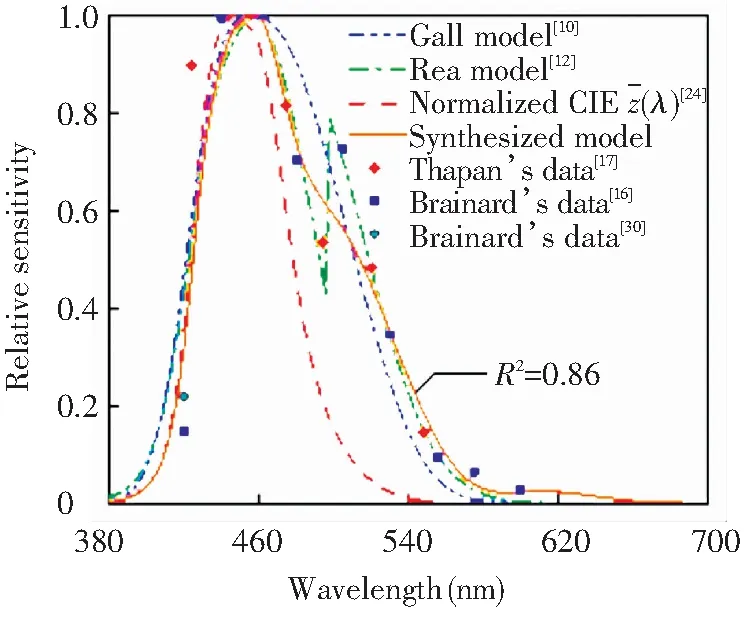
(a) Four optional circadian sensitivity functions and data of previous studies
3 Integrated Model
Existing experiments have proved that SPD as well as intensity and exposure duration of light can affect circadian rhythm[2,4,18,29]. In this paper, exposure duration is out of consideration and the remaining two factors will be considered. Gallacvmodel provides a criterion for project spectrum of light source. ReaCLAmodel can work as a guideline of the usage of light intensity[20]. BelliaCLAmodel combines the advantages of the other two models[13]. Considering the conciseness and practicability of evaluation model, the BelliaCLAmodel was adopted, which is defined as[13]
CLA=(2.3748acv-0.67)Ev cor, ifΔ≥0
(5)
CLA=(2.3748acv+ 0.11)Ev cor, ifΔ<0
(6)
where
CLA: Circadian light, which was stipulated that 2856 K blackbody radiation at 1000 lux has aCLAvalue of 1000;
Evcor: Corneal illuminance, and
E(λ) : Spectral irradiance distribution;
acv: Circadian action factor;
Δ: Discriminant factor, which was defined as

Based on Eqs.(1), (2), and (4), the newacvmodel can be obtained as follows:
(7)
whereX,Y, andZare CIE 1931 tristimulus values, and the relationship between them is[24]
X=(x/y)Y;Y=Y;Z=[(1-x-y)/y]Y
(8)
Then,the newacvmodel is rewritten as
acv=(0.4096-0.5306y-0.3272x)/y+
0.2121RSP=aCAF+aSP
(9)
wherexandyrespectively represent thex-coordinate andy-coordinate values of the CIE 1931 chromaticity coordinate. Left part includingx-coordinate andy-coordinate is rewritten asaCAF, and the other part is rewritten asaSP. Obviously, the newacvmodel is demonstrably expressed byx-coordinate,y-coordinate, andRSPvalues, which will be discussed later.
ReaCLAmodel proposed in 2012 gives a constant, 1622, to set the normalization ofCLAso that 2856 K blackbody radiation at 1000 lux has aCLAvalue of 1000[12]. It must be noted that if the newacvmodel is directly combined with BelliaCLAmodel, then the scale condition cannot be satisfied. Therefore, the constants of BelliaCLAmodel should be slightly modified. Advance explanation is that 2856 K blackbody radiation at 1000 lux hasacv= 0.4080 andΔ<0. Referring to the format of BelliaCLAmodel, an equation can be obtained as
0.4080α+β1=1
(10)
whereαandβ1are optimization coefficients whenΔ<0.
Since one equation cannot solve two unknowns, optimization method was adopted to solve this equation.αhas a value of 2.4510 when ignoringβ1. Then,αaround 2.4510 andβ1around zero were sought by minimizing the mean square errors that were obtained with the data of ReaCLAmodel and the integrated model from 1000 K to 3400 K CCT. The optimal values ofαandβ1were 2.5456 and -0.0386, respectively. After acquiring theαvalue,CLAequation withΔ≥0 condition can be written as
CLA=(2.5456acv+β2)Ev cor
(11)
whereβ2is optimization coefficient whenΔ≥0.
The same optimization way was employed to huntβ2, and the optimalβ2value was -0.7224.
Δz=0.5596Z- 0.2916Y
(12)
Based on Eqs. (8) and (12), the equation of discriminant factor can be further simplified. Obviously, the values ofyandYmust be greater than zero. The discriminant factor is finally defined as
Δz=1-x-1.5211y
(13)
Then, the integrated model can be written as
CLA=[2.5456(aCAF+aSP) - 0.7224]Ev cor,
ifΔz≥0
(14)
CLA=[2.5456(aCAF+aSP) - 0.0386]Ev cor,
ifΔz<0
(15)
The comparison between ReaCLAmodel and the integrated model for a blackbody radiator at different CCTs are shown in Fig.4. Supplemental instruction is that all corneal illuminances were scaled to 300 lux. The two curves almost coincided, which implied the effectiveness of the integrated model.
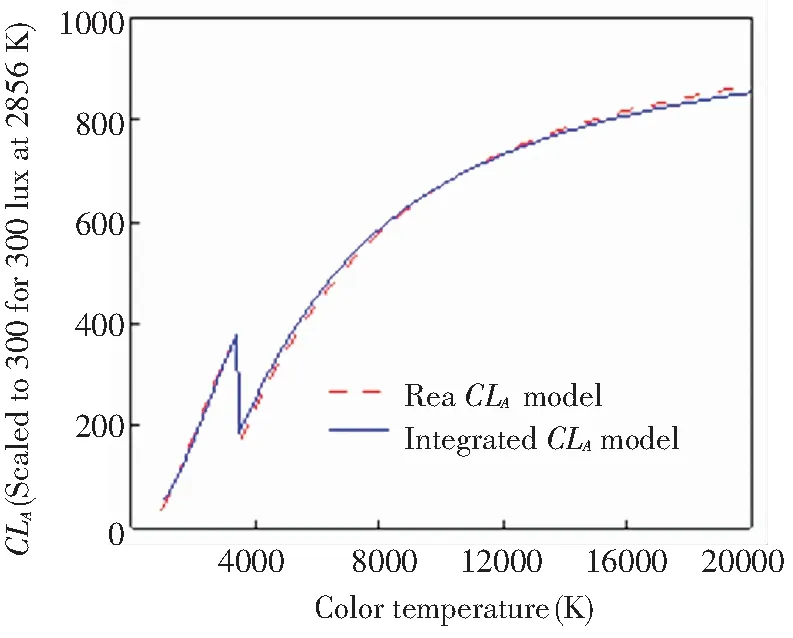
Fig.4 Rea CLA model[12] and integrated CLA model for a blackbody radiator at different CCTs
OnceCLAis gained, circadian stimulus (melatonin suppression expressed in percentage terms) can be predicted by the following equation[13]:
(16)
4 Exploration
The function of illuminance of the integrated model on circadian effects showed no special difference from BelliaCLAmodel[13]. Thus, this section focuses on the newacvmodel and the new discriminant factorΔz, which primarily reveals the nature of the integrated model. Before formal discussion, a four-component color-mixing method was established. There are many ways of dimming. Lee et al.[28]implemented a precise dimming and color control light-emitting diodes (LED) system based on bicolor LEDs, which consists of warm-white and cool-white LED. Unfortunately, bicolor LEDs are not competent for wide tuning range of chromaticity coordinate. RGB-tricolor LEDs make up for this shortcoming with possibly unsatisfactory color rendering index (CRI)[15], which can be improved by tuning full-width at half maximum (FWHM) of RGB-spectra[14]. However, it might be hard to practice. To a certain extent, red-green-blue-white (RGBW) LEDs can solve these problems[15]. Thus, the SPD (Fig.5) of RGBW LEDs was employed. By mixing them with different proportions, a new SPD can be obtained. All optimization process was simulated in computer to ensure accuracy.
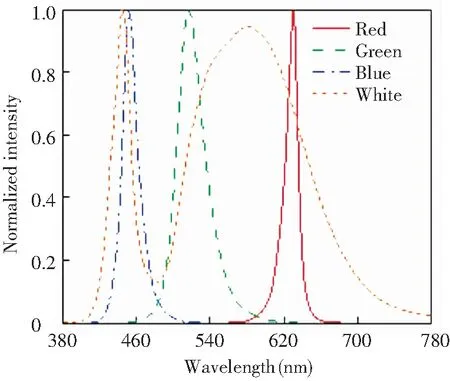
Fig.5 SPDs of RGBW LEDs
According to Eq.(13), discriminant factor relies on chromaticity coordinate. The short dot line in Fig.6(a) represents the condition ofΔz=0, which separates the chromaticity diagram into two parts. AllΔzabove this line is smaller than zero and Eq.(15) is enabled in those areas. Otherwise,Δzis greater than or equal to zero and Eq.(14) is enabled. New discriminant factor can be obtained byXYZsensor or RGB sensor[28]without measuring SPD. Moreover, according to the chromaticity coordinates, lighting engineers already know whichCLAformula to use before they design the illumination spectrum.
The newacvmodel can be divided into two factors. TheaCAFfactor is construed as color action factor, which is only dependent on chromaticity coordinates. The contour lines ofaCAFfactor are plotted in Fig.6(a). It can be found that different combinations ofx-coordinate andy-coordinate might contribute to a sameaCAFvalue. A novel comprehension is that different colors of light might have same contribution toaCAFfactor. TheaCAFvalues around blue light were higher than those around red light, which is consistent with the traditional cognition that blue light causes serious circadian effects[30]. The short dash line, representing isothermal line of CCT = 5000 K, intersected with the contour lines ofaCAFfactor. Thus, identical CCT has multipleaCAFvalues, which is a reason why CCT is not suitable to evaluate circadian effects. TheaSPfactor accounts forRSPaction factor. According to Eq.(9),acvfactor is linear withRSPfactor while fixingaCAFto a constant. Similarly, the linear nature betweenacvfactor andaCAFfactor can be obtained with a fixedRSP. However, the possible relationship betweenRSPandaCAFis still ambiguous.
Further exploration was carried out to understand the newacvmodel. Based on the theory of control variate method, letaCAFbe a constant. There are two conditions: the first is to restrictaCAFat the contour line, and the second is to fixaCAFat a point. The first case is discussed primarily. Spectral optimization condition isaCAF= 0.3000±0.0001. All eligible SPDs were obtained by four-component color-mixing method and exhaustive method that list entire combinations of spectrum. Fig.6(b) shows five selected SPDs, whose CCTs gradually decreased from upper left to bottom right along the contour line ofaCAF= 0.3000 (Fig.6(a)). A clear graphic explanation is displayed in Fig.7. It is concluded that CCT exactly declined with the increase ofx-coordinate. TheRSPvalues also had a general downward trend, which signifies the decline ofacv. According to Eqs. (14)-(16), a reasonable speculation is that circadian effects also have a weakening trend.

(a) Distribution of aCAF factor on CIE 1931 XYZ chromaticity diagram (solid straight lines represent contour lines of aCAF factor) (b) Relative SPDs with same aCAF factor
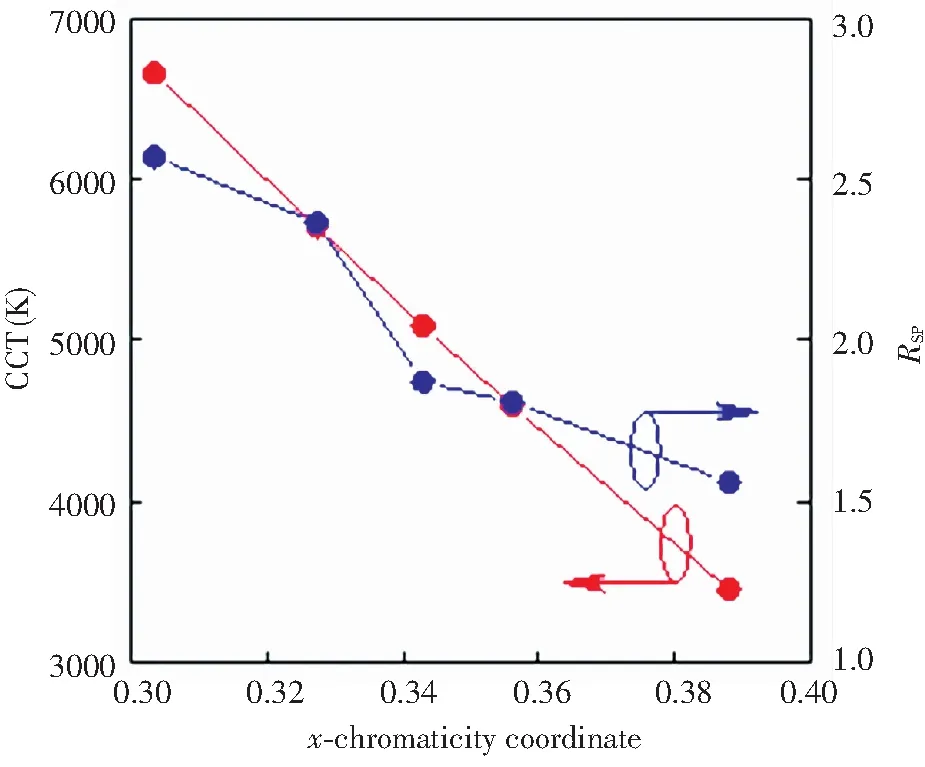
Fig.7 Relationship between CCT and RSP as a function of x-coordinate
In Fig.6(a), the solid straight lines represent the contour lines ofaCAFfactor, which increase from top to bottom. The short dot line represents the condition ofΔz= 0. The short dash line is the isothermal line of CCT=5000 K. SPDs were obtained by four-component color-mixing method whenaCAF= 0.3000±0.0001. The five diamond points in Fig.6(a) from upper left to bottom right respectively indicate the chromaticity coordinates of the spectra from bottom to top in Fig.6(b).
The second case was conducted by controlling (x,y) coordinate point in (0.3500±0.000 1, 0.3520±0.0001). In this simulation, the offset ofaCAF(0.3000±0.0002) was too small to significantly impose onacv, which illuminates from an aspect thatRSPis a major factor on evaluating circadian effects. Six optimal spectra with differentRSPare given in Fig.8(a), in whichRSPwas visibly different, despite (x,y) coordinate was almost unchanged. By comparing the tuning range ofRSPwith the first condition, the second condition had a fine-tuning range. The luminous efficacy of radiation (LER) and CRI are key parameters of a light source[30]. In Fig.8(b), LER and CRI are described as a function ofRSP. CRI andRSPwere positively correlated within a certain range, while LER andRSPhad an opposite relationship. According to Eq.(9),RSPfactor plays a decisive role onacvvalue with a fixedaCAFvalue. Thus, if LER loses a bit, mesopic luminance, circadian effects, and CRI can be improved simultaneously by enlargingRSPfactor.

(a) SPDs obtained by four-component color-mixing method when (b) Relationship between LER and CRI as a function of RSP
The second condition can be verified by the experiment of Souman et al.[29]In their research, two independent light sources were developed with different melanopic efficacy factors (MEFs). The spectral properties of these two light sources are presented in Table 1. The light sources of low MEF and high MEF had almost the same values of illuminance,x-coordinate,y-coordinate, andaCAF. The main differences are the values ofRSPfactor. According to Eqs.(9), (15), and (16), large value ofRSPleads to large values ofacvandCLA, which implies higher level of melatonin suppression. Results of the experiment showed that the melatonin suppression of high MEF is higher than low MEF, which is a supporting evidence for our prediction.
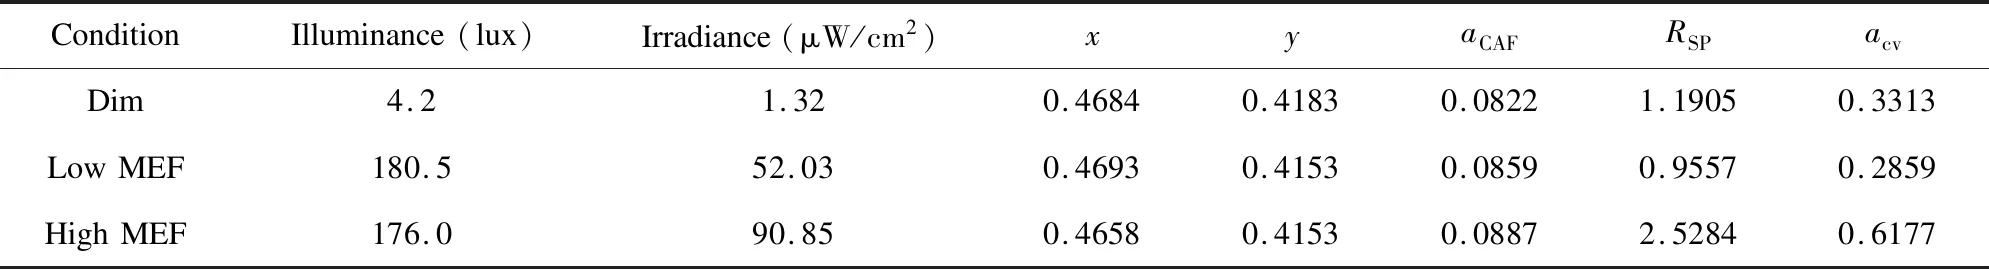
Table 1 Spectral properties for the conditions in Ref. [29]
5 Discussion
According to Fig.6(a) and Fig.8(a), CCT can roughly describe the circadian effects, because same CCT maps multiple values ofaCAFandRSP. When human is exposed to light environment with different absolute SPDs, melatonin suppression can be distinctly different without changing illuminance level or CCT[29]. This evidence manifests that absolute SPD of light source is the most effective tool to precisely evaluate circadian effects. Hence, an evaluation model of circadian effects that reflects the characteristic of absolute SPD is required. The integrated model proposed in this paper is a suitable model. The absolute SPD is the product of relative SPD and amplitude. To a certain extent, the corneal illuminance can be regarded as the effect of amplitude. The bracket parts in Eqs.(14)-(15) can be regarded as the effect of relative SPD.
Original intention ofacvis to synthetically evaluate visual and non-visual effects by ratio. More parameters, however, are used in lighting design, whose essential relationships are worth investigating. Spectral sensitivity curves in Fig.1 illustrate that visual and non-visual systems responded differently to spectral peaks. According to Eq.(2), it can be concluded that visual efficacy and non-visual efficacy have spectral dependence, which means that their evaluation models inevitably depend on spectrum. This objective reality induces us to find out the relationship of evaluation models through spectral sensitivity curves, and the newacvmodel proved its effectiveness.
Compared with BelliaCLAmodel[13], the integrated model showed an unequivocal link with CIE 1931XYZchromaticity coordinate,RSPfactor, and illuminance, which suggests the compatibility between the integrated model and traditional lighting evaluation methods. It has been known that orthodox illuminance based uponV(λ) has been implemented for a long time, and conventional parameterRSPis employed in the estimation of mesopic lighting. The CIE 1931XYZchromaticity diagram is still useful for colorimetry. Thus, the integrated model has a practical significance in photobio-friendly mesopic lighting design, and the second condition in Section 4 is a good example.
6 Conclusions
In this work, a well-founded theory was proposed to express circadian sensitivity function by other spectral sensitivity curves, which is practical in light engineering. The synthesis method is based on mathematics, rather than on physiological basis.
According toC′(λ), a newacvmodel was derived from the original model. The newacvmodel, consisting of CIE 1931xycoordinates and scotopic/photopic ratio, clearly showed the intrinsic link among evaluation parameters of the light source from a novel perspective. It is helpful to analyze and design lighting spectrum, especially mesopic vision spectrum.
The integrated model was revised from BelliaCLAmodel with the newacvmodel. Then, a bridge among non-visual, photopic, scotopic, and mesopic evaluation parameters was established. The simplified discriminant factorΔzthat only depends on CIE 1931xycoordinates enhanced the flexibility of the integrated model.
Spectra analysis implied that the integrated model is not only a practical method of evaluating mesopic circadian effects, but also a helpful method to design spectrum considering non-visual, photopic, and mesopic efficacy.
Although more experimental research is needed to examine the accuracy of the integrated model in predicting melatonin suppression, it is believed that the integrated model will play a significant role in future healthy mesopic lighting design.
杂志排行

Journal of Harbin Institute of Technology(New Series)的其它文章
- Iterative Learning Controller Design for CNC Machine Tools
- Dynamic Reconfigurable Structure with Rate Distortion Optimization
- Analogy Theory and Application of Pressure Difference of Wind Turbine Blade Profile
- Fault Attribute Reduction of Oil Immersed Transformer Based on Improved Imperialist Competitive Algorithm
- Study on Lubricant Materials Transfer between Head and Disk
- A Combined Alignment Method for Strapdown Inertial Navigation System on Stationary Base