基于GRACE重力卫星数据的珠江流域干旱监测
2020-12-25邓梓锋吴旭树王兆礼陈晓宏
邓梓锋,吴旭树,王兆礼,2,李 军,陈晓宏
基于GRACE重力卫星数据的珠江流域干旱监测
邓梓锋1,吴旭树1,王兆礼1,2※,李 军1,陈晓宏3
(1. 华南理工大学土木与交通学院,广州 510640;2. 华南理工大学亚热带建筑科学国家重点实验室,广州 510641;3. 中山大学水资源与环境研究中心,广州 510275)
为探究重力恢复和气候试验任务(Gravity Recovery and Climate Experiment mission,GRACE)卫星数据在干旱研究中的应用潜力,该研究采用基于GRACE重力卫星数据的无量纲的标准化水储量赤字干旱指数(Water Storage Deficit Index,WSDI)对珠江流域2002—2017年进行干旱监测,通过将其和常用干旱指数与实际干旱质心轨迹进行对比,评估其在珠江流域的干旱监测效用。研究结果表明:1)2002—2017年期间,WSDI监测到的旱情与实际发生的旱情基本一致,GRACE重力卫星数据能捕捉到干旱事件的发生、发展和消亡以及其干旱特征;2)WSDI的时间变化及其对气候异常的响应与常用干旱指数吻合良好,具有有着较强的相关性,且能反映研究区长期的综合水分变化。除了SPI-3与SPEI-3外,其他常用干旱指数与WSDI的相关系数都在0.665以上,其中scPDSI相关指数最高,为0.803;3)WSDI与常用干旱指数在空间上描述的干旱事件的干旱质心轨迹基本一致,都能大致反映出了大范围干旱事件的干旱质心从东往西移动的现象。WSDI能从时间和空间上刻画出研究区水文干旱的演变规律,适用于大尺度水文干旱的监测与评估,具有明显的优势和应用潜力。
干旱;GRACE重力卫星;标准化水储量赤字干旱指数;效用评估;珠江流域
0 引 言
随着全球气候变化,极端气候事件发生的频率和强度日益增加。干旱是世界上破坏性最大、代价最高的极端气候事件之一,有着发展缓慢、持续时间长、受灾面积大、严重程度深的特点[1]。干旱监测与评估的研究对减灾防灾有重大意义。干旱是区域性的,其明显的表现是陆地水储量低于历史平均水平(陆地水储量是地表水、生物水、土壤水、地下水和雪/冰的总和)。GRACE(Gravity Recovery and Climate Experiment mission)重力卫星为监测陆地储水量的变化提供了一种长期有效的方法。其优势在于能不受地面条件的限制进行连续、快速且重复地观测,有效解决地面观测范围不深、空间分布不均匀、资料获取不充分以及水文模型分布不均匀等问题,能得到全球分布均匀,且观测尺度统一的数据[2-3]。研究表明,GRACE重力卫星在干旱研究和应用方面有着巨大的潜力[4]。因此,利用GRACE重力卫星进行干旱监测成为了干旱研究领域的研究热点之一。
GRACE重力卫星在干旱方面的研究和应用有着重大的意义,国内外也已经开展了相关的研究工作。在国外,GRACE重力卫星干旱研究领域的研究和应用较为充分。在中欧地区、美国得克萨斯州,Houborg等[2,5]将同化后的GRACE重力卫星数据驱动水文模型,提高了水文模型表征干旱的准确性,且将其研究应用于实际的干旱监测。Thomas等[6]建立了基于GRACE陆地水储量赤字(Terrestrial Water Storage Deficit,TWSD)的评估框架来探究水文干旱特征,并在多流域验证了该方法的适用性。在美国大陆,Zhao等[7]提出了一个考虑GRACE测量和泄漏误差的干旱严重指数(GRACE satellite-based drought severity index)。Cammalleri等[8]指出,气象干旱指数显示的降水不足可作为GRACE观测到的水文干旱的局部代用指数。Sinha等[9]将降水偏差和陆地水储量相结合作为干旱评价指数对印度主要流域进行干旱特征表征。另外,一些学者还使用GRACE重力卫星监测幼发拉底河-底格里斯河[10]、亚马逊河流域[11]、乌干达[12]等大尺度区域在干旱期间的陆地水储量消耗程度。而在国内,GRACE重力卫星干旱研究领域的研究和应用则相对薄弱。在干旱特征最为明显的中国西南地区,Long等[13-16]利用GRACE陆地水储量变化(Terrestrial Water Storage Change,TWSC)指数进行干旱特征监测,并发现高原地区干旱的频率和严重程度都在加剧。Zhang等[17-18]利用GRACE陆地水储量异常(Terrestrial Water Storage Anomaly,TWSA)指数分别监测了长江流域、黄河源区的干旱事件,验证该指数的适用性。
然而,由于陆地水储量在不同水文气候区的较弱空间相似性以及水文模型本身和驱动数据的不确定性,已有的大部分研究缺乏空间可比性。不同地区的陆地水储量不尽相同,基于TWSC、TWSA、TWSD等有量纲指数的相互比较是非常困难的,而无量纲标准化指数具有空间可比性,能在不同地区间甚至相同地区不同网格间相互比较。当前关于采用基于GRACE重力卫星数据的无量纲标准化干旱指数进行干旱监测分析与干旱质心轨迹方面的评估以及综合评估其干旱监测效用的研究在国内仍较为少见。另外,珠江流域有着降水时空分布不均匀的特性,干旱灾害时常出现,且GRACE重力卫星数据在该流域的干旱研究与应用相对较少。
综上所述,本研究采用基于GRACE重力卫星数据的无量纲的标准化水储量赤字干旱指数WSDI(Water Storage Deficit Index)对珠江流域进行干旱监测,并将WSDI与常见的干旱指数作对比,评估其在珠江流域的干旱监测效用,为大尺度水文干旱监测与评估提供新的方法。
1 研究区、数据与方法
1.1 研究区概况
珠江流域(102°14′~115°53′E,21°31′~26°49′N)地处热带和亚热带季风气候区,年平均气温在14~22 ℃之间,多年平均降水量约1 200~2 000 mm,地貌以山地丘陵为主。珠江流域雨量充沛,特点是历时长、强度大,但时空分布不均匀导致干旱现象时常出现。虽然近年来珠江流域的总降水量呈现增加的趋势[19],但是随着气温的升高导致的蒸散发作用不断增强,极端气候事件的发生频率增加,珠江流域的干旱问题越来越严重[20]。在2004、2009—2011年等年份珠江流域都发生严重旱灾,部分河溪断流,农业、畜牧业受损严重,下游大湾区咸潮上溯,威胁供水安全。而小干旱灾害几乎每年都会发生。
1.2 数据获取与处理
1.2.1 GRACE重力卫星数据
GRACE重力卫星数据是由GRACE重力卫星收集并经数据中心进行解算获得,数据空间覆盖范围为全球,表面空间分辨率通常约为1°,时间分辨率为1个月[21]。GRACE重力卫星适用于大尺度区域的研究,研究区域面积需要在2×10⁵km2以上,其数据精度才能满足质量要求[22]。
本研究采用德克萨斯大学空间研究中心(Center for Space Research at University of Texas, Austin,CSR)和美国喷气动力实验室(Jet Propulsion Laboratory,JPL)公布的GRACE的Level-2 RL06的GSM数据,GRACE重力卫星数据的时间范围为2002年4月至2017年6月,共163个月。由于卫星测量时电力不足或卫星振动导致20个月的数据缺失。因此,本研究采用了线性插值的方法填补GRACE重力卫星数据的缺失值[23-24],该方法简单且被广泛采用。但是,数据的季节性变化不可避免地会被线性插值的方法所忽略,从而导致所识别的干旱事件的特征有误差。但这些误差不会对干旱评估造成显著的影响。对GRACE数据按照以下步骤进行处理,并得到陆地水储量数据:
1)采用卫星激光测距数据代替GRACE重力卫星数据的20(2次0阶球谐系数,即地球动态扁率)时间序列,并采用海洋和大气模型的1阶重力系数的估算值补充GRACE重力卫星数据的1阶重力系数的缺失[25]。
2)采用Swenson等[25]提出的去相关滤波器和300 km高斯滤波器[26]降低信号噪声。并将滤波后的GRACE重力卫星数据的球谐系数截至60阶次。
3)对经过滤波处理和截取球谐系数的数据采用“尺度因子”进行信号恢复[27]。
4)将算得的GRACE球谐系数数据转换成空间分辨率为0.25°的TWSA栅格数据。由于GRACE重力卫星数据中存在噪声,因此在进行干旱分析之前,对GRACE TWSA进行3个月的滑动平均滤波处理。
本研究在Feng开发的GRACE_Matlab_Toolbox[28]的基础上完善代码,对GRACE重力卫星数据进行处理,陆地水储量以等效水高表示。
1.2.2 其他数据
本研究采用反映不同类型干旱的指数作为参考。采用珠江流域183个地面气象观测站点所观测到的2001—2017年逐日的气象资料计算标准化降水指数(Standardized Precipitation Index,SPI);采用Penman-Monteith方法计算潜在蒸散发量,采用潜在蒸散发量和降水量计算标准化降水蒸散指数(Standardized Precipitation Evapotranspiration Index,SPEI);采用Variable Infiltration Capacity(VIC)模型估算的径流数据计算标准化径流指数(Standardized Runoff Index,SRI)[29];采用VIC模型取代原始PDSI中的双层土壤模型,计算自校正的帕默尔干旱强度指数(Self-Calibrating Palmer Drought Severity Index,scPDSI)[29]。所有指数都插值为空间分辨率0.25°的栅格数据。SPI与SPEI反映气象干旱,SRI、scPDSI分别反映水文干旱和农业干旱。以上常用干旱指数现已被广泛用于气候变化对珠江流域干旱影响的研究[30-33]。气象数据可在中国气象局气象数据中心网站下载(http://data.cma.cn),水文数据来源于珠江水利委员会与广东省水文局。
1.3 研究方法
TWSD为Thomas等提出的一种基于GRACE陆地水储量的水文干旱监测指数,具体计算方法参考文献[6]。TWSD的时间序列消除了季节性因素对陆地水储量的干扰,得以更好地表征干旱特征。每月的TWSD是一种直接的度量指数,其表示水储量偏离正常水文状况的量。当TWSD的值小于0时,可以用TWSD来表征干旱。然而TWSD在干旱监测中有一定的局限性,有着空间可比性较弱、缺乏明确的干旱分类体系等缺点。不同水文气候区域条件不能直接用TWSD进行比较。因此,采用无量纲的标准化水储量赤字指数WSDI对流域进行干旱分析[34]
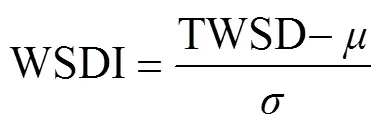
WSDI时间序列中的负值表示陆地水储量低于研究期内的历史平均水平,可用于表征干旱。根据WSDI的标准偏差定义其干旱分类。标准化的WSDI在不同水文气候区域之间具有空间可比性。
另外,由于采用的处理策略、调优参数和误差模式不同,不同解算机构的GRACE重力卫星数据有一定的差异。为了降低该差异导致的误差从而提高数据的精确性,采用JPL与CSR的TWSA的平均值计算TWSD,进而计算WSDI。
与TWSD相同,连续3个月或以上出现WSDI为负值则为干旱事件[14]。根据WSDI的值和干旱历时,干旱事件的严重程度可定义为干旱事件内WSDI小于0的时间积分。需要注意的是,只有当干旱事件结束(WSDI不再小于0)时,干旱严重程度和干旱历时才可确定,以对水文干旱事件进行量化。而每月的WSDI可作为“瞬时观测值”。
4种干旱类型(D0,D1,D2,D3,D4)表示不同的干旱等级。采用由Mckee等[35]提出的分类标准。SPI、SPEI、SRI、scPDSI的干旱分类见表1。不同时间尺度的SPI、SPEI与SRI(3个月,6个月,9个月,12个月,24个月),反映不同时间尺度的水分亏缺时间累积效应。本研究采用了时间尺度为3个月、6个月、12个月的SPI、SPEI、SRI。

表1 各干旱指数的干旱等级划分
注:SPI表示标准化降水指数,SPEI表示标准化降水蒸散指数,SRI表示标准化径流指数,WSDI表示水储量赤字指数,scPDSI表示自校正的帕默尔干旱强度指数。
Note: SPI is the standardized precipitation index. SPEI is the standardized precipitation evapotranspiration index. SRI is the standardized runoff index. WSDI is the water storage deficit index. scPDSI is the self-calibrating palmer drought severity index.
本研究采用以下干旱特征对各干旱事件进行表征:干旱历时,表示对应干旱事件持续的月份数;干旱强度,表示干旱事件的时间范围内的干旱指数的最低值,并以干旱强度判断干旱事件的干旱类型;干旱严重程度,表示干旱事件内干旱指数小于无旱阈值的时间积分;干旱排序,表示各指数干旱事件的干旱严重程度的绝对值从大到小的顺序。
为了评估WSDI的干旱监测在空间上的表现,将对比各指数在研究期内干旱事件的干旱质心轨迹。参考王兆礼等[36]的方法计算各指数干旱质心:先提取出研究区指数的每月“干旱斑块”(即干旱区域)的空间栅格数据,再计算干旱斑块的质心坐标。研究区内干旱事件的干旱质心计算方法如下

式中,LON与LAT分别表示干旱事件的干旱质心经度与纬度。表示研究时段的第个月。表示研究区发生干旱的栅格数,()表示栅格中干旱指数的绝对值,lon与lat分别表()所对应的栅格的经度与纬度。
2 结果与分析
2.1 珠江流域干旱监测分析
2.1.1 基于WSDI的干旱监测
GRACE重力卫星数据在珠江流域的适用性决定其干旱监测的适用性。Luo等[37-38]已经采用多种全球陆面水文模型验证了不同版本的GRACE重力卫星数据在珠江流域的适用性,研究结果都表明珠江流域的TWSA呈增长的趋势。因此,本研究不再对GRACE重力卫星数据在珠江流域的适用性验证进行赘述。图1为WSDI时间序列及其变化趋势图。研究期内,WSDI的变化率为0.13/a,与Luo等[37-38]的研究结果相符。

图1 2002—2017年珠江流域的WSDI变化
表2总结了2002年4月至2017年6月WSDI所监测到的珠江流域的干旱事件。在研究期内,WSDI监测到7场干旱事件。由于GRACE重力卫星从2002年4月开始记录地球重力场资料,因此,2002年4月以前的WSDI是未知的。由图1可见,由于数据缺失,WSDI没有捕捉到1号干旱事件的完整过程,仅记录了该干旱事件的趋向消亡过程。在此,不对1号干旱事件进行干旱分析。如表2所示,2号干旱事件历时最长、旱情最重,除了1号干旱事件外,7号干旱事件的旱情最轻。另外,还可以通过探究每月受不同类型干旱影响的地区的面积比例评估干旱严重程度(图2),干旱类型反映了水量亏缺的程度。从图2可以发现,在所有干旱事件期间,WSDI仍可以监测到研究区部分地区无干旱发生。这是TWSC、TWSA、TWSD在监测干旱时所无法表征的。

表2 WSDI监测到的珠江流域的干旱事件
注:表2和表4中干旱事件的序号表示WSDI所监测的干旱事件发生的先后顺序。1~6号干旱事件为被珠江水利委员记录的干旱事件。2014年后的《水资源公报》并未继续记录灾情,因此,7号干旱事件没有被记录。括号内为干旱强度值所对应的时间。干旱排序表示干旱事件的干旱严重程度绝对值从大到小的顺序。
Note: The sequence number of drought events is the order of drought events monitored by WSDI. Drought events No.1-6 are recorded by the Pearl River Water Resources Commission of the Ministry of Water Resources. The No.7 drought event is not recorded because post-2014 Bulletin of Water Resources does not continue to record the disasters. The time in brackets is the time corresponding to the drought intensity value. The drought order is the order of absolute values of the drought severity of drought events in descending order in table 2 and table 4.

图2 2002—2017年珠江流域受不同类型干旱影响地区的面积比例
将WSDI监测到的旱情与2002—2017年的珠江水利委员会所记录的旱情[39]进行比较,两者对珠江流域旱情的描述基本一致,WSDI几乎能监测到所记录的所有干旱。根据珠江水利委员会记录,2009—2013年每年都发生干旱,其中2010年上半年云南、贵州和广西发生特大干旱,2011年汛期珠江流域内部分地区干旱严重,该年8月下旬旱情最为严重,2012年旱涝灾害交替出现,2013年局部地区伏旱(7月中旬至8月中旬)严重。图1、图 2、表2的结果表明,2009年初干旱发生且持续多月,随后2010年上半年局部地区遭受严重干旱影响,该时期对应的4号干旱事件的干旱严重程度仅次于2号干旱事件。2011年8月遭受严重干旱影响的地区面积占比最高(21.4%)且干旱持续至2012年初,2012年汛期多地出现水量增加现象且伴随洪涝风险,2013年的6号干旱事件与该年伏旱发生时间和历时大致吻合。
2.1.2 WSDI与常用干旱指数在时间上的对比分析
将WSDI与SPI、SPEI、SRI、scPDSI进行对比分析,进一步探究WSDI在珠江流域的干旱监测效用,并分析WSDI与它们的差异。由于GRACE重力卫星运行末期的稳定性下降,有较多月份的数据缺失,且测量误差较大[22]。因此,本文截取2002年4月至2015年12月的WSDI与常用干旱指数作对比分析。
计算了WSDI与SPI、SPEI、SRI、scPDSI的皮尔森相关系数(置信区间为95%,表3)。结果表明,WSDI与SPI-6、SPI-12、SPEI-6、SPEI-12、SRI-3、SRI-6、SRI-12、scPDSI吻合良好。除了SPI-3、SPEI-3外,其他干旱指数都和WSDI的相关性较强,其中scPDSI与WSDI的相关系数最高,两者的时间变化具有相似的波峰和波谷(图 3)。这与Sinha等[40-41]的研究结果相符。

表3 珠江流域WSDI与常用干旱指数的相关系数
注:指数中的数字代表该指数3、6、12个月的时间尺度。
Note: The number in the index represents the time scale of 3, 6, and 12 month, respectively.

图3 2002—2015年珠江流域的WSDI与scPDSI变化
为了进一步评估WSDI的干旱监测在时间上的表现,将对比各指数在研究期内所监测到的干旱事件的特征。连续3个月或以上出现干旱指数小于无旱阈值则视为一次干旱事件。长时间尺度的干旱指数可以反应长期的气候变化情况,一定程度上考虑到径流、地下水、深层土壤水的变化情况。在4类常用干旱指数中,SPI-12、SPEI-12、SRI-12、scPDSI在研究期内所监测到的干旱事件与WSDI所监测到的干旱事件的场次、时间范围、干旱强度的对应时间最为相近。因此,总结了WSDI、SPI-12、SPEI-12、SRI-12、scPDSI所监测到的珠江流域的干旱事件(表2、表4)。以WSDI所监测到的干旱事件的序号作为干旱事件的标签。结果表明,SPI-12、SPEI-12、SRI-12在干旱监测中有较高的一致性。研究期内,WSDI和scPDSI监测到7个干旱事件,而SPI-12、SPEI-12、SRI-12监测到4个干旱事件,且这4个干旱事件都能被WSDI监测到。各干旱指数所监测到的大部分干旱事件都被珠江水利委员会所记录。

表4 不同指数监测到的珠江流域的干旱事件
注:当该表中的指数监测到的干旱事件同样被WSDI监测到时,其序号以WSDI的干旱事件序号表示;当该表中的指数监测到的干旱事件未被WSDI监测到时,其序号以“-”表示。部分指数在WSDI干旱事件的时间范围内监测到多场干旱事件,则干旱事件序号中的第2个数字表示这些干旱事件在该时间范围内发生的先后顺序。
Note: When a drought event monitored by the index in this table is also monitored by WSDI, its sequence number is represented by the drought event sequence number of WSDI; when a drought event monitored by the index in this table is not monitored by WSDI, its sequence number is represented by "-". Part of the indexes identified multiple drought events within the time span of the WSDI drought event, and the second number in the sequence number of drought event indicates the order of these drought events within that time span.
2.1.3 WSDI与常用干旱指数在空间上的对比分析
为了进一步评估WSDI的干旱监测在空间上的表现,将对比各指数在研究期内所监测到的干旱事件的干旱质心轨迹。本节以WSDI的干旱事件和干旱时间范围作为对照,进一步对比了2、3、4、5号干旱事件中WSDI、SPI-12、SPEI-12、SRI-12、scPDSI的干旱质心的移动轨迹。由于在整个流域的干旱事件开始前和结束后会有局部地区发生干旱,而这些局部地区的干旱无法从整个流域的干旱指数时间序列中得到体现。因此,其他干旱指数在干旱事件开始前和结束后仍会有干旱质心。干旱事件历时较长,为避免结果的表示出现混淆,在表示干旱质心轨迹时,每3个月标记一次干旱质心。结果表明,WSDI与常用干旱指数的干旱质心轨迹基本一致,各指数的3、4、5号干旱事件的干旱质心呈现从东往西移动的现象。以scPDSI为例,图4和图5展示了的WSDI和scPDSI在干旱事件中的干旱质心轨迹,除了2号干旱事件的干旱质心呈现东西向的周期性移动的现象外,其他干旱事件的干旱质心呈现从东往西移动的现象,与黄强等人[42]研究的2009年5月至2010年8月的干旱事件发展过程相符。而2号干旱事件的干旱质心轨迹与其他干旱事件之间的差异可能是因为该事件的干旱历时相对较长。
2.2 讨 论
各干旱指数在监测干旱中的差异,最主要是由各干旱指数计算所用的数据和方法不同导致的。scPDSI是个相对综合的干旱指数,因此和WSDI的相关性最强。相同时间尺度下,WSDI与SPI的相关性比WSDI与SPEI的略强。这说明在珠江流域降水对WSDI的影响大于降水与蒸散发的差值对WSDI的影响[34]。WSDI与不同时间尺度SRI的相关性都相对较强,这说明径流和土壤水分特征对珠江流域的陆地水储量影响较大[43]。这可能是因为珠江流域中上游的喀斯特地貌特征,使得降水进入地下并迅速渗透进入河流,导致地表径流率高[13,44]。
不同时间尺度的相同干旱指数与WSDI的相关性不同。相对于其他流域,珠江流域的地表水资源更为丰富。SPI-6对地表水资源的响应相对强烈,因此,在珠江流域,WSDI与SPI-6的相关性比WSDI与SPI-12的更强,与Nie等[41]的研究结果相符。而对于时间尺度较短的SPI-3和SPEI-3,它们对土壤水分条件响应较为快速、强烈,反映的是中短期的水分状况,并有着明显的季节性。因此,已经去除了季节性因素且用于反映长期水储量变化的WSDI与SPI-3、SPEI-3相关性较弱。另外,相对于SRI-6,SRI-12对WSDI有着明显的时滞性,则在不消除时滞性的情况下,WSDI与SPI-6的相关性相对较强。
WSDI的显著优势在于,它能从陆地各层(包括地下水)存储的水量全面地考虑干旱情况且考虑了人类活动对水文通量的影响,而常用干旱指数通常仅考虑部分水文通量。在珠江流域中上游的喀斯特地貌地区,地表水与地下水之间复杂的相互联系使得大部分水文模型和观测方法难以捕捉到这些地区准确的水分变化[4],因此常用干旱指数难以对这些地区的干旱进行准确的监测。而WSDI基于GRACE重力卫星观测资料,有着观测范围深,空间分布均匀,资料获取容易的优点。总体而言,WSDI具有较大的应用潜力,能从时间和空间上刻画出研究区干旱的时空演变规律,特别是对于面积大且水文气象站点稀少的区域。

图4 珠江流域不同干旱事件WSDI干旱质心轨迹

图5 珠江流域不同干旱事件scPDSI干旱质心轨迹
而WSDI的局限性在于,WSDI完全基于GRACE TWSA,TWSA的准确性决定WSDI的准确性。TWSA时间序列相对较短,导致其多年平均值不足以具有代表性。WSDI时间序列并不平稳,基于WSDI的干旱严重程度在前期可能会被高估,在后期可能会被低估[34,45]。有学者认为至少30 a的TWSA时间序列才是比较可取的[6,37]。另外,GRACE在运行末期的稳定性下降,一定程度上影响该时期WSDI的准确性。这些因素都使得利用WSDI进行干旱监测分析仍具有不确定性,但GRACE重力卫星仍是监测全球陆地水储量最为有效的手段[3]。
3 结 论
本研究采用基于GRACE重力卫星数据的无量纲的标准化水储量赤字干旱指数WSDI对珠江流域2002—2017年进行了干旱监测,并将WSDI与常用的干旱指数SPI、SPEI、SRI、scPDSI等作对比分析,评估其在珠江流域的干旱监测效用。主要结论如下:
1)2002—2017年期间,WSDI指数监测到了7场干旱事件,与实际发生的旱情基本一致,GRACE重力卫星数据捕捉干旱事件的发生、发展和消亡以及其干旱特征。
2)除了反映中短期水分状况、有着明显季节性的SPI-3、SPEI-3外,WSDI与SPI-6、SPI-12、SPEI-6、SPEI-12、SRI-3、SRI-6、SRI-12、scPDSI吻合良好,与它们有着较强的相关性,其中与能综合表征干旱的scPDSI的相关性最强。WSDI更能反映研究区中长期的综合水分变化,能监测到由陆地各层水分亏缺引起的干旱事件。
3)WSDI、SPI-12、SPEI-12、SRI-12、scPDSI在空间上描述的干旱事件干旱质心轨迹基本一致,都能大致反映出大范围干旱事件的干旱质心从东往西移动的现象。WSDI具有空间可比性、较强的独立性和明确的干旱分类体系,能从时间和空间上刻画出研究区域干旱的演变规律,适用于大尺度水文干旱的监测与评估,具有较大的应用潜力。
[1] Lu Hao, Zhang Xiaoyu, Liu Shoudong. Risk assessment to China’s agricultural drought disaster in county unit[J]. Natural Hazards, 2012, 61: 785–801.
[2] Houborg R, Rodell M, Li Bailing, et al. Drought indicators based on model-assimilated Gravity Recovery and Climate Experiment (GRACE) terrestrial water storage observations[J]. Water Resources Research, 2012, 48(7): W07525. 1-W07525. 17.
[3] 郑秋月,陈石. 应用GRACE卫星重力数据计算陆地水变化的相关进展评述[J]. 地球物理学进展,2015,134(6):177-189. Zheng Qiuyue, Chen Shi. Review on the recent developments of terrestrial water storage variations using GRACE satellite-based datum[J]. Progress in Geophysics, 2015, 134(6): 177-189. (in Chinese with English abstract)
[4] Famiglietti J S, Rodell M. Water in the Balance[J]. Science, 2013, 340(6138): 1300-1301.
[5] Li Bailing, Matthew Rodell, Benjamin Frederick Zaitchik, et al. Assimilation of GRACE terrestrial water storage into a land surface model: Evaluation and potential value for drought monitoring in western and central Europe[J]. Journal of Hydrology, 2012, 446: 103-115.
[6] Thomas A C, Reager J T, Famiglietti J S, et al. A GRACE-based water storage deficit approach for hydrological drought characterization[J]. Geophysical Research Letters, 2014, 41(5): 1537-1545.
[7] Zhao M, Geruo A, Velicogna I, et al. Satellite observations of regional drought severity in the continental United States using GRACE-based terrestrial water storage changes[J]. Journal of Climate, 2017, 30(16): 6297-6308.
[8] Cammalleri C, Barbosa P, Vogt J V. Analysing the relationship between multiple-timescale SPI and GRACE terrestrial water storage in the framework of drought monitoring[J]. Water, 2019, 11(8): 1672.
[9] Sinha D, Syed T H, Reager J T. Utilizing combined deviations of precipitation and GRACE-based terrestrial water storage as a metric for drought characterization: A case study over major Indian river basins[J]. Journal of Hydrology, 2019, 572: 294-307.
[10] Chao Nengfang, Luo Zhicai, Wang Zhengtao, et al. Retrieving groundwater depletion and drought in the Tigris-Euphrates basin between 2003 and 2015[J]. Ground Water, 2018, 56(5): 770-782.
[11] Chen J L, Wilson C R, Tapley B D, et al. 2005 drought event in the Amazon River basin as measured by GRACE and estimated by climate models[J]. Journal of Geophysical Research Solid Earth, 2009, 114(5): B05404.
[12] Christelle Kyatengerwa, Daeha Kim, Minha Choi. A national-scale drought assessment in Uganda based on evapotranspiration deficits from the bouchet hypothesis[J]. Journal of Hydrology, 2020, 580: 124348.
[13] Long Di, Shen Yanjun, Sun Alexander, et al. Drought and flood monitoring for a large karst plateau in Southwest China using extended GRACE data[J]. Remote Sensing of Environment, 2014, 155: 145-160.
[14] 李琼,罗志才,钟波,等. 利用GRACE时变重力场探测2010年中国西南干旱陆地水储量变化[J]. 地球物理学报,2013(6):65-71. Li Qiong, Luo Zhicai, Zhong Bo, et al. Terrestrial water storage changes of the 2010 southwest China drought detected by GRACE temporal gravity field[J]. Chinese Journal of Geophysics, 2013(6): 65-71. (in Chinese with English abstract)
[15] 李杰,范东明,游为. 利用GRACE监测中国区域干旱及其影响因素分析[J]. 大地测量与地球动力学,2019,39(6):587-595. Li Jie, Fan Dongming, You Wei. Using GRACE to monitor regional drought in China and its influencing factors[J]. Journal of Geodesy and Geodynamics, 2019, 39(6): 587-595. (in Chinese with English abstract)
[16] 贺敏,宋立生,王展鹏,等. 基于多源数据的干旱监测指数对比研究:以西南地区为例[J]. 自然资源学报,2018,33(7):157-169. He Min, Song Lisheng, Wang Zhanpeng, et al. Evaluation of drought monitoring indices based on multi-source data in Southwest China[J]. Journal of Natural Resources, 2018, 33(7): 157-169. (in Chinese with English abstract)
[17] Zhang Zizhan, Chao Beniamin Fong, Chen Jianli, et al. Terrestrial water storage anomalies of Yangtze River Basin droughts observed by GRACE and connections with ENSO[J]. Global and Planetary Change, 2015, 126: 35-45.
[18] 王作亮,文军,李振朝,等. 典型干旱指数在黄河源区的适宜性评估[J]. 农业工程学报,2019,35(21):186-195. Wang Zuoliang, Wen Jun, Li Zhenchao, et al. Evaluation of suitability using typical drought index in source region of the Yellow River[J]. Transactions of the Chinese Society of Agricultural Engineering (Transactions of the CSAE), 2019, 35(21): 186-195. (in Chinese with English abstract)
[19] 王兆礼,陈晓宏,张灵,等. 近40年来珠江流域降水量的时空演变特征[J]. 水文,2006,26(6):71-75. Wang Zhaoli, Chen Xiaohong, Zhang Ling, et al. Spatio-Temporal change characteristics of precipitation in the Pearl River Basin in recent 40 years[J]. Journal of China Hydrology, 2006, 26(6): 71-75. (in Chinese with English abstract)
[20] 王兆礼,陈晓宏,黄国如,等. 近40年来珠江流域平均气温时空演变特征[J]. 热带地理,2007,27(4):289-293,322. Wang Zhaoli, Chen Xiaohong, Hunag Guoru, et al. Spatio-temporal change characteristics of mean temperature in the Pearl River Basin during 1961-2000[J]. Tropical Geography, 2007, 27(4): 289-293, 322. (in Chinese with English abstract)
[21] Vishwakarma B, Devaraju B, Sneeuw N. What is the spatial resolution of GRACE satellite products for hydrology?[J]. Remote Sensing, 2018, 10(6): 852.
[22] Tapley B D, Watkins M M, Flechtner F, et al. Contributions of GRACE to understanding climate change[J]. Nature Climate Change, 2019, 9(5): 358-369.
[23] Long Di, Yang Yuting, Wada Yoshihide, et al. Deriving scaling factors using a global hydrological model to restore GRACE total water storage changes for China's Yangtze River Basin[J]. Remote Sensing of Environment, 2015, 168: 177-193.
[24] Yang Peng, Xia Jun, Zhan Chesheng, et al. Monitoring the spatio-temporal changes of terrestrial water storage using GRACE data in the Tarim River basin between 2002 and 2015[J]. Science of the Total Environment, 2017, 595: 218-228.
[25] Swenson S, Wahr J. Post-processing removal of correlated errors in GRACE data[J]. Geophys Research Letters, 2006, 33(8): 402.
[26] Zhang Zizhan, Chao Beniamin Fong, Lu Yang, et al. An effective filtering for GRACE time-variable gravity: Fan filter[J]. Geophysical Research Letters, 2009, 36(17): L17311.
[27] Rodell M, Famiglietti J S, Chen J L, et al. Basin scale estimate of evapotranspiration using GRACE and other observations[J]. Geophysical Research Letters, 2004, 31(20): 504.
[28] Feng Wei. GRAMAT: A comprehensive Matlab toolbox for estimating global mass variations from GRACE data[J]. Earth Science Informatics, 2019, 12(3): 389-404.
[29] Li Jun, Wang Zhaoli, Wu Xushu, et al. Flash droughts in the Pearl River Basin, China: Observed characteristics and future changes[J]. Science of The Total Environment, 2020, 707: 136074.
[30] 黄翀,张强,陈晓宏, 等. 珠江流域降水干湿时空特征及气候因子影响研究[J]. 水文,2017,37(5):12-20,59. Huang Qiang, Zhang Qiang, Chen Xiaohong, et al. Spatio-temporal variations of dryness/wetness and influence from climate factors in Pearl River Basin[J]. Journal of China Hydrology, 2017, 37(5): 12-20, 59. (in Chinese with English abstract)
[31] 黄强,陈子遷,刘占明, 等. 珠江流域区域干旱风险评估[J]. 中山大学学报:自然科学版,2013,52(5):140-147,152. Huang Qiang, Chen Zishen, Liu Zhanming, et al. Regional drought risk assessment across the Pearl River Basin[J]. Acta Scientiarum Naturalium Universitatis Sunyatseni, 2013, 52(5): 140-147, 152. (in Chinese with English abstract)
[32] Sheffield J, Wood E F, Roderick M L. Little change in global drought over the past 60 years[J]. Nature, 2012, 491(7424): 435–438.
[33] Shukla S, Wood A W. Use of a standardized runoff index for characterizing hydrologic drought[J]. Geophysical Research Letters, 2008, 35(2): L02405.
[34] Sun Zhangli, Zhu Xiufang, Pan Yaozhong, et al. Drought evaluation using the GRACE terrestrial water storage deficit over the Yangtze River Basin, China[J]. Science of the Total Environment, 2018, 634: 727-738.
[35] McKee T, Doesken N, Kleist J. Drought monitoring with multiple time scales[C]//Boston: Proceedings of the ninth conference on applied climatology, 1995. 233-236.
[36] 王兆礼,钟睿达,陈家超,等. TMPA卫星遥感降水数据产品在中国大陆的干旱效用评估[J]. 农业工程学报,2017,33(19):163-170. Wang Zhaoli, Zhong Ruida, Chen Jiachao, et al. Valuation of drought utility assessment of TMPA satellite-remote-sensing- based precipitation product in mainland China[J]. Transactions of the Chinese Society of Agricultural Engineering (Transactions of the CSAE), 2017, 33(19): 163-170. (in Chinese with English abstract)
[37] Luo Zhicai, Yao Changlong, Li Qiong, et al. Terrestrial water storage changes over the Pearl River Basin from GRACE and connections with Pacific climate variability[J]. Geodesy and Geodynamics, 2016, 3: 171-179.
[38] 陈智伟,张兴福,冉将军,等. 利用新版GRACE时变模型反演珠江流域陆地水储量变化[J]. 大地测量与地球动力学,2020,40(3):305-310. Chen Zhiwei, Zhang Xingfu, Ran Jiangjun, et al. Terrestrial water storage changes in Pearl River Region derived from the latest release temporal gravity field models[J]. Journal of Geodesy and Geodynamics, 2020, 40(3): 305-310. (in Chinese with English abstract)
[39] 水利部珠江水利委员会. 水资源公报[R/OL]. [2004-11-07]. http: //www. pearlwater. gov. cn/zwgkcs/lygb/szygb/.
[40] Sinha D, Syed T H, Famiglietti J S, et al. Characterizing drought in India using GRACE observations of terrestrial water storage deficit[J]. Journal of Hydrometeorology, 2017, 18(2): 381-396.
[41] Nie Ning, Zhang Wanchang, Chen Hao, et al. A global hydrological drought index dataset based on gravity recovery and climate experiment (GRACE) data[J]. Water Resources Management, 2018, 32(4): 1275-1290.
[42] 黄强,陈子燊,唐常源,等. 珠江流域重大干旱事件时空发展过程反演研究[J]. 地球科学进展,2019,34(10):1050-1059. Huang Qiang, Chen Zishen, Tang Changyuan, et al. Monitoring the spatio-temporal process of severe droughts in the Pearl River Basin[J]. Advance in Earth Science, 2019, 34(10): 1050-1059. (in Chinese with English abstract)
[43] Liu L, Hong Y, Bednarczyk C N, et al. Hydro-climatological drought analyses and projections using meteorological and hydrological drought indices: A case study in Blue River Basin, Oklahoma[J]. Water Resources Management, 2012, 26(10): 2761-2779.
[44] Guo F, Jiang G H, Yuan D X, et al. Evolution of major environmental geological problems in karst areas of Southwestern China[J]. Environmental Earth Sciences, 2013, 69(7), 2427-2435.
[45] Zhang Dan, Zhang Qi, Werner A D, et al. GRACE-based hydrological drought evaluation of the Yangtze River Basin, China[J]. Journal of Hydrometeorology, 2016, 17(3): 811-828.
Drought monitoring based on GRACE data in the Pearl River Basin, China
Deng Zifeng1, Wu Xushu1, Wang Zhaoli1,2※, Li Jun1, Chen Xiaohong3
(1.,,510640,;,,510641,; 3.,,510275,)
Intensity and frequency of extreme climate events are ever-increasing, as the global climate is changing all the time. Drought has caused the tremendous impact and destruction on water resources, natural ecological environment, agricultural production, as well as the social and economic development. Therefore, the drought monitoring and evaluation are necessary to make emergency measures, thereby to reduce the loss triggered by the drought. However, the drought behaves an obviously temporal and spatial characteristics, one of which the terrestrial water storage has been lower than the historical average. Note that the terrestrial water storage is the sum of surface water, biowater, soil moisture, groundwater, and snow/ice. Fortunately, the Gravity Recovery and Climate Experiment mission (GRACE) satellite can provide a long-term and effective method to in-situ monitor the changes in terrestrial water storage. A continuous, rapid, and repetitive observation can be conducted in the GRACE gravity satellite, without being restricted by ground conditions. The global data with uniform distribution and observation scale can be obtained, to effectively solve the problems related to the depth of ground observation, insufficient data acquisition, uneven distribution of spatial and hydrological models. In this study, a dimensionless standardized Water Storage Deficit Index (WSDI) based on GRACE data was proposed to monitor drought in the Pearl River Basin from April 2002 to June 2017. A systematic evaluation was made to explore the capability of WSDI for the spatiotemporal variation of drought, and thereby to identify the drought events, compared with the common drought indexes, including the Standardized Precipitation Index (SPI), Standardized Precipitation Evapotranspiration Index (SPEI), Standardized Runoff Index (SRI), and Self-Calibrating Palmer Drought Severity Index (scPDSI). The WSDI was calculated by the GSM data from the GRACE Level-2 RL06 published by CSR (Center for Space Research) and JPL (Jet Propulsion Laboratory). The SPEI and SPI were calculated by the meteorological data collected from 183 meteorological stations in the Pearl River Basin, and then interpolated with the Kriging method. The SRI and scPDSI were calculated by the output data from the Variable Infiltration Capacity (VIC) land surface hydrological model. The drought events were analyzed during 2002 to 2015 which monitored by the WSDI and common drought indexes, compared with the drought centroid trajectories of drought events. The results showed that: 1) In the 7 drought events monitored by the WSDI during 2002 to 2017, the drought events from 2003 to 2006 were the worst with the longest drought duration, the highest drought intensity, and the greatest drought severity. Evaluation of drought in the Pearl River Basin showed that the drought situation monitored by the WSDI was basically consistent with the actual drought situation recorded by the Pearl River Water Resource Commission of the Ministry of Water Resources. It verified that the GRACE data can be used to capture the occurrence, development, and disappearance of drought events, together with the drought characteristics; 2) The time variation of WSDI and its response to climate anomalies were in good agreement with the SPI-6, SPI-12, SPEI-6, SPEI-12, SRI-3, SRI-6, SRI-12, and scPDSI, indicating the similar peaks and troughs. It infers that there was a strong correlation with the WSDI. Specifically, the WSDI had the highest Pearson correlation coefficient with the scPDSI (0.803,<0.05), which can comprehensively describe drought, whereas, a low Pearson correlation coefficients with the SPI-3 and SPEI-3, which have obviously seasonal characteristics to reflect the condition of short- and medium-term moisture. The WSDI can better reveal comprehensive water changes in the mid-and-long term for the study area, and thereby it can be used to monitor drought events caused by the water deficit in all layers of land; 3) The centroid trajectories of drought events recorded by the WSDI was basically consistent with those recorded by the SPI-12, SPEI-12, SRI-12, scPDSI, where the drought centroid of large-scale drought events appeared a movement from eastern to western regions. This result demonstrated that the WSDI can be used to reasonably represent the spatiotemporal changes of drought. Therefore, the WSDI has obvious advantages and application potentials suitable for monitoring and evaluation of large-scale hydrological drought. The finding can provide valuable information and a new data source in the large-scale monitoring and assessment for hydrological drought.
drought; GRACE satellite; water storage deficit index; capability evaluation; Pearl River Basin
邓梓锋,吴旭树,王兆礼,等. 基于GRACE重力卫星数据的珠江流域干旱监测[J]. 农业工程学报,2020,36(20):179-187.doi:10.11975/j.issn.1002-6819.2020.20.021 http://www.tcsae.org
Deng Zifeng, Wu Xushu, Wang Zhaoli, et al. Drought monitoring based on GRACE data in the Pearl River Basin, China[J]. Transactions of the Chinese Society of Agricultural Engineering (Transactions of the CSAE), 2020, 36(20): 179-187. (in Chinese with English abstract) doi:10.11975/j.issn.1002-6819.2020.20.021 http://www.tcsae.org
2020-05-15
2020-09-10
国家自然科学基金项目(51879107);广东省水利科技创新项目(2020-19)
邓梓锋,博士生,主要从事水文水资源研究。Email:zifengdeng_scut@163.com
王兆礼,博士,教授,主要从事水文水资源研究。Email:wangzhl@scut.edu.cn
10.11975/j.issn.1002-6819.2020.20.021
S127
A
1002-6819(2020)-20-0179-09