Multi-factor Comprehensive Prediction of Delay Time through Congested Road Sections
2020-12-18
1.School of Mining Engineering,North China University of Science and Technology,Tangshan,Hebei,063210,China
2.School of Construction Engineering,North China University of Science and Technology,Tangshan,Hebei,063210,China
3.School of Information Engineering,North China University of Science and Technology,Tangshan,Hebei,063210,China
Keywords:
Delay time prediction
Grey correlation analysis
Data fitting
ABSTRACT
The navigation software uses the positioning system to determine the traffic conditions of the road sections in advance,so as to predict the travel time of the road sections.However,in the case of traffic congestion,the accuracy of its prediction time is low.After empirical analysis,this paper establishes a multi-factor synthesis by studying 7 factors:traffic flow,number of stops,traffic light duration,road network density,average speed,road area,and number of intersections the prediction function achieves the purpose of accurately predicting the transit time of congested road sections.The gray correlation coefficients of the seven factors obtained from the gray correlation analysis are:0.9827,0.9679,0.6747,0.8030,0.9445,0.8759,0.4328.The correlation coefficients of traffic volume,number of stops,average speed,and road congestion delay time were all about 95%,which were the main influencing factors of the study.The prediction needs to be based on functions.This paper fits the main influencing factors to the delay time of congested roads.It is found that the delay time varies parabolically with the traffic flow and the number of stops,and linearly with the average speed.Because the three impact factors have different weights on the delay time of congested roads,demand takes the weight of each factor.Therefore,the gray correlation coefficients occupied by the main influencing factors are normalized to obtain the weights of three of 0.340,0.334,and 0.326.The weighted fitting function is subjected to nonlinear summation processing to obtain a multi-factor comprehensive prediction function.By comparing the original data with the fitting data and calculating the accuracy of the fitting function,it is found that the accuracy of each fitting function is close to 0,the residual error,the relative error is small,and the accuracy is high.
1.Introduction
In recent years,many countries are developing a real-time monitoring system capable of intelligently detecting traffic conditions.Some of them have achieved certain results.Regarding the determination of traffic congestion,Andrea et al.Used GPS trackers and smartphones to identify traffic in 2017.Congestion and accidents[1],Bauza and Gozalvez detected road traffic congestion based on the information exchange between vehicles and vehicles,vehicles and infrastructure nodes in 2013[2],but after inspection,they found that they have built a section on urban traffic flow The accuracy of travel time prediction models is not very high.Existing navigation software often uses GPS on taxis installed with this software to obtain real-time data to determine road conditions.However,in actual road conditions,there are many other factors For example,under the influence of other factors such as road network density,road area,number of intersections,traffic volume,average speed,number of stops,traffic light duration,etc.,causing road traffic jams,the speed will be slow,so that the data obtained by people to estimate the speed Has a very large error.
In China,many experts and scholars are also engaged in the research of urban road traffic flow and delay forecasting.Among them,Professor He Guoguang of Tianjin University[3]and Professor Yang Zhaosheng of Jilin University[4]have achieved outstanding achievements in this field.They based on multi-dimensional time series and intelligent neural network,a more accurate model for predicting travel time of urban traffic flow sections was established.In addition,Xu Xuemeng,a graduate student of the University of Electronic Science and Technology of China,and her tutor Professor Liu Qiang[5]published intelligent traffic flow prediction and multipath.Research on optimization problems,but the accuracy is not very high when their models are used for large traffic flow densities,mainly due to insufficient consideration of traffic delays in their modeling.
Therefore,this paper takes this factor into consideration,first analyzes in detail the various factors that affect the density of traffic flow,finds seven of the main factors through data processing,and uses it as an index to measure the density of traffic flow.The main purpose is to delay time.Use gray correlation analysis[6]to get the weight of each indicator,and select the three indicators with the highest weighting for analysis,and then use the method of fitting[7]to predict the delay time.Accuracy,combining gray correlation and analytic hierarchy process,to obtain a comprehensive forecast delay time balance function,and substituting other examples into the model to verify the wide applicability and non-uniqueness of the model.
2.Objective Optimization Model Based on Grey Correlation
2.1 Data Processing
According to the 2016 Big Data Report on Intelligent Travel[8],this paper gets the ranking of peak congestion delay index in the morning and evening on weekdays.
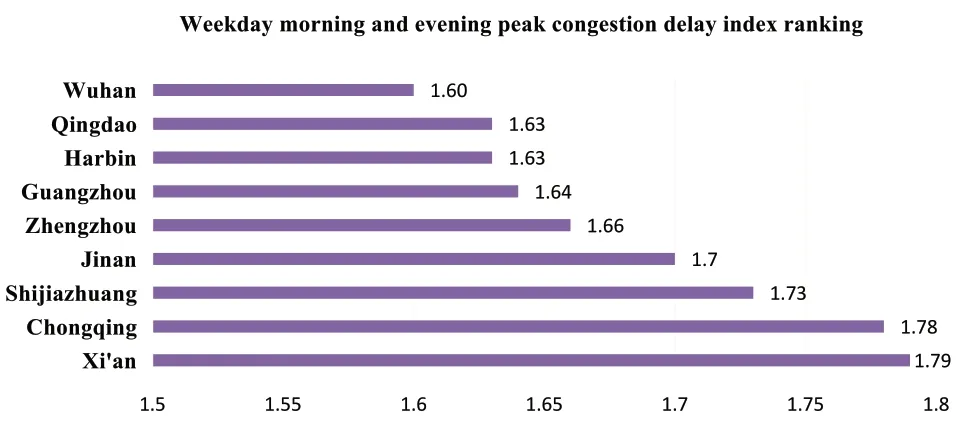
Figure 1.Delayed index ranking during peak periods
Figure 1 shows the morning and evening peak congestion delay time rankings of various cities in the country.It can be seen that the most congested morning and evening peak congestion cities are Xi'an,Chongqing,and Shijiazhuang,and Beijing ranks fourth.In order to make the study representative,this paper chooses the top four cities were selected as the research objects,and the road congestion delay data of each city were randomly selected,and the congested road sections were analyzed in real time.
The common travel modes in life are cars (including taxis),buses,bicycles,and walking.Among them,the impact of each travel mode on the delay time of road trips is shown in Figure 2.
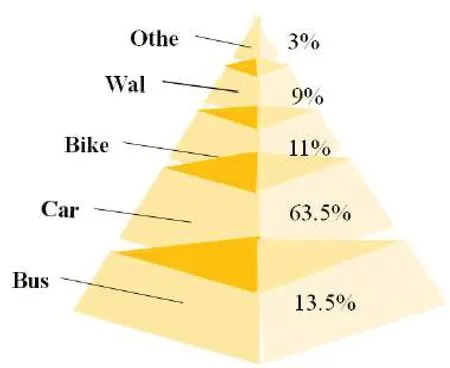
Figure 2.Proportion of travel modes
Figure 2 reflects the proportion of road delays caused by various travel modes.Among them,cars become the main travel mode causing time delays in congested sections,accounting for 63.5% of the total proportion.Therefore,this paper mainly studies the factors that affect the delay time of congested sections and cars.The relationship between the delay times further predicts the delay time of vehicles passing through congested roads.
During the morning and evening peaks of the working day,through the observation of the intersection,the congestion process was found to be five stages:no block,start of block,block,block start to dissipate,and dissipation..Through statistical analysis,it is found that the morning and evening peak delays in the four cities are shown in Figure 3.
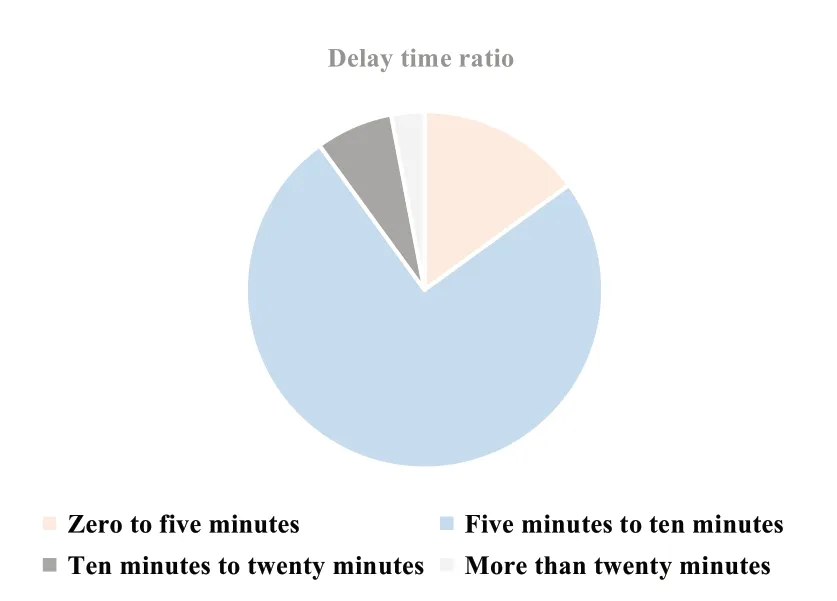
Figure 3.Proportion of delay time
It can be found from Figure 3 that during the morning and evening peak hours of the working day,the driving delay period is concentrated in 5~10 minutes,accounting for 75% of the overall delay time period.Therefore,in this paper,the study is carried out under the condition that the driving delay time is 5~10 minutes.
There are seven factors that affect the delay time during the peak driving period:road network density,road area,number of intersections,traffic volume,average speed,number of stops,and traffic light duration.The research points randomly selected in the four cities are processed and integrated.The data are shown in Table 1[9].
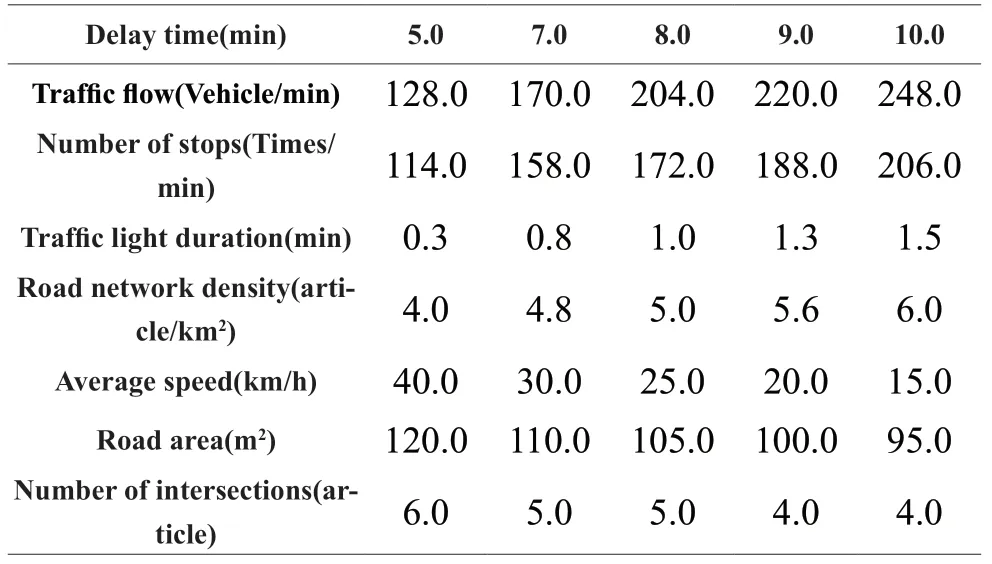
Table 1.Data integration of factors affecting vehicle delay
2.2 Correlation Analysis
Through literature review,this paper finds 7 key factors that influence the delay time through congested road sections:road network density,road area,number of intersections,traffic flow,average speed,number of stops,and traffic light duration.The delay time through the congested section is selected as the reference sequence; the road network density,road area,number of intersections,traffic volume,average speed,number of stops,and traffic light duration are used as comparison sequences,respectively.

Where k is the point selected by the road segment.Followed by definitionξi*k,for comparing the number of correlat ions between the s equencex1and the reference sequencex0at time K,whereρ∈(0 ,1)is the resolution factor.

Because the correlation coefficient in the formula is an indicator describing the degree of correlation between the comparison sequence and the reference sequence in each year,there are 6 correlation coefficients,so the correlation coefficient is too scattered,which is not conducive to intuitively reflecting the relationship between the comparison sequence and the reference sequence Therefore,this paper needs to get the average of the correlation coefficient.

The initialization sequence of each data is substituted into the above formula,and the average correlation coefficients of these 7 sequences can be obtained by using MATLAB software,as shown in Table 3.

Table 2.Relevant factor data
It can be seen from Table 2 that the traffic flow,the number of stops,and the average speed have a great impact on the delay time through congested sections,about 95%.The length of traffic lights,road network density,and the number of intersections have a small effect on delay time through congested sections.Less than 80%,so the delay time and traffic volume,the number of stops,and the average speed through the congested roads are mainly related to the length of traffic lights,road network density,road area,and the number of intersections.
2.3 Find the Weight of the Main Relevant Factors
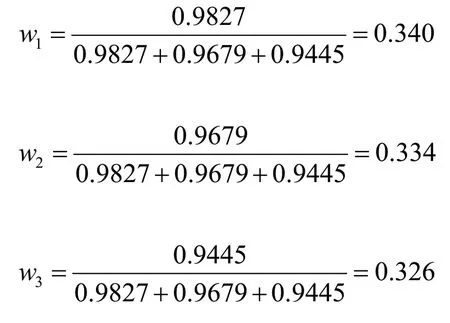
Through grey correlation analysis,the traffic volume,the number of stops,and the average speed are selected as the research objects.The correlation coefficients of the three on the delay time through congested roads are 0.9827,0.9679,and 0.9445.
Therefore,the weights of traffic volume and average number of stops are:
2.4 Perform Data Fitting for Each Factor
By studying the congestion data of Xi'an,Chongqing,Shijiazhuang,and Beijing cars,this paper explores the fitting curves and functions of traffic volume,number of stops,average speed,and road congestion delay time.
After continuous fitting,it is explored that the traffic flow and the delay time through the congested road section change in a quadratic function image.Establish a mathematical fitting model of traffic flow and delay time according to the exploration paper:

Parameter estimation observation worthy model:

The accuracy of the fit:

The parameters can be calculated using MATLAB software:

Get the model function:

By fitting it,this paper obtains the trend graph of traffic flow and congestion time delay:
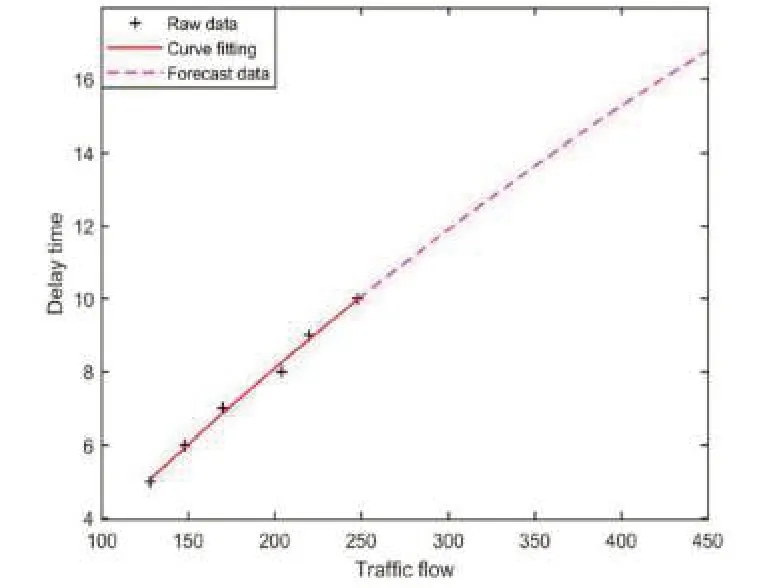
Figure 4.Traffic flow and delay time fit diagram
It can be found from the fitting function that the larger the traffic volume,the greater the probability of congestion and the longer the delay.With more than 250 passing vehicles per minute,road delays can exceed 10 minutes.
By the same reasoning,the fitting curve and function of road congestion delay time,number of stops and average speed are shown in Table 3.
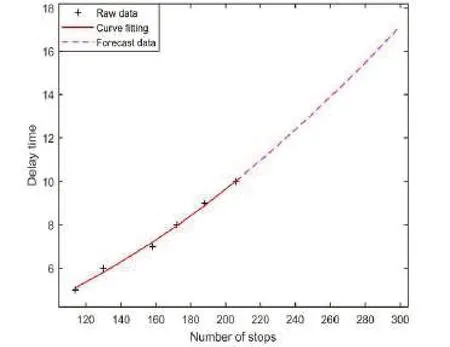
Figure 5.Figure of the number of stops and delays
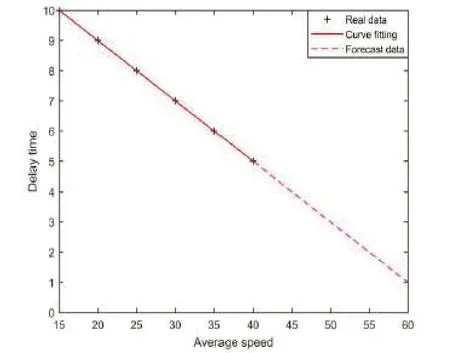
Figure 6.Average speed and delay time fit diagram

Table 3.Delay time and the number of stops and the average speed
By fitting the curve and function between the two,it can be found that the more times the car stops,the greater the probability of congestion and the longer the delay.When the car stops more than 205 times per minute,the road delay time will exceed 10 minutes; the average speed is inversely proportional to the delay time.The lower the average car speed,the greater the probability of congestion and the longer the delay.When the average speed of a car is below 15 kilometers per hour,road delays can exceed 10 minutes.
2.5 Multi-factor Comprehensive Delay Time Prediction Function
By fitting three main influencing factors to road congestion delay time,this paper obtains three fitting functions about delay time.Because the three factors have different impact weights on road congestion delay time,this paper assigns a weight to the fitting function.A multi-factor prediction function is obtained to comprehensively judge the delay time of congested road sections.

2.6 Model Checking
In order to carry out the simulation test,the real-time data of the research point should be substituted into the comprehensive prediction equation to obtain the fitting value of the delay time.Table 4 shows the residuals,relative errors,and step deviations obtained using real data and fitted data.
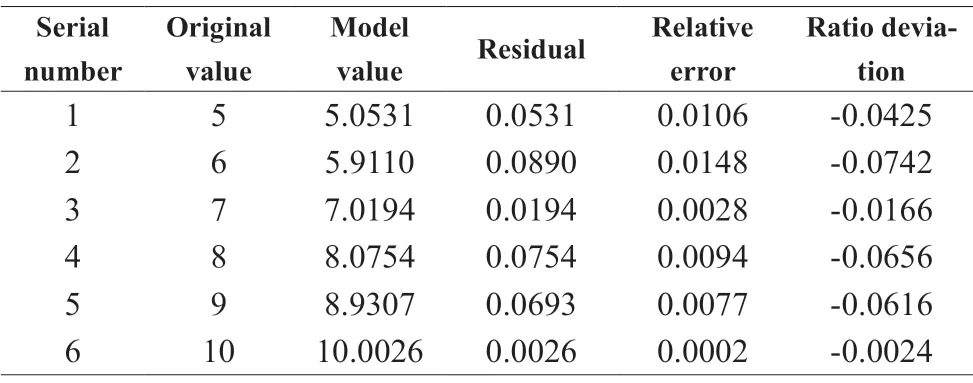
Table 4.Lative error,grade ratio deviation value data table
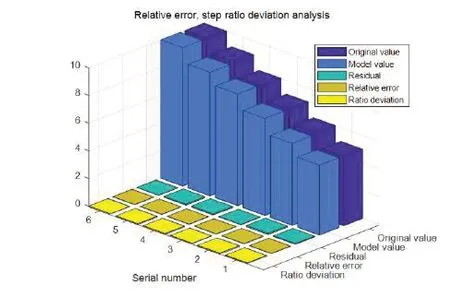
Figure 7.Analysis of relative error and step ratio deviation
After verification,the residual,relative error,and step deviation between the data fitted by the model and the original data are close to 0,which proves that the model has high accuracy and can predict road delays in real time.
3.Conclusion
In this paper,by processing big data of intelligent travel,and combining grey correlation analysis to determine the three factors of traffic flow,number of stops,and average speed play a decisive role in predicting the delay of road congestion.Use the fitting algorithm to process the data of the three main factors to determine the relationship function between each factor and the time required to pass through the congested road.The relationship functions of the three factors are linearly summed to obtain a multi-factor comprehensive prediction function,and the factor data is brought into the multi-factor comprehensive prediction function is used for prediction.It is found that the error of the prediction result is close to 0 through error analysis,which can provide a certain basis for determining the time required to pass through the congested road section.
