Viability of high-density resistivity method for evaluatingmountain slope stability in Erdaojiang District, Tonghua City, China
2020-12-15XINZhonghua,HANJiangtao,LIZhuoyang等
Abstract: The authors employ the high-density resistivity method to image the subsurface structure of a mountain in Erdaojiang District, Tonghua City, Jilin Province, China, to evaluate the potential risk of slope failure on surrounding residential areas and infrastructure, and identify a shallow fault that extends across the center of the mountain and is perpendicular to the mountain slope and accurately locate the spatial position and depth of another fault on the southern side of the mountain. The results provide an important basis for evaluating mountain slope stability. This study also demonstrates that the high-density resistivity method is effective for detecting mountain faults.
Keywords: Erdaojiang District; Tonghua City; Jilin Province; high-density resistivity method; electrical resistivity structure; mountain faults
0 Introduction
Mountain slope stability is evaluated using a number of key aspects, including mountain structure, faults, karst topography and groundwater. Landslides, collapses, and other disasters can occur along faults, all of which can seriously affect mountain slope stability. It is therefore important to investigate and evaluate mountain slope stability to effectively mitigate any potential risks and hazards (Jiangetal., 2008). A widely used approach for evaluating mountain slope stability is the high-density resistivity method, which is a low-cost and highly efficient geophysical method that yields accurate results, such as the clear delineation of subsurface faults (Wangetal., 2019).
The high-density resistivity method is an active source array exploration method that combines electrical profiling and electrical sounding survey methods. The spatial position and depth of the target body are determined by the distribution of the stable current field, which is based on the difference in electrical properties between the target body and surrounding material. These spatial constraints, as well as the magnitude of the resistivity difference, can be analyzed to solve various geological problems. For example, a fluid- and soil-filled mountain fault will appear as a conductive belt, compared with the surrounding rock.
Unlike in the conventional resistivity method, electrodes are not repositioned during recording when using the high-density resistivity method to avoid the effects of electrode movement and setting. This approach also greatly improves the surveying efficiency through the use of a program-controlled electrode transfer switch and micro-computer engineering electrical measuring instrument, which allow scanning measurements to be performed for a variety of electrode arrays (Zhaoetal., 2006); such an approach provides greater constraints on the geoelectric structure of the survey area.
Here we employ the high-density resistivity method to investigate the detectability of subsurface mountain faults in Erdaojiang District, Tonghua City, Jilin Province, China. Our inversion results delineate the distribution of the mountain fault system across the surveyed mountain. We also collected a drilling core to verify the position of the inferred faults, which also demonstrates the viability of employing the high-density resistivity method to detect subsurface mountain faults and conduct mountain slope stability analyses.
1 Regional geological conditions
The Erdaojiang District of Tonghua City is located at the foot of Changbai Mountain, along the middle reaches of Hunjiang River (Fig.1). The complex terrane of Erdaojiang District comprises numerous mountains, which account for more than two thirds of the total area and belong to the Changbai Mountain system. The entire terrane subsides from south to north, consisting of a topographic high in the south and a low in the north.
Erdaojiang District is located along the northeastern margin of the North China Platform, which is the southeastern part of the Hunjiang depression fold belt. Late Proterozoic and Early Paleozoic strata are mainly exposed in this region. Complex fault and fold systems formed after a long and strong structural evolution process, and have manifested largely as NE- and NW-striking conjugate fault systems. These fault systems cross-cut, stack, and merge with each other, controlling regional landform and valley development.

Fig.1 Geographical location of the study area
2 High-density resistivity method
2.1 Acquisition principle of direct current method
The high-density resistivity method is based on the measuring principle of the direct-current (DC) method, where power supply electrodes A and B transmit a DC into the subsurface that is then received at electrodes M and N. The apparent resistivity is obtained via the following formula (Liuetal., 2004):
whereΔUMNrepresents the voltage between receiving electrodesMandN,Irepresents the current, andKrepresents the device coefficient of the different arrays.
The detection depth increases with increasing electrode distance, and the subsurface measuring sites decrease with increasing layer depth (Fig.2). All of the electrodes were positioned at the surface before data acquisition. The arrangement of the power supply and receiving electrodes is controlled by the program-controlled electrode transfer switch, which eliminates the need to reposition the electrodes during data acquisition.
Here we selected the dipole-dipole array due to its large abnormal amplitude, high effectiveness in resolving small-scale anomalies, and small electromagnetic coupling effect (Zhangetal., 2010).
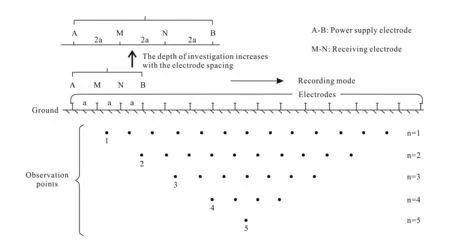
Fig.2 Schematic diagram of electrode positions and scanning observation points in high-density resistivity method
2.2 Data acquisition
The exploration capability of electrical resistivity methods is closely related to the arrangement of the survey profile. The survey profile should be perpendicular to the primary axis of the target body and extend beyond both sides of the target body to maximize its imaging potential. At least 1--2 survey sites are recommended to delineate the target body in a three-dimensional sense. The profile spacing can be adjusted appropriately, but it is not recommended to be more than three times the station spacing to ensure accurate three-dimensional imaging of the target body.
The survey work was conducted in two phases, with the survey profile distributions shown in Fig.3. The phase I survey consisted of ten survey profiles that were parallel to the mountain strike, using 5 m station spacing and 15 m profile spacing. Each survey profile was 600 m long. The phase Ⅱ survey was arranged along the southern mountain slope based on the phase I results. Twenty-one survey profiles were acquired, using 2 m station spacing and 2.5 m profile spacing. Each profile was 180 m long.
2.3 Data processing
We performed two-dimensional (2D) and three-dimensional (3D) inversions using the high-density resistivity data. We selected the RES2DINV and RES3DINV software packages for the 2D and 3D inversions, respectively, which are based on the least-squares algorithm. These inversion packages were also chosen because their inversion process can analyze large data volumes quickly at fast speeds with good effect and generate the best-fit inversion models automatically (Yanetal., 2012).
We were unable to collect terrain information during data acquisition; therefore, we applied a terrain correction to produce results that were more consistent with the real subsurface structure. Data were filtered to eliminate any distorted resistivity measurements. The final (best-fit) inversion models were obtained after 3--5 iterations during the 2D inversion and 6 iterations during the 3D inversion. We then interpreted the subsurface structure based on joint analysis of the modeled geophysical characteristics and observed geological conditions.

Fig.3 Map of phase Ⅰ survey lines and phase Ⅱ survey area
3 Results and discussion
3.1 Phase Ⅰ high-density resistivity survey results
The 2D inversion results for each profile from the phase Ⅰ high-density resistivity survey are shown in Fig.4. A maximum depth of ~100 m was imaged during the survey. The most prominent feature in all of the profiles is a central high-resistivity structure (>1 000 Ω·m) along the sampled mountain slope. There are no surface outcrops of granite in the study area, but there is a notable sedimentary outcrop (Fig.5). The resistivity ranges of common sedimentary rocks are listed in Table 1. The high resistivity of this anomaly across the central portion of the study area, which is as high as several thousand Ω·m, is indicative of sandstone and/or limestone. There is a conductive layer above the rock mass with a resistivity of ~10 Ω·m that corresponds to a shallow soil layer.
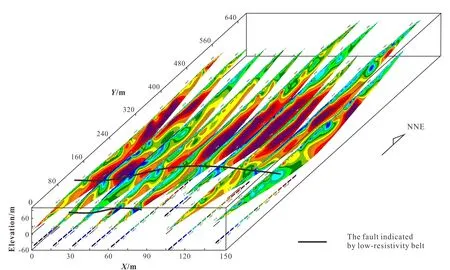
Fig.4 2D inversion models for phase Ⅰ high-density resistivity survey
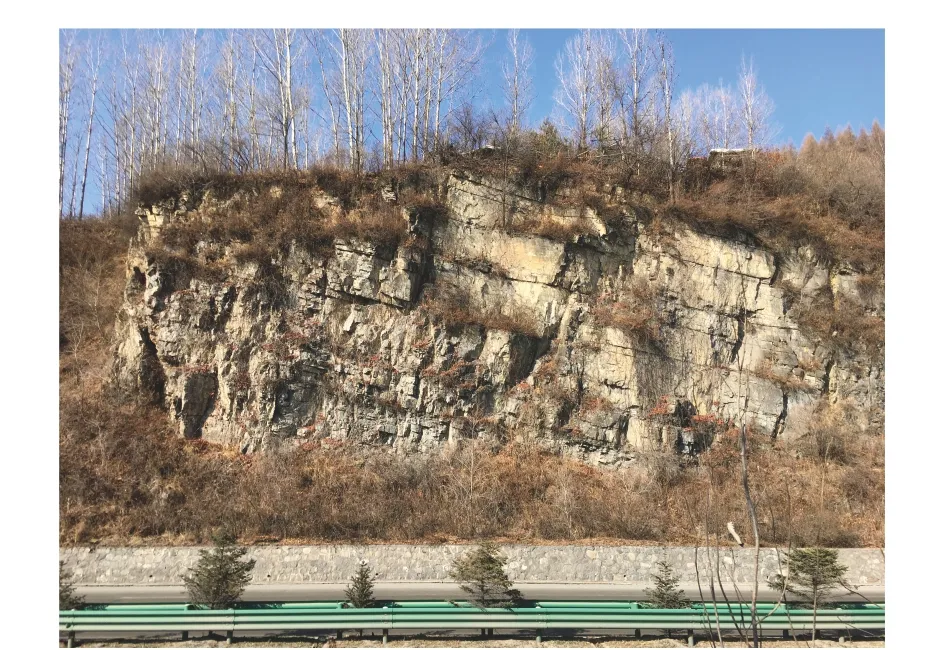
Fig.5 Outcrop of sedimentary strata in resistivity survey area
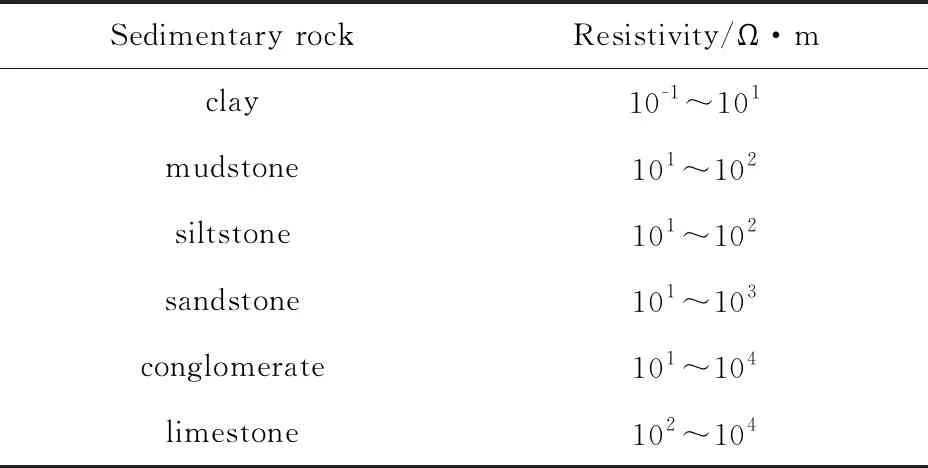
Table 1 Resistivity ranges for common sedimentary rocks
There are two EW-striking conductive belts present in the 2D resistivity profiles, each with a resistivity of about 10 Ω·m, which are shown as black solid lines in Fig.4. One of these is located along the southern slope of the mountain, and is observed along four profiles. The other is located at the southern margin of the high-resistivity limestone strata, and can be traced across all of the profiles. Fractures are usually characterized as conductive structures relative to the surrounding media since they are generally filled with soil and fluid. Therefore, these two conductive belts are interpreted to be subsurface faults that extend across the mountain.
Horizontal slices of the 3D inversion results from phase I of the high-density resistivity survey are shown in Fig.6, with the 13.5, 23.8, 55.6, and 79.8 m depth results shown. The black dots represent the location of the conductive belt along each profile, with an obvious electrical gradient belt existing at different depth slices in the inversion results. We obtained a consistent resistivity structure of the fault at the same position when employing different inversion methods to the data, which validate the accuracy of the results. We observed the surface expression of a fault that extended from the foot of the mountain to its summit to the west of the survey area (short red line in Fig. 6). The approximate alignment of this observed fault with our conductive belt in the inversion results suggests that the inferred south-central fault likely extends across the entire mountain and deep into the mountain’s interior.
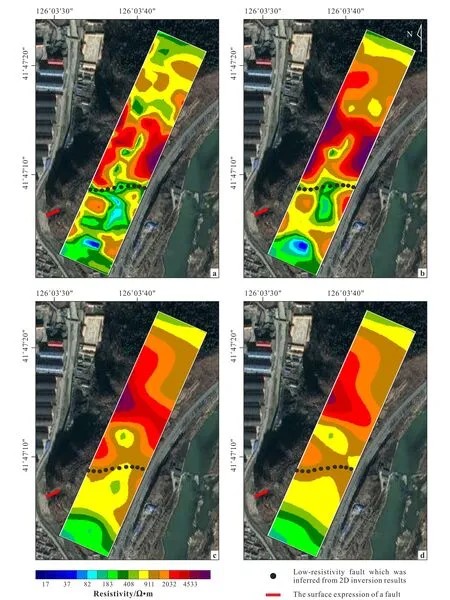
(a) 13.5 m depth slice; (b) 23.8 m depth slice; (c) 55.6 m depth slice; (d) 79.8 m depth slice.Fig.6 Horizontal slices of 3D inversion results at different depths from phase Ⅰ of high-density resistivity survey
There is also a relatively conductive area with a resistivity of few tens of Ω·m that includes the fault
on the southern side of the mountain. However, the resolution of the conductive structure in the south is relatively low because of the large station spacing during the phase Ⅰ survey. This southern fault is further analyzed and discussed using the phase Ⅱ high-density resistivity results.
3.2 Phase Ⅱ high-density resistivity survey results
The phase Ⅱ high-density data were acquired in the conductive area that was determined from the phase I results (i.e., the southern side of the mountain).Depth slices of the 3D inversion results for the phase Ⅱ survey are shown in Fig.7. The fault is unclear at shallow depth because of the effect of the shallow conductive soil layer. The inversion model captures electrical structures from approximately 12~52 m depth. A large resistive structure with a resistivity of >1000 Ω·m, which corresponds to sandstone and/or limestone, is present across most of the model. Conductive anomalies do appear in the central part of the study area and can be traced to 52 m depth, with their location corresponding to the abovementioned southern fault. The deeper conductive anomalies appear as two branch faults that merge gradually into a single fault above 22 m depth.
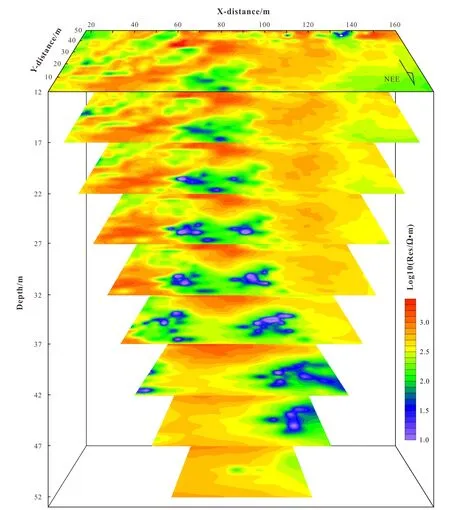
Fig.7 Horizontal slices of 3D inversion results for phase Ⅱ high-density resistivity survey
3.3 Drilling verification
We acquired a drill core to verify the existence of the faults and the accuracy of fault distribution. We reached a maximum drilling depth of 60 m, with the drill core lithology in Fig.8 validating the inverted subsurface resistivity structure across our survey area.
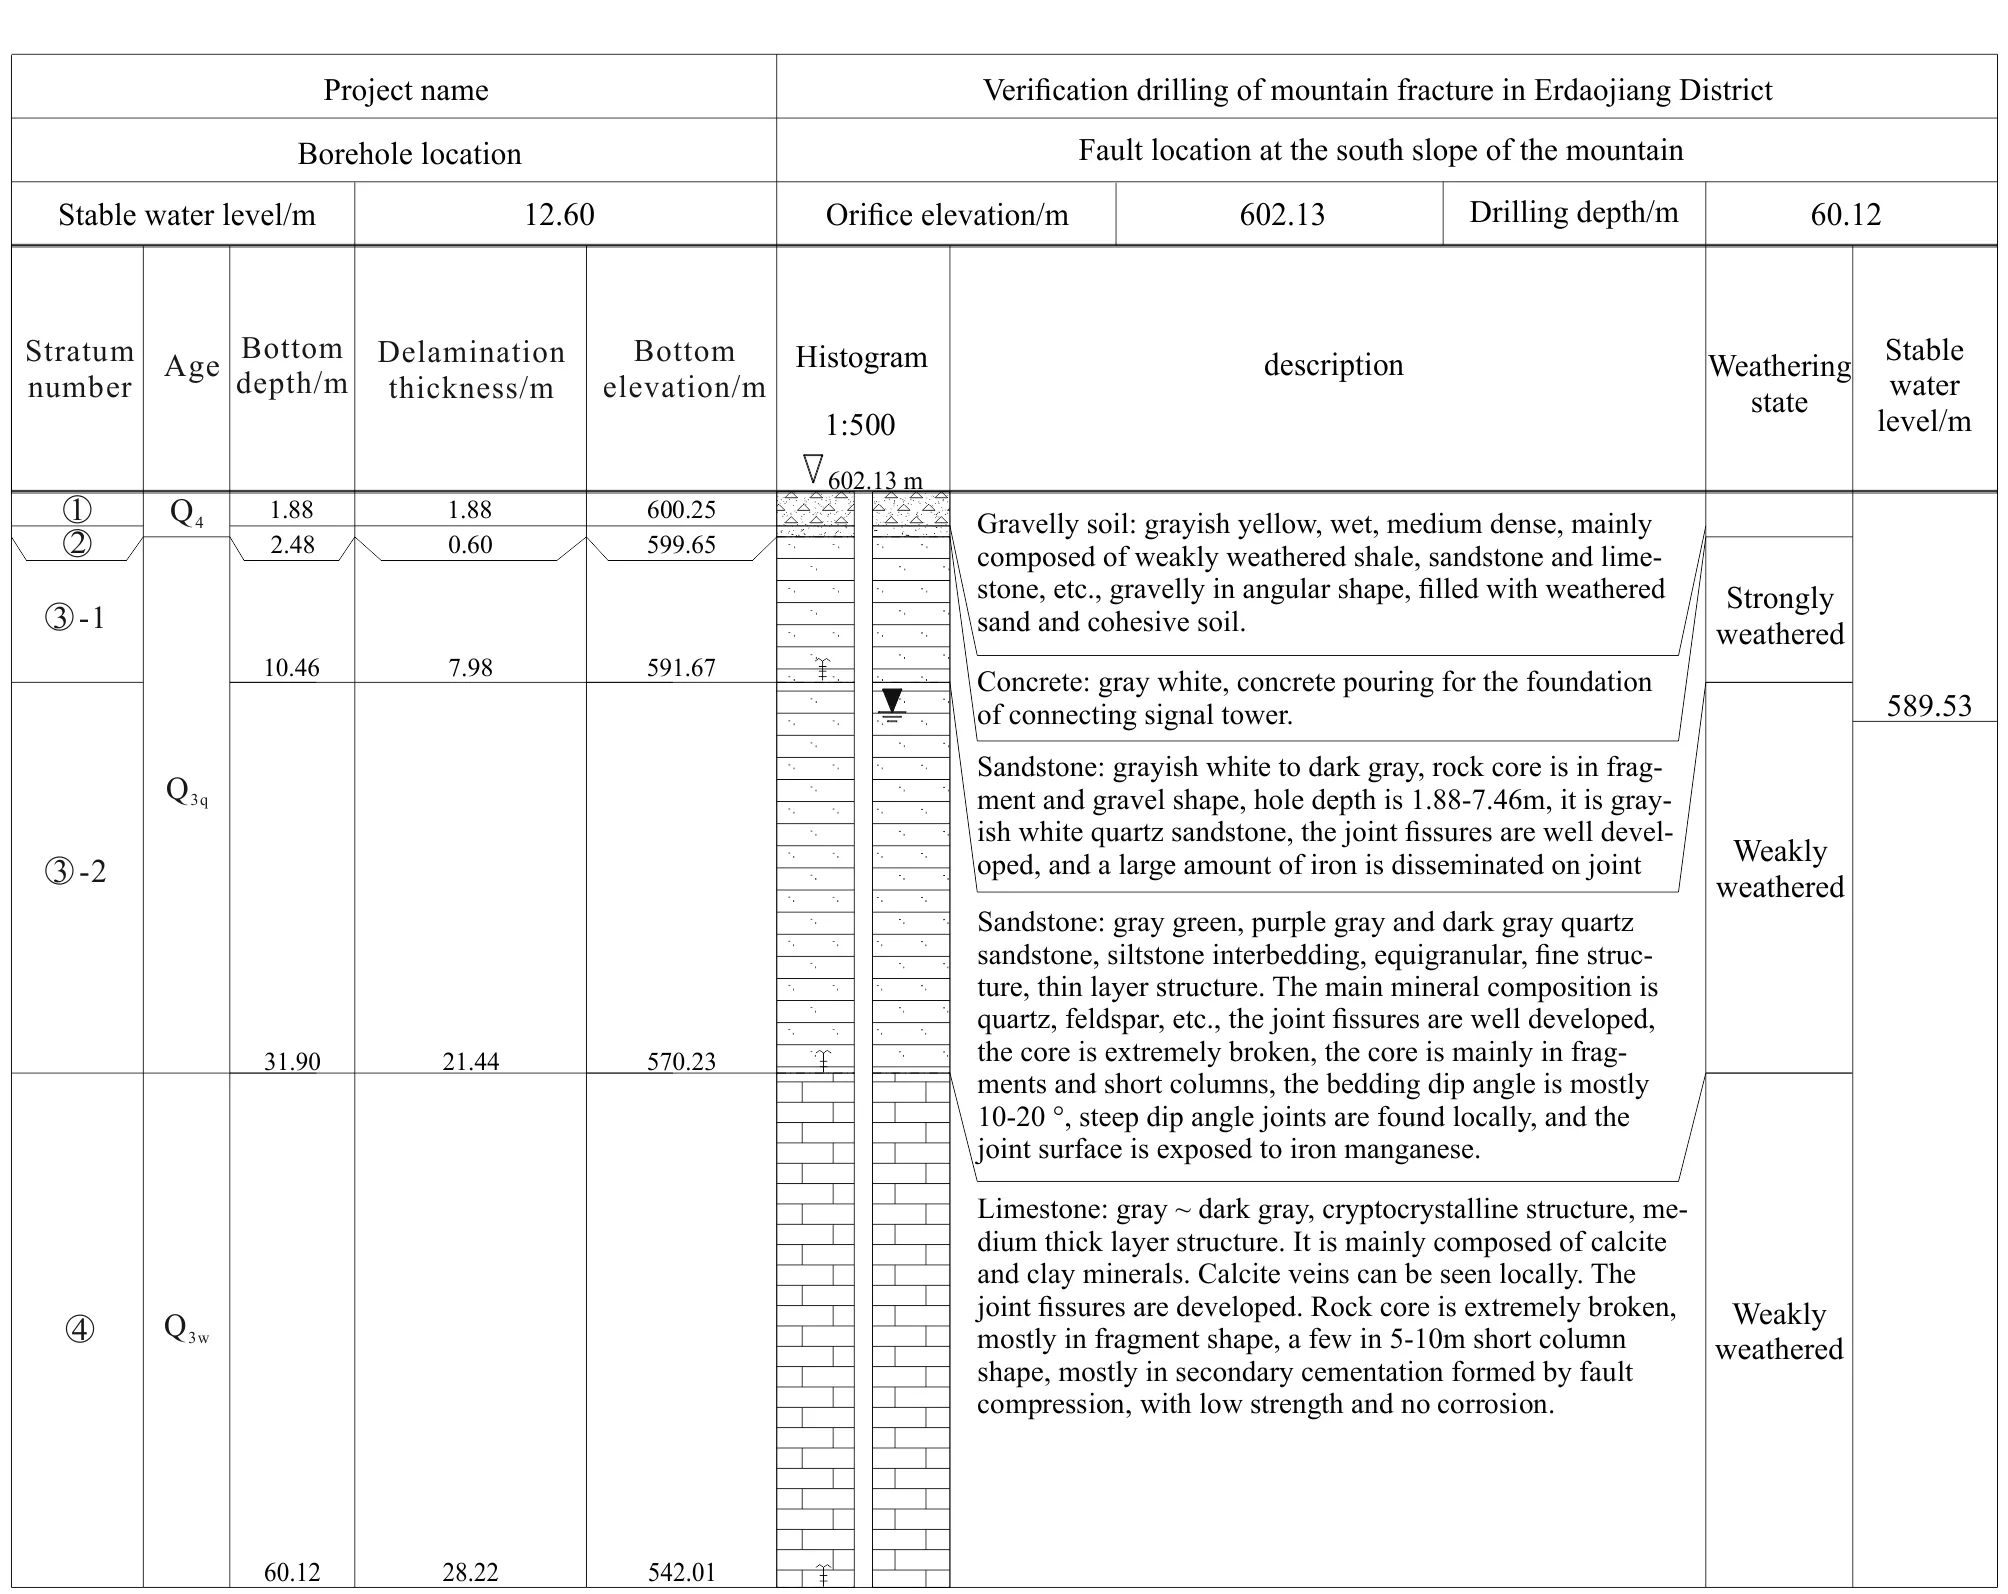
Fig.8 Geological histogram of borehole
The uppermost 1.88 m of the core consists of gravelly soil, which is generally characterized as a conductive material and corresponds to the conductive layer in the shallow part of the inversion results. A 0.6 m-thick concrete layer is then observed in the core, which reflects the presence of a nearby signal tower. Sandstone strata, which are mainly composed of quartz and feldspar, are present at 2.48--31.90 m depth; these strata align with the high-resistivity structures in the inversion results. Well-developed joint fissures are present in the core, and most are in the form of fragments and short columns. Limestone strata, which are mainly composed of calcite and clay minerals, then extend to 60.12 m depth; these strata also align with the high-resistivity structures in the inversion results. The core is extremely fractured throughout this limestone section, mainly consisting of fragments of various sizes and shapes. Most of these fragments are due to secondary cementation via fault compression and possess a low strength.
The sandstone and limestone layers below the water table are relatively fractured, which is characteristic of faults. The depth of the stable water level is 12.60 m, as shown in Fig.8, which suggests that the fault may be filled with fluid and clastic material. This fault morphology would appear as a conductive structure in the inversion results, which suggests that the faults inferred from the high-density resistivity results are true and reliable.
Faults on the mountain slope may promote decoupling between the upper sediments and lower bedrock. Rainfall events may facilitate landslides, collapses, and other disasters by destabilizing the slope near these faults. Residential areas surround the foot of the mountain, and highways and township roads are also built near the mountain. These subsurface faults therefore pose potential safety hazards to the local residents and highway traffic. The southern fault, which is located on a steeper slope, poses a high risk. The fault in the south-central part cuts the entire mountain, and may affect the highway on the east side of the mountain.
4 Conclusions
(1) The central section of the mountain possesses a wide range of resistive structures that correspond to sandstone and/or limestone bedrock.
(2) Two faults appear as conductive belts in the resistivity profiles, and can be traced across multiple profiles. They are mainly developed in the south-central section of the mountain. The longer fault extends across the central part of the mountain, and the other is located along the southern slope. These two faults pose potential safety risks, such as landslides and collapses during rainfall events.
(3) The high-density resistivity method is effective for detecting mountain faults. More accurate results are obtained when smaller station spacing is used.
杂志排行
Global Geology的其它文章
- New palaeoclimatic insights on the Late Cretaceous environments of Mongolia based on the isotope data (δ13C, δ18O) of dinosaur eggshells and pedogenic carbonates from Bayn Dzak section
- A new type of Mo-bearing quartz vein by acid leaching:evidence from Dahu-Qinnan Mine, northern belt of the Xiaoqinling gold province, central China
- Numerical simulation of oil shale in-situ mining usingfluid-thermo-solid coupling
- Application of high-density resistivity method toevaluate safety around Minyan Tunnel, Helong City
- Seismic data denoising based on data-driven tight framedictionary learning method
- Experimental study on parameter determination offluid replacement equation for volcanic reservoirs
