Associations of content and gene polymorphism of macrophage inhibitory factor-1 and chronic hepatitis C virus infection
2020-12-11XunJunYangXiaoOuWangYaoChenSongDaoYe
Xun-Jun Yang, Xiao-Ou Wang, Yao Chen, Song-Dao Ye
Abstract
Key Words: Hepatitis C virus; Chronic infection; Exon region; Polymorphism; Macrophage inhibitory factor-1; Case-control study
INTRODUCTION
Hepatitis C is a global epidemic. All people are susceptible to the hepatitis C virus (HCV) infection, regardless of sex, age, and race. According to statistics from the World Health Organization, the global infection rate of HCV is about 2.8%, and about 185 million people are infected[1]. China has the largest number of infections, with 14.67 million people infected with HCV[2]. Although the transmission routes of HCV have been identified clearly, the infection of HCV cannot be detected easily in the early stage since it has an imperceptible onset process with a high degree of chronicity. In the patients infected with HCV, only 20%-30% can clear the virus spontaneously in the acute stage, while 70%-80% will suffer a persistent chronic infection. Eventually, about 30% of patients with chronic hepatitis C (CHC) will be subject to a disease progression into cirrhosis and hepatocellular carcinoma, resulting in about 350000 deaths each year[3,4]. The predictors of chronicity of HCV infection include male gender, age > 25 years at the time of infection, no obvious symptoms after infection, human immunodeficiency virus (HIV) infection, immunosuppression, and so on. The chronicity, manifested after HCV infection, is the result of combined effects of host immunity, genetic susceptibility, and virus[5,6]; however, additional studies are essential to elucidate the specific mechanism.
Macrophage inhibitory factor-1 (MIC-1), also known as growth differentiation factor-15, is a member of the transforming growth factor-β superfamily. A previous study showed that the expression level ofMIC-1is low in healthy individuals, which is increased under pathological or stress effects, such as inflammation and trauma[7]. The contribution of MIC-1 to the damage of various organs and progression of various diseases, such as cardiovascular disease[8-10], malignant tumor[11-13], and diabetes[14], could be realizedviaregulation of an inflammatory reaction and apoptosis pathways. Some recent studies demonstrated that the expression ofMIC-1is increased in patients with chronic viral hepatitis, cirrhosis, or small hepatic cell cancer, and MIC-1 could be used for the diagnosis and prediction of viral hepatitis complications[15-18]. The humanMIC-1gene is localized on chromosome 19p12-13.1 and consists of two exons and one intron. Hitherto, dozens of single nucleotide polymorphism (SNP) loci have been found, among which rs1059519 and 1059369, in the exon region, are under intensive focus. However, current studies on these two loci are mainly focused on cardiovascular disease[19,20]and malignant tumor[21], while correlation with the infection of hepatitis virus has not yet been reported. Thus, the present study aimed to explore the correlation between MIC-1 and the chronic infection of HCV by determining the expression level ofMIC-1and the gene polymorphism in the exon region in CHC patients and healthy subjects who cleared the screening examination. These findings would provide a basis for the diagnosis and treatment of such diseases.
MATERIALS AND METHODS
Study subjects
CHC group:A total of 178 CHC patients who visited the Department of Infectious Diseases at the Second Affiliated Hospital of Wenzhou Medical University from September 2016 to August 2019 comprised the CHC group by retrospective recruitment. This cohort fulfilled the diagnostic criteria of the “Guideline for Prevention and Treatment of Hepatitis C (2015)”[22]. Inclusion criteria were age 16-75 years; HCV infection duration > 6 mo, or epidemiological history 6 mo ago, anti-HCV- and HCV RNA-positive, histopathological examination results of liver meeting the diagnostic criteria for chronic hepatitis, and not receiving antiviral treatment or immunomodulation or within past 3 mo. Exclusion criteria included the following: Accompaniment by other viral hepatitis, such as chronic hepatitis B, alcoholic liver disease, drug-induced liver injury, autoimmune hepatitis or other liver diseases; HIV infection; malignant tumor; severe cardiovascular or cerebrovascular disease; hematological disease or thyroid disease; diabetes; or complete case data unavailable.
Control group:A total of 82 healthy subjects enrolled from the Physical Examination Center at the Second Affiliated Hospital of Wenzhou Medical University comprised the control group. Exclusion criteria included the following: accompaniment by other viral hepatitis, such as chronic hepatitis B, alcoholic liver disease, drug-induced liver injury, autoimmune hepatitis, and other liver diseases; HIV infection; malignant tumor; severe cardiovascular and cerebrovascular diseases; hematological disease or thyroid disease; or diabetes. All study subjects were unrelated Han Chinese individuals from Zhejiang Province, China. This study was approved by the Ethics Committee of the Second Affiliated Hospital of Wenzhou Medical University (LCKY2016-128), and all patients signed the informed consent before participation in the study.
Sample collection
A volume of 4-5 mL venous blood sample was collected from all fasting patients with EDTA-K2in the morning. After the routine blood test (for platelet (PLT) count), the plasma was separated from the blood cells by centrifugation at 3000 rpm for 5 min and stored at -80 °C. The plasma was used to determine the parameters such as alanine aminotransferase (ALT), aspartate aminotransferase (AST) activity, total protein (TP), albumin (ALB), total bilirubin (TBIL), type III procollagen N-terminal peptide (PIIINP), type IV collagen (CIV), MIC-1, and HCV RNA, while the DNA was extracted from the blood cells to analyze theMIC-1gene polymorphism.
Study methods
Genomic — DNA extraction and amplification:The extraction was performed using a Blood Genomic DNA Extraction Kit (SK8224; Sangon Biotech Co., Ltd., Shanghai, China), according to the instructions for use of the kit. The amplification was performed using a polymerase chain reaction (PCR) amplification kit (SK2072; Sangon Biotech) in Veriti®96-well PCR instrument (Applied Biosystems Inc., Foster City, CA, United States). The primers were synthesized by Sangon Biotech. The PCR reaction system consisted of DNA template at 1.0 μL, forward and reverse primers at 0.5 μL each, dNTPs at 0.5 μL,Taqenzyme at 0.2 μL,Taqbuffer at 2.5 μL, and ddH2O at 20 μL. The PCR reaction conditions were as follows: pre-denaturation at 95 °C for 3 min, followed by 35 cycles of denaturation at 94 °C for 30 s, annealing at 58 °C for 30 s, and extension at 72 °C, final extension at 72 °C for 10 min, and storage at 4 °C. Primers: rs1059369-rs1059519-F 5’-TACCTTCTGGCGTGAGTATCCG-3’, rs1059369-rs1059519-R 5’-CAGGCGGAGACGGACAAAGT-3’.
Product purification and sequencing:The amplified product was purified using a PCR product purification and recovery kit (SK1141; Sangon Biotech). The DNA was quantified using a NanoDrop 2000C UV spectrophotometer (ThermoScientific, Waltham, MA, United States). The sequencing was carried out on a 3730XL sequencing instrument (Applied Biosystems Inc.), and SeqMan software was used for the comparative analysis of the sequencing map.
Determination of plasma MIC-1 level:The operation was completed using the double-antibody sandwich ELISA method, according to the instructions for use of the kit (Jingmei Biotechnology Co., Ltd., Jiangsu, China). Anthos 2010 Microplate Reader (Shanghai Bioscience Technology Co., Ltd., Shanghai, China) was used to detect the absorbance of samples and reference substances; the standard curve was drawn to calculate the MIC-1 level of the samples. In the event where OD values of the samples were beyond the upper limit of the standard curve, the determination was repeated with the appropriate dilution of the samples.
Quantitative analysis of HCV:RNA was extracted by real-time quantitative fluorescence (FQ)-PCR according to the protocol of the kit (Piji Bioengineering Co., Ltd., Shenzhen, China), and detected using the ABI 7500 FQ-PCR Instrument (Applied Biosystems Inc.). The normal reference ranges were defined as < 5.0 × 10²copies/mL for HCV RNA.
Determination of plasma ALT, AST, TP, ALB, and TBIL levels:The parameters were assessed on an ADVIA2400 Automatic Biochemical Analyzer (Siemens, Malvern, PA, United States) using original reagents and calibrators. The normal reference ranges were defined as 9-50 U/L for ALT, 15-40 U/L for AST, 65-85 g/L for TP, 40-55 g/L for ALB, 6.8-34.2 mol/L for TBIL, and 100-300 × 109/L for PLT.
Determination of plasma PIIINP and CIV levels:These measurements were carried out by chemiluminescence immunoassay on a MAGLUMI 2000 Automatic Chemiluminescence Immunoanalyzer (New Industries Biomedical Engineering Co., Ltd., Shenzhen, China) using original reagents and calibrators. The normal reference range was defined as 0.5-30 ng/mL for PIIINP and 5.0-30 ng/mL for CIV.
Statistical analysis
An independent clinical case database was established in a mode of double entries by two investigators. SPSS 23.0 for Windows was used for statistical analysis, wherein the enumeration data were described as the composition ratio. Pearson’s chi-square test or Fisher’s exact probability test was used for intergroup comparison. Normal distribution data were expressed as mean ± standard deviation, witht-test or ANOVA used for intergroup comparison, while non-normal distribution data were expressed by median (M), 5thpercentile (P5), and 95thpercentile (P95), with rank-sum test used for intergroup comparison. The website of CHWE (https://www.genecalculators.net/pqchwe-polypicker.html) was used for the analysis of heterozygosity and polymorphic information content (PIC) in all studied groups to determine whether the SNP was polymorphic enough for doing statistical analysis in the Chinese population. We used the CHWE website to perform heterozygosity and PIC analysis for all groups, which aims to determine whether SNPs are sufficiently polymorphic for analysis in the Chinese population. The software SHEsis (http://analysis.bio-x.cn/myAnalysis.php) was used for the analysis of difference in genotypes and allele frequency, Hardy-Weinberg equilibrium test, calculation of odds ratio (OR) and 95% confidence interval (CI), genetic LD analysis, and haplotype construction. Multivariate logistic regression was used for the analysis of independent relevant factors of CHC. The two-tailed test was adopted for all the analyses, andP< 0.05 indicated statistically significant differences. Multiple comparisons and genotypes were corrected for multiple comparisons using Bonferroni correction.
RESULTS
Comparison of baseline characteristics of study subjects
The CHC group included 99 males and 79 females, aged 42.46 ± 10.23 (range: 18-74) years, and the control group included 47 males and 35 females, aged 41.09 ± 9.30 (20-69) years. No statistically significant difference was detected in the sex ratio and age distribution between the two groups. After the rank-sum test of two independent samples, the plasma ALT, AST, TBIL, PIIINP, CIV, and MIC-1 levels were significantly higher, and the TP, ALB, and PLT levels were significantly lower in the CHC group than those in the control group (P< 0.05; Table 1).
Analysis of correlation between MIC-1 level and other biochemical parameters
Spearman’s rank correlation analysis of plasma MIC-1 level and other biochemical parameters in CHC patients revealed that the MIC-1 level showed a significantly positive correlation with ALT, AST, PIIINP, CIV, and HCV RNA (r= 0.219, 0.169, 0.247, 0.239, and 0.304, respectively;P< 0.05) and a significantly negative correlation with TP and ALB (r= -0.371 and -0.391, respectively,P< 0.05), while no significant correlation was established with TBIL or PLT (P> 0.05).
MIC-1 genotypes and allele frequency distribution in the cohort
Three genotypes were identified at rs1059369 locus (AA, AT, and TT) and rs1059519 locus (CC, CG, and GG) ofMIC-1gene by sequencing (Figure 1). The distribution of all genotypes were in accordance with the Hardy-Weinberg equilibrium in controls (allPvalues were > 0.05). Heterozygosity and PIC calculation showed that both SNPs were polymorphic enough for statistical analysis in the Chinese population (all values were > 0.3). The chi-square test showed that there was no statistically significant difference in the genotype and allele frequency distribution at rs1059369 locus between the CHC and control groups (P> 0.05), while a significant difference was detected at rs1059519 locus between the two groups (P= 0.028, 0.004, ORC/G = 0.570). Only the allele frequency distribution of rs1059519 locus was still significant after Bonferroni correction (Pc= 0.004 × 2 < 0.05). The genetic LD test showed a LD between rs1059369 and rs1059519 loci (D’ = 0.99,r2= 0.314). Haplotypes (A-C, A-G, and T-G) of two SNP loci of theMIC-1gene were constructed according to the LD results, where in the distribution of A-C type showed a significant difference between the two groups (P< 0.05; Table 2).
Multivariate logistic regression analysis in study subjects
Parameters with statistically significant difference between CHC patients and healthy individuals were included in a multivariate logistic regression model. Since ALT/AST, TP/ALB, and PIIINP/CIV were correlated to each another, only one of each combination was selected. Logistic regression analysis showed that AST, PIIINP, MIC-1, and GG genotype at rs1059519 locus were independent relevant factors for CHC (P< 0.05; Table 3).
Correlation between polymorphism at rs1059519 locus and other parameters in CHC patients
CHC patients (n= 178) were subdivided into two groups based on sex, age, ALT, TBIL, ALB, CIV, PLT, and HCV RNA levels, respectively. The results of the chi-square test did not reveal any statistically significant difference in the genotype and allele frequency distribution at rs1059519 locus between the two subgroups (P> 0.05) (Table 4).
Relationship of MIC-1 gene polymorphism and plasma MIC-1 level
The MIC-1 levels among each rs1059519 genotype in the study subjects (combined CHC group and control group) were as follows: CC genotype (n= 33, M = 265.10, P5 = 117.45, P95 = 1271.05), CG genotype (n= 99, M =344.40, P5 = 146.40, P95 = 1373.30) and GG type (n= 128, M = 401.65, P5 = 175.41, P95 = 1170.86). By rank-sum test of multiple independent samples, there were statistically significant differences in MIC-1 level between rs1059519 genotypes (P= 0.006). Among them, GG genotype was significantly higher than CC genotype (P= 0.009, after Bonferroni correction), as shown in Figure 2.

Table 1 Comparison of baseline characteristics between chronic hepatitis C and groups
DISCUSSION
The comparison between CHC patients and healthy individuals displayed that the plasma ALT, AST, TBIL, PIIINP, CIV, and MIC-1 levels were higher in the CHC group while that the TP, ALB, and PLT levels were lower. Also, a statistically significant difference was detected in the genotype and allele frequency distribution at rs1059519 locus between the two groups (P< 0.05). Therefore, correlation analysis and multivariate regression analysis were performed on these significant variables. The results showed that AST (ALT), PIIINP (CIV), MIC-1, and genotype GG at the rs1059519 locus were not only positively correlated with CHC but were also independent risk factors (P< 0.05).
MIC-1 was first cloned and identified from an activated macrophage cell line by Bootcovet al[23]in 1997. It mainly participated in the growth, differentiation, and development of the organs. Hsiaoet al[24]demonstrated that when the liver was damaged, the MIC-1 level was increased significantly. Furthermore, Leeet al[17]reported that the serum MIC-1 level was significantly increased in patients with liver cirrhosis and those with hepatocellular carcinoma. In addition, the expression ofMIC-1in the liver cells was significantly higher than that in the normal liver tissue and that adjacent to the cancer tissue. In the study by Luet al[15], the expression ofMIC-1was investigated in patients with chronic hepatitis B and cirrhosis, and the results showed that the serum MIC-1 level in chronic hepatitis B and cirrhosis groups was increased significantly, and the expression in the cirrhosis group was significantly higher than that in chronic hepatitis B group. Siet al[25]investigated the correlation between MIC-1 and HCV replication and found that MIC-1 promoted the replication of HCV by changing the signal transduction and growth of host liver cells, and was associated with primary liver cancer caused by HCV. Furthermore, Zhanget al[26]demonstrated that the serum MIC-1 level in CHC patients was positively correlated with the left atrial inner diameter and left ventricular posterior wall thickness and negatively correlated with ejection fraction and that the detection of MIC-1 was valuable for assessing the cardiovascular damage. The current study demonstrated that the plasma MIC-1 level in CHC patients was significantly higher than that in the normal population, which was relatively consistent with the study by Halimet al[18]. The present study also showed that the plasma MIC-1 level was significantly positively correlated with ALT, AST, PIIINP, CIV, and HCV RNA and significantly negatively correlated with TP and ALB. ALT and AST were sensitive indicators that indicated liver cell damage; TP and ALB were related to liver synthesis function and could reflect chronic liver damage and hepatic parenchymal cell reserve function; PIIINP and CIV were closely related to the degree of liver fibrosis and were relatively specific and sensitive indicators that indicated liver fibrosis[27]. High-sensitivity quantitative detection of HCV RNA is not only crucial for determining HCV infection but also a critical parameter for observing interferon efficacy in patients with hepatitis C[28]. Theresults of the present study indicated that MIC-1 may participate in HCV replication, liver cell damage, and liver fibrosis processes, and that the elevated plasma MIC-1 level may be used as a potential diagnostic marker for HCV infection. However, MIC-1, as a protein that is inducedviastress, has significant differences between individuals and at different stages of disease. It requires multiple measurements and dynamic observation to identify the clinical value. Moreover, the specific mechanism of MIC-1 in HCV infection and the determinants MIC level are still unclear. These problems may be explained at the molecular level through the study ofMIC-1polymorphism. In addition, research for genetic susceptibility contributes to screening of vulnerable populations and improvement of prevention measures.
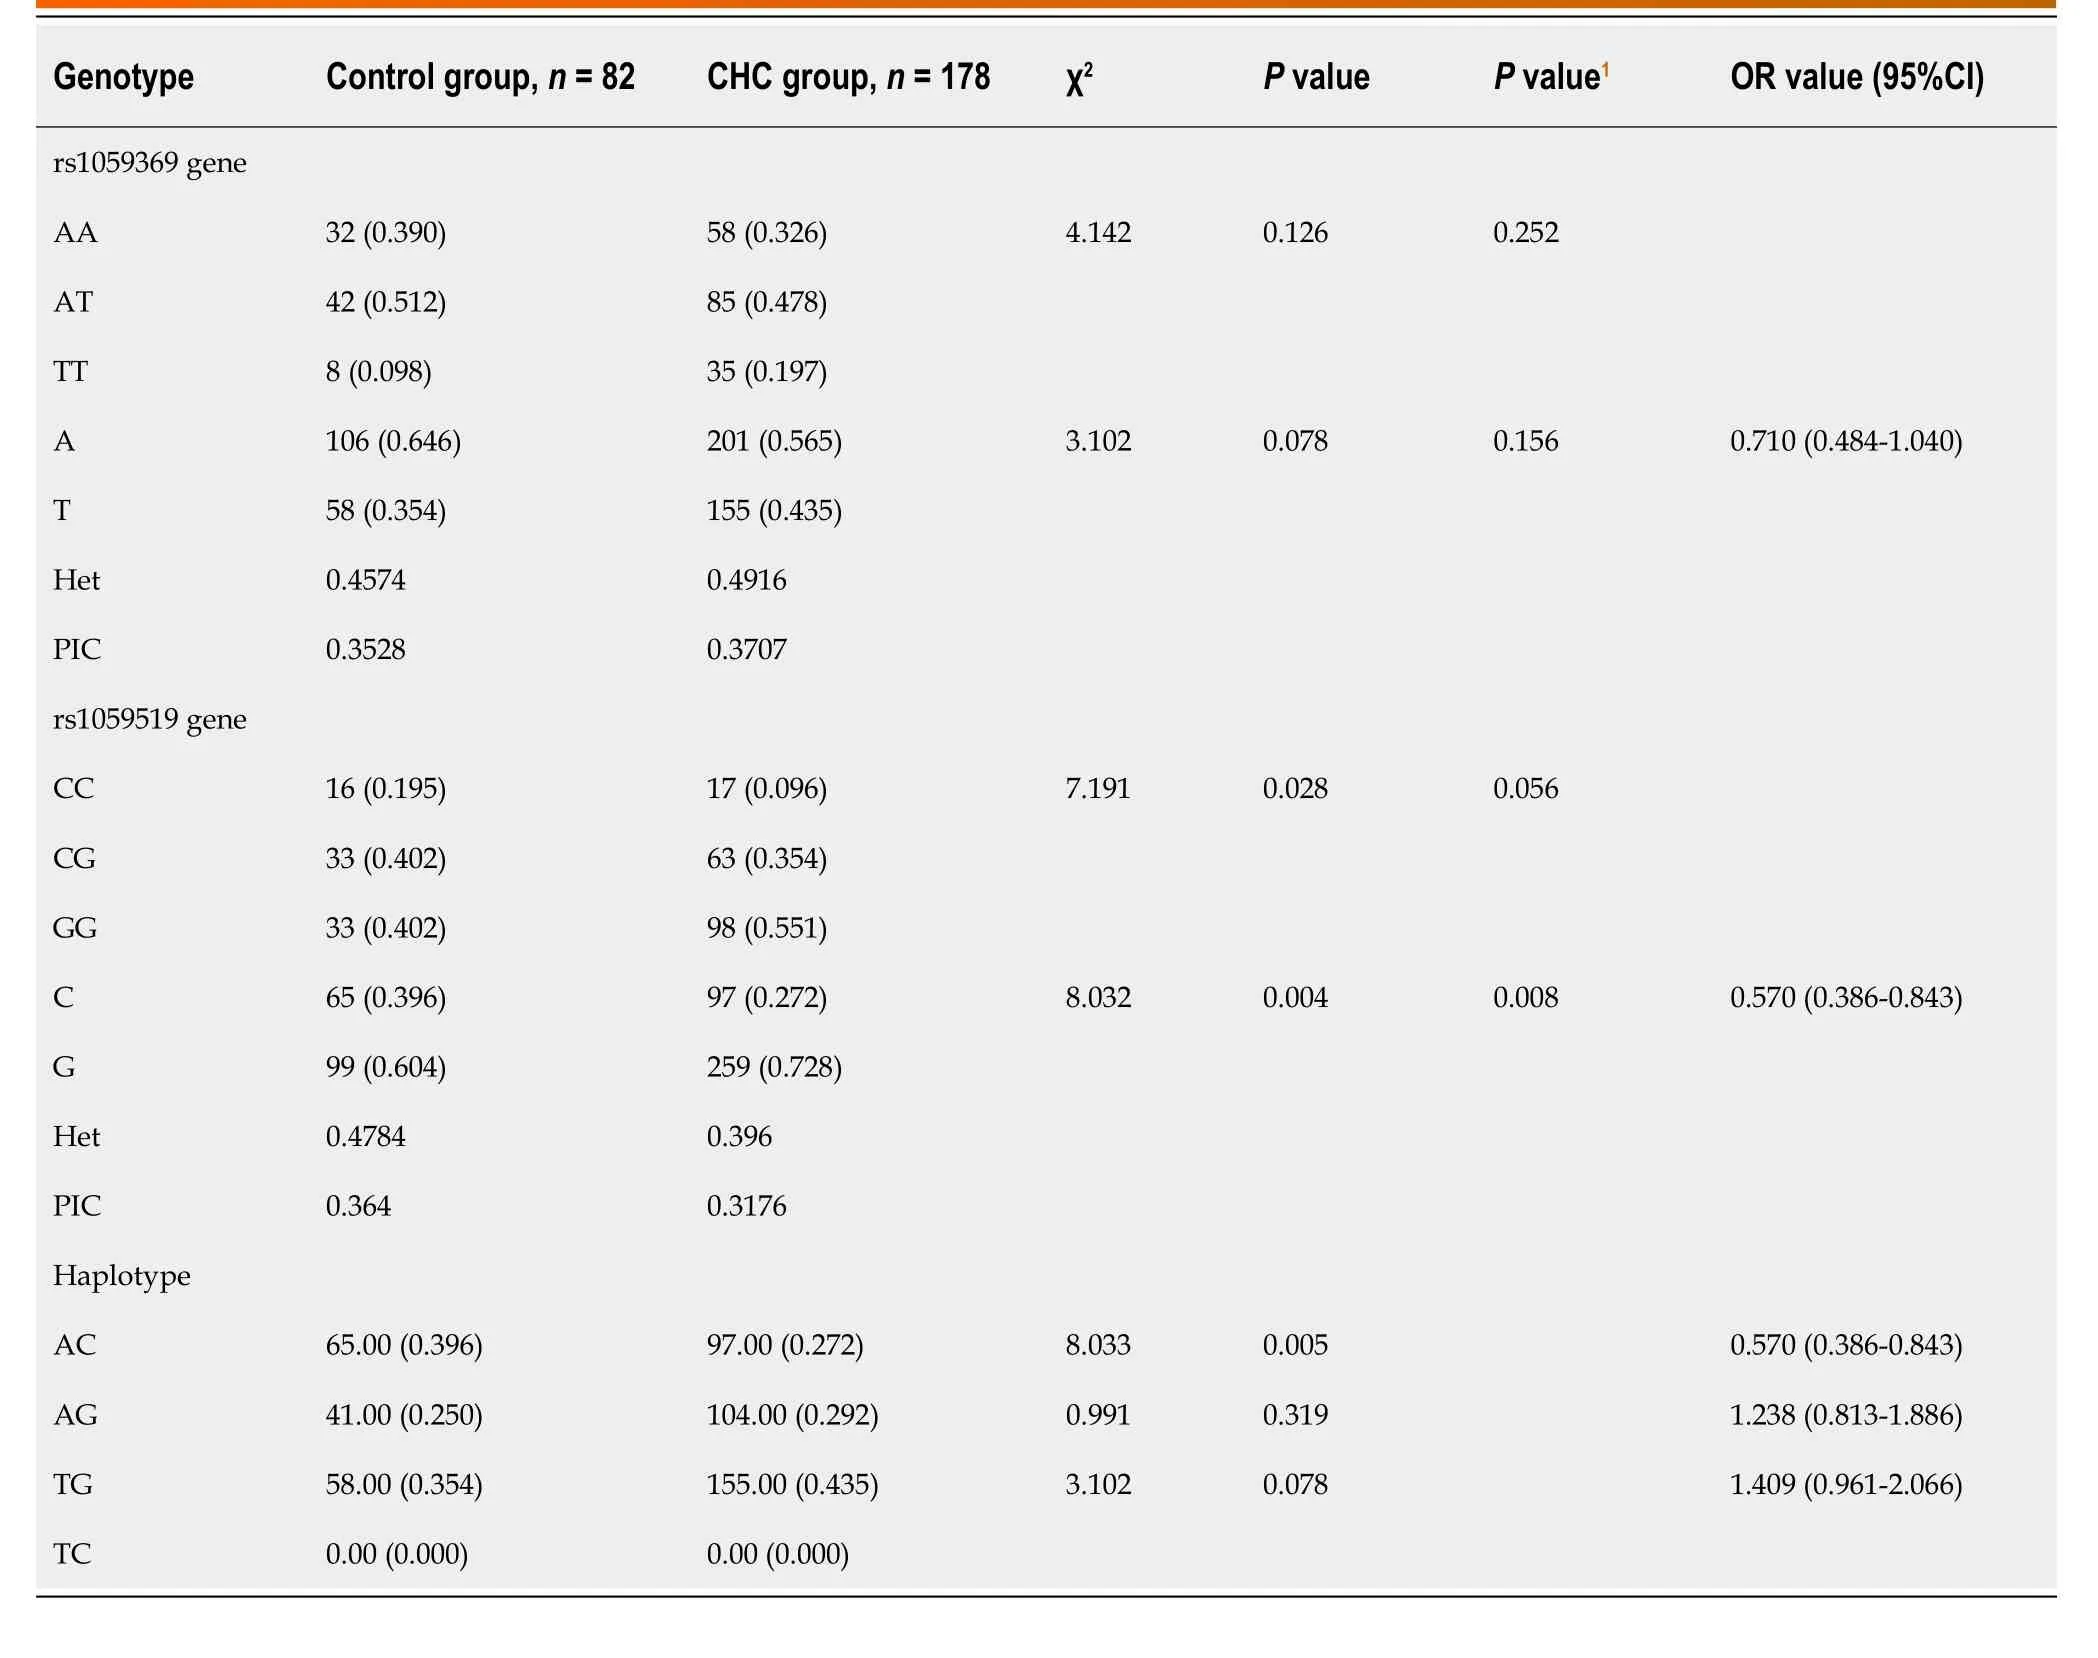
Table 2 Genotypes and allele distribution in subjects
In our study, three genotypes have been identified at the rs1059369 locus,i.e.AA, AT, and TT. A previous study showed a correlation between the polymorphism at the locus and the formation of collateral circulation in myocardial infarction patients with non-ST-segment elevation[19]. Some other studies speculated that this locus did not have any effect on the expression of MIC-1 protein and no significant association with the diseases, such as cardiovascular disease and tumor[29,30]. According to the present study, no statistically significant difference was detected in the genotype and allele frequency distribution at rs1059369 locus between the CHC and control groups (P> 0.05), and no statistically significant difference was detected in the plasma MIC-1 level among different genotypes (P> 0.05; Figure 3). Furthermore, three genotypes were identified at the rs1059519 locus,i.e.CC, CG, and GG. Some studies showed a correlation between the gene polymorphism at this locus and the susceptibility to chronic Keshan disease[31]. Another study demonstrated a difference in plasma MIC-1 level among different genotypes, and that the gene polymorphism at this locus may be correlated with the severity of disease affecting at the plasma level[32]. The presentstudy revealed a statistically significant difference in the allele frequency distribution at rs1059519 locus between the CHC and control groups (P< 0.05). However, no statistically significant difference was detected in the CHC subgroups divided based on sex, age, ALT, TBIL, ALB, CIV, PLT, and HCV RNA levels (P> 0.05), suggesting that the polymorphism at rs1059519 locus was associated to CHC. Intriguingly, no significant correlation was established between the genotype and HCV viral load or liver damage severity. On the contrary, there were significant differences in plasma MIC-1 levels between different genotypes at rs1059519 sites, from genotypes CC, CG to GG, and MIC-1 levels increased gradually, with the GG genotype group having significantly higher than the CC genotype group. Therefore, we speculated that rs1059519 polymorphism might be related to CHC susceptibility by affecting the expression level ofMIC-1.
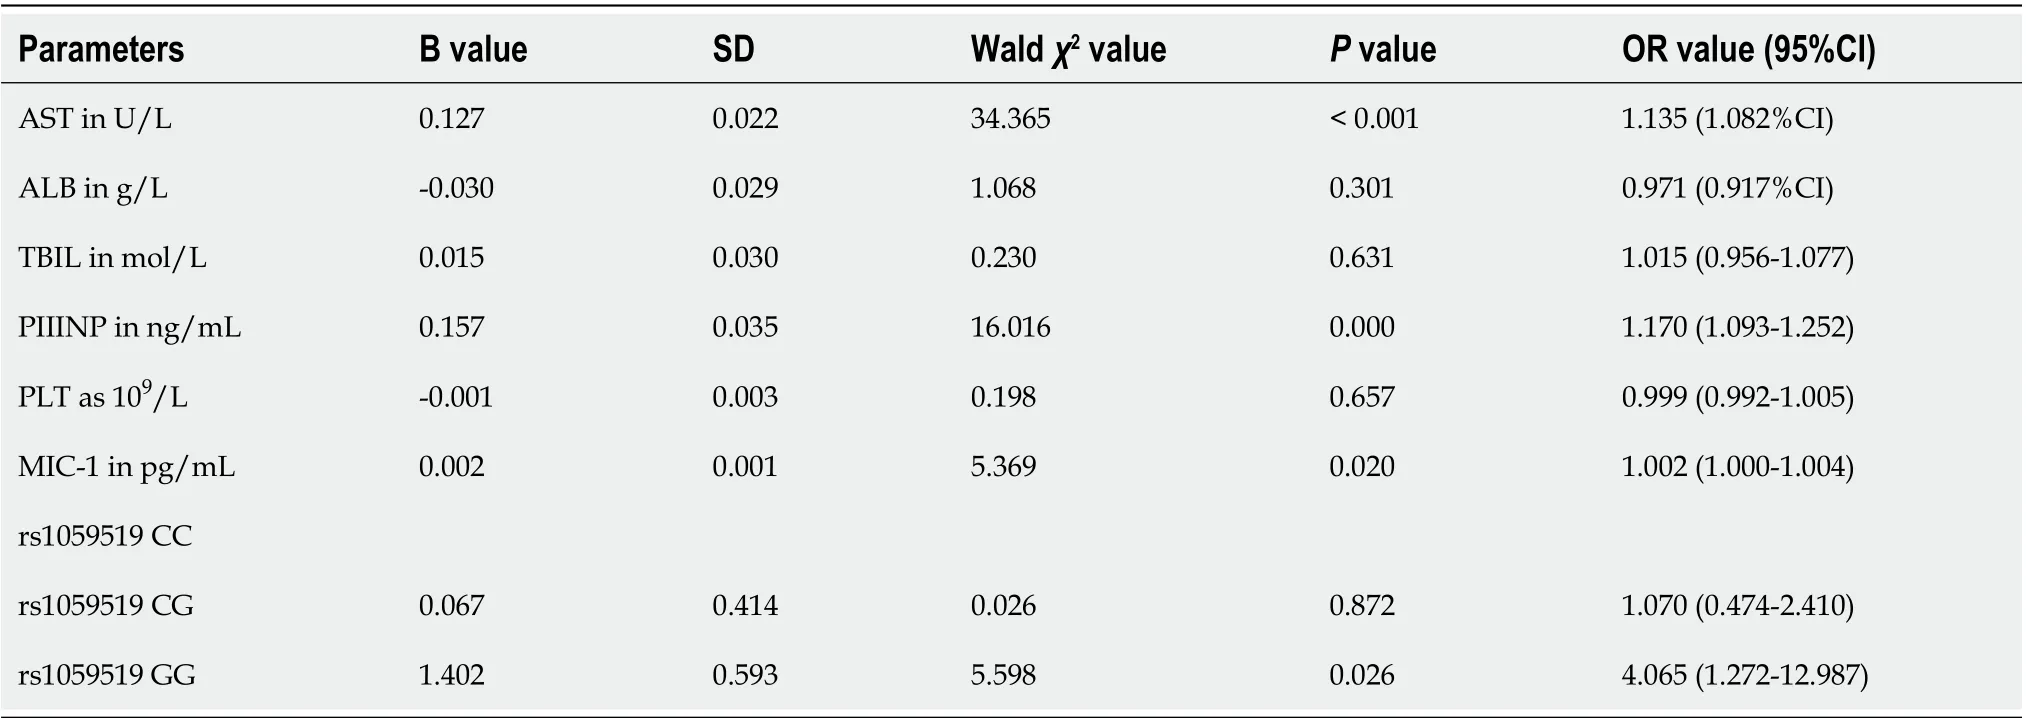
Table 3 Multivariate logistic regression analysis results of chronic hepatitis C and control group populations
This study has preliminarily explored the correlation betweenMIC-1gene polymorphism and chronic HCV infection. Since the subjects in this study were from Zhejiang Province, China, the sample size was small, and we did not include the number of spontaneous viral clearance (SVC) in this study for not meeting the statistical requirements, there may be selection deviation, and the role of MIC-1 in natural HCV clearance cannot be explored[33]. Future studies will need to expand the selection area and sample size, and increase the SVC group. Also, the correlation between the expression level and gene polymorphism ofMIC-1and the prognosis of CHC prognosis would need to be investigated.
CONCLUSION
In summary, the plasma MIC-1 level is increased in CHC patients, which is correlated with liver cell damage, liver fibrosis, and viral load. Polymorphism of theMIC-1gene rs1059519 locus affects the plasma content of this protein and is associated with HCV infection. The G allele may be a susceptibility factor, while the C allele and haplotype A-C at rs1059369/rs1059519 locus may be protective factors for CHC.
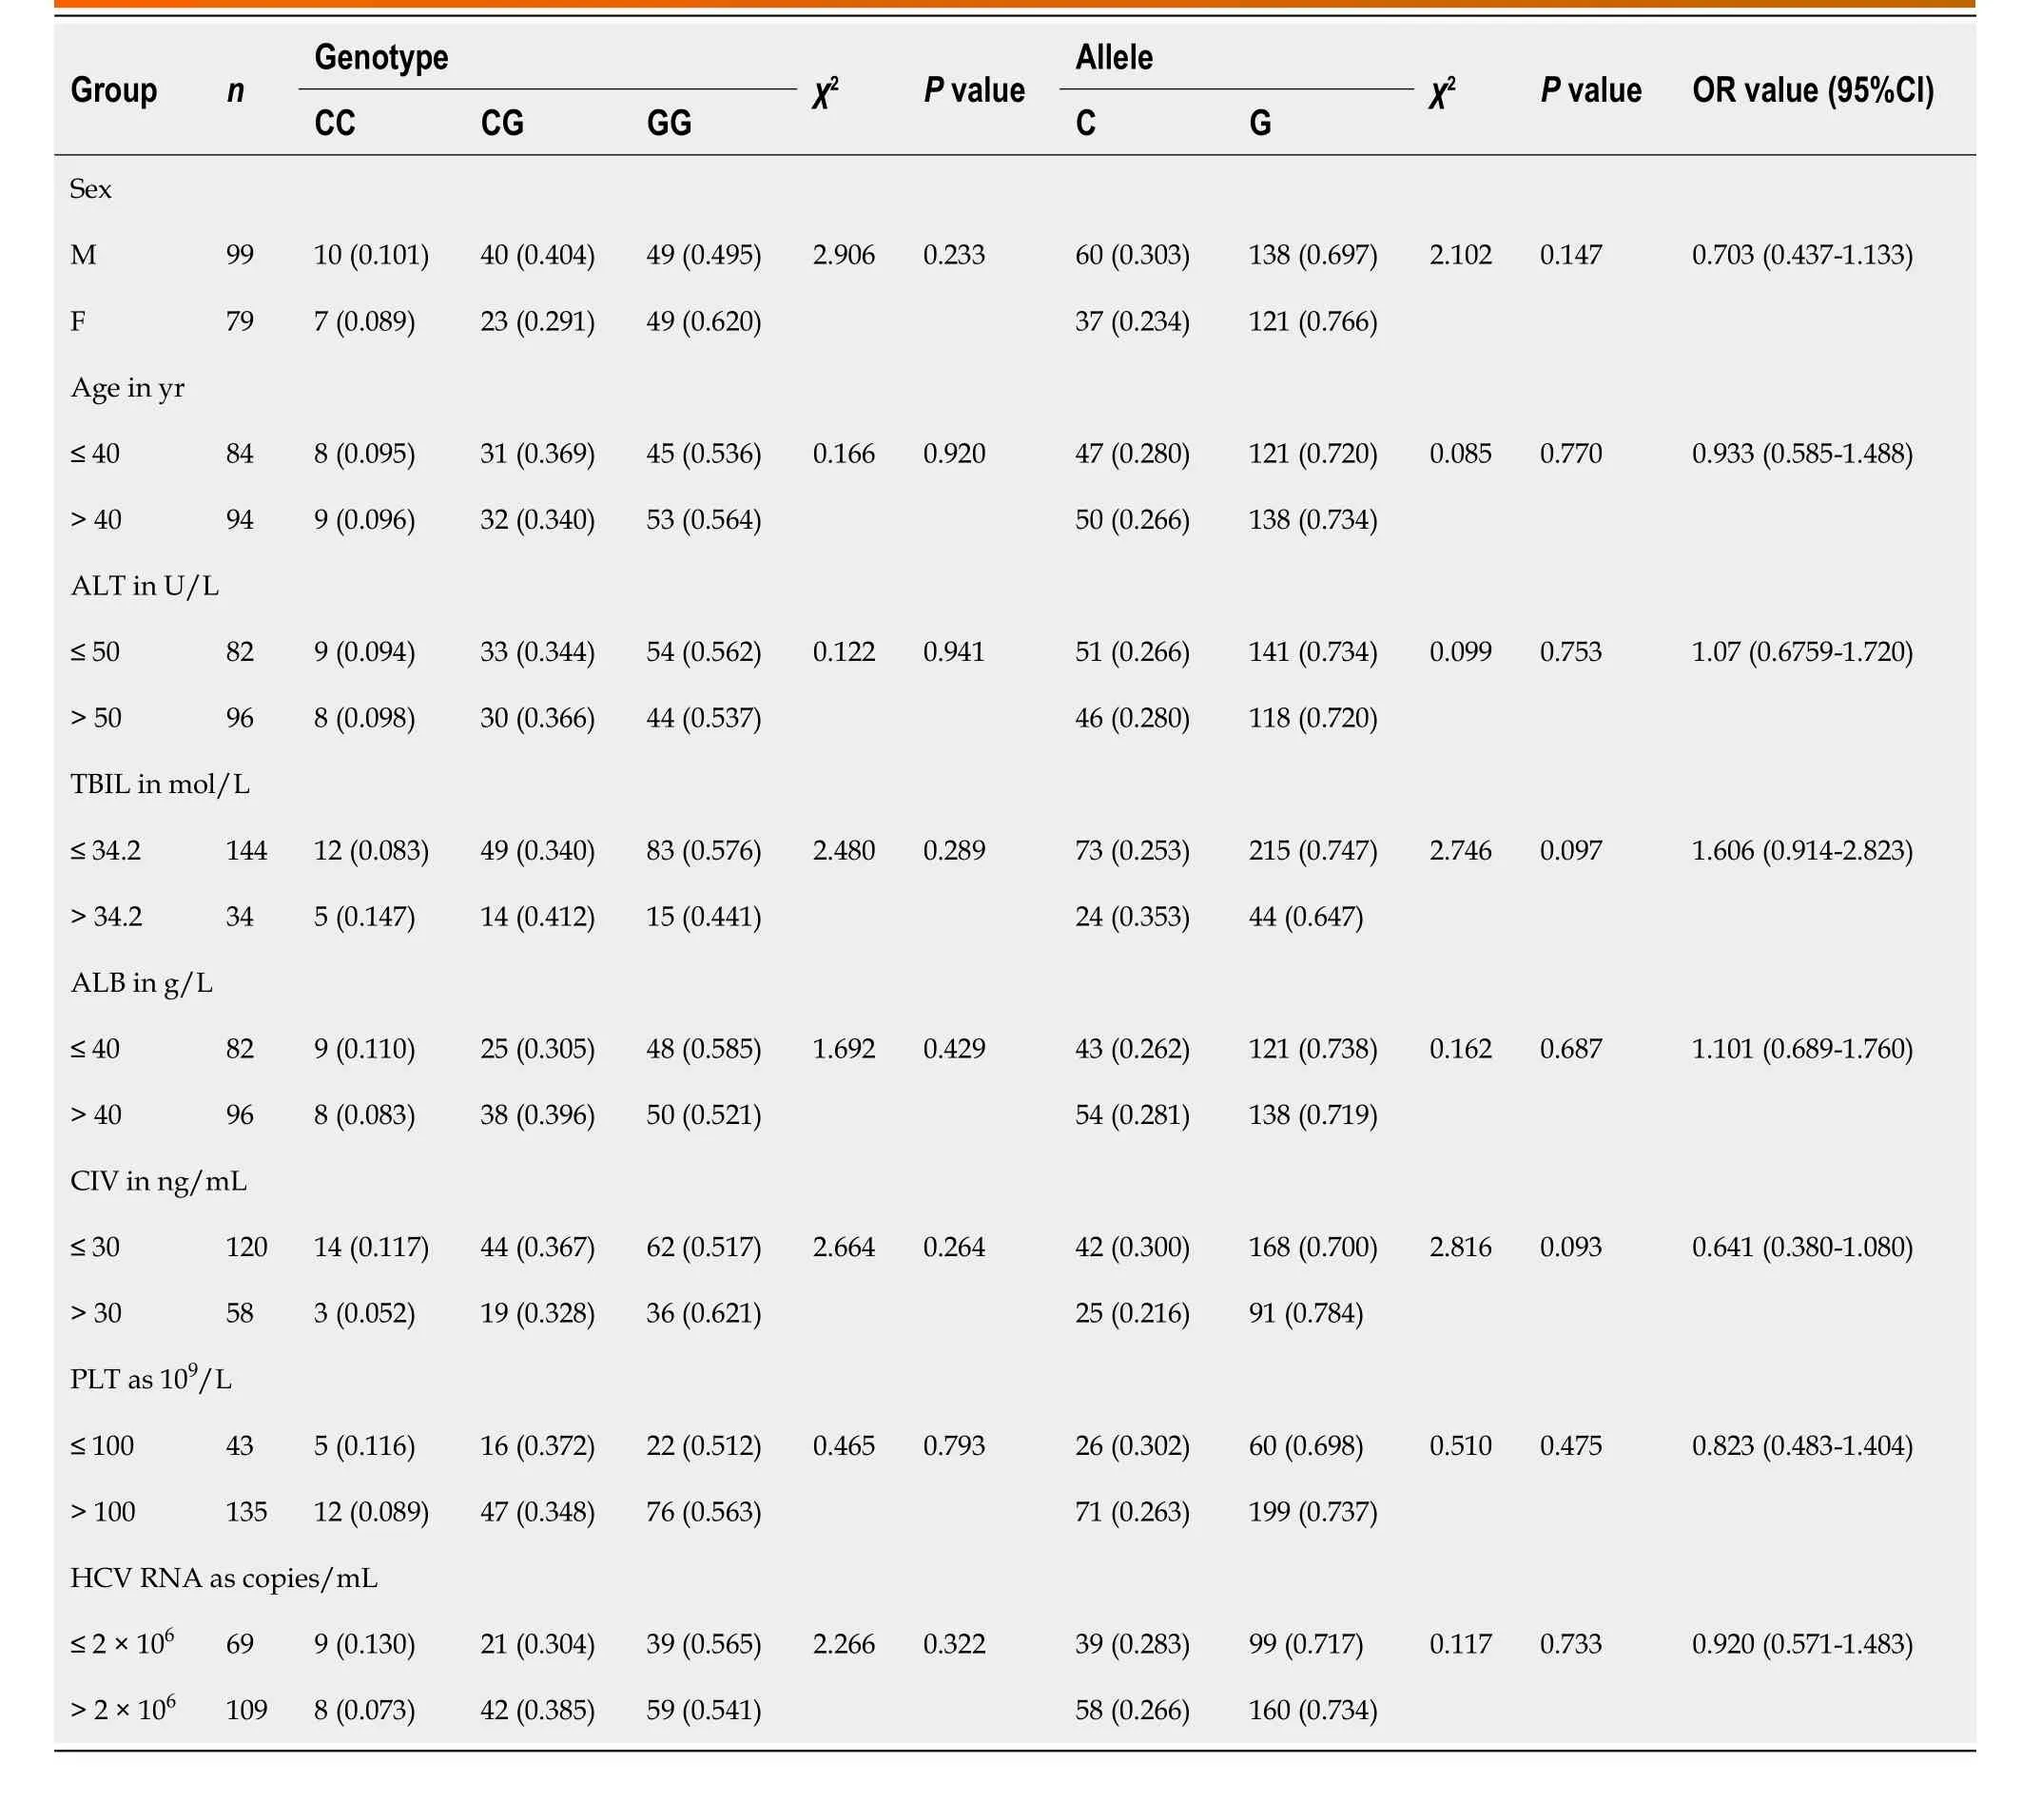
Table 4 Correlation between rs1059519 gene polymorphism and other parameters in chronic hepatitis C patients
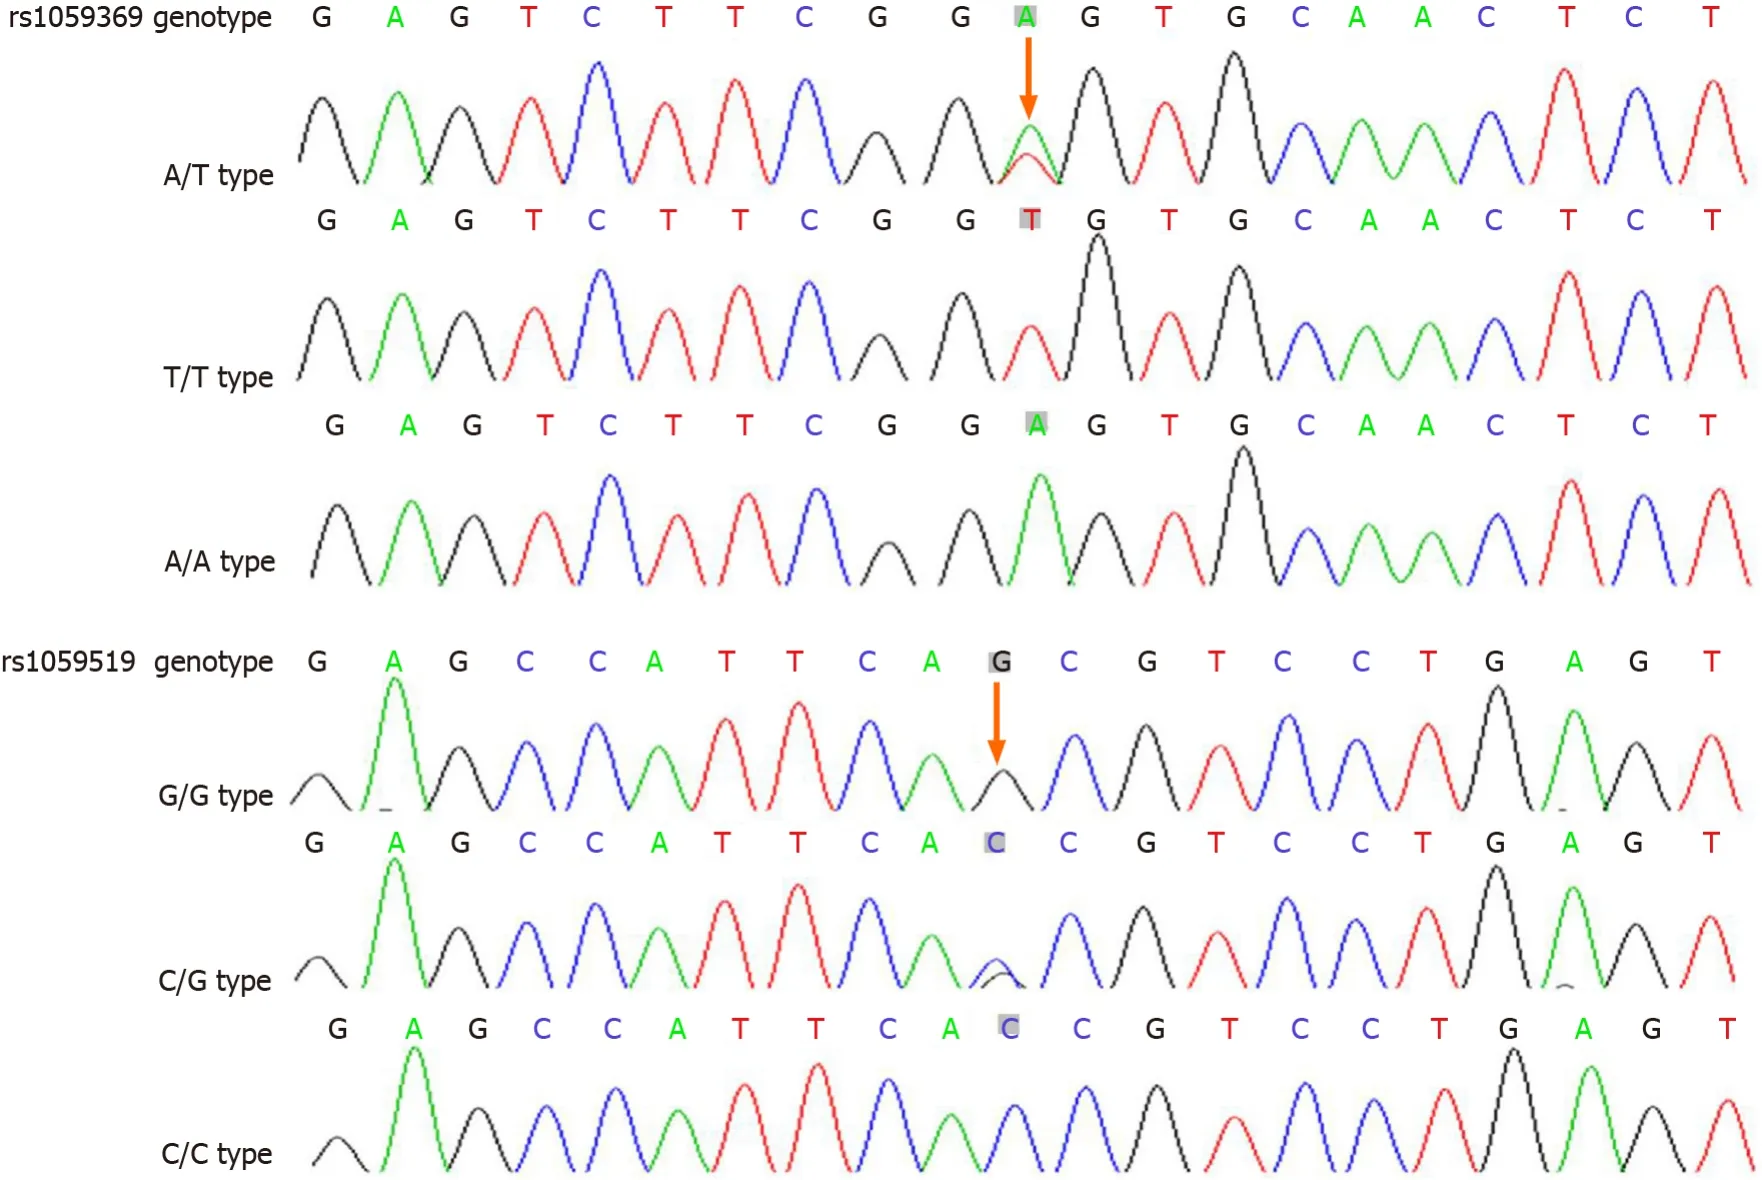
Figure 1 Sequencing map of macrophage inhibitory factor-1 gene polymorphic loci.
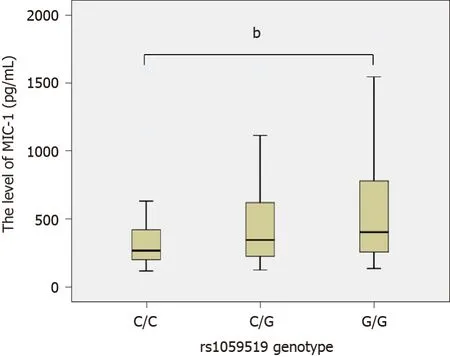
Figure 2 Comparison of the macrophage inhibitory factor-1 level among different genotypes at rs1059519 locus. The macrophage inhibitory factor-1 (MIC-1) levels of various genotypes at rs1059519 locus were as follows: For genotype CC, n = 33, M = 265.10, P5 = 117.45, P95 = 1271.05; for genotype CG, n = 99, M = 344.40, P5 = 146.40, P95 = 1373.30; and for genotype GG, n = 128, M = 401.65, P5 = 175.41, P95 = 1170.86. The rank-sum tests of various independent samples showed that statistically significant difference was observed in the MIC-1 level for different genotypes (χ2 = 10.183, P = 0.006), and GG genotype was significantly higher than CC genotype (bP = 0.009).
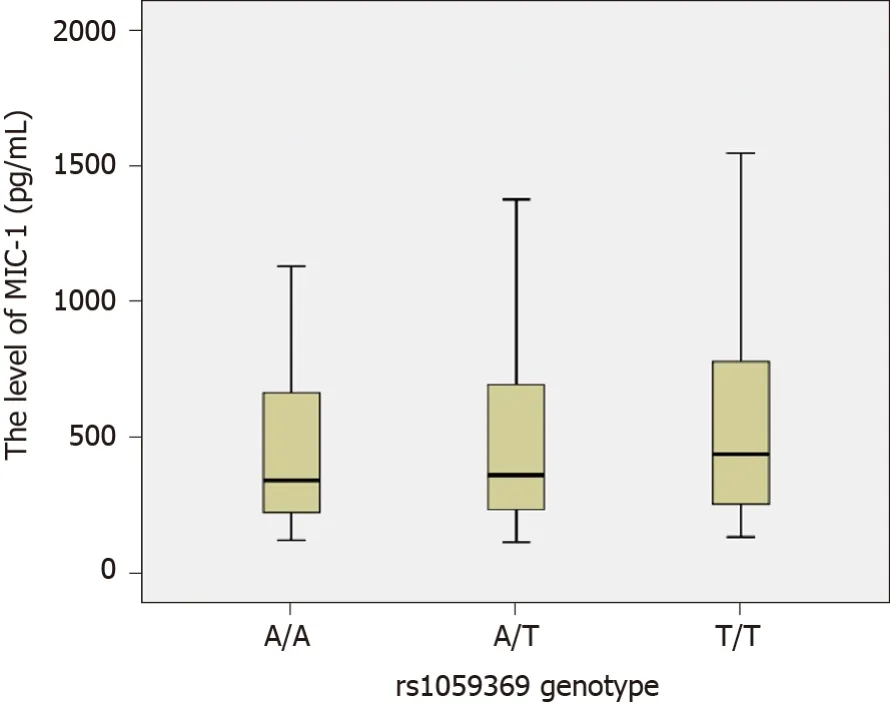
Figure 3 Comparison of the macrophage inhibitory factor-1 level among different genotypes at rs1059369 locus. The macrophage inhibitory factor-1 (MIC-1) levels of various genotypes at rs1059369 locus were as follows: for genotype AA, n = 90, M = 342.50, P5 = 158.09, P95 = 1096.12; for genotype AT, n = 127, M = 362.20, P5 = 146.76, P95 = 1194.38; and for genotype TT, n = 43, M = 438.80, P5 = 172.38, P95 = 1520.06. The rank-sum tests of various independent samples showed that no statistically significant difference was observed in the MIC-1 level for different genotypes (χ2 = 1.707, P = 0.426).
ARTICLE HIGHLIGHTS

Research conclusions
The plasma MIC-1 level in CHC patients is correlated with liver cell damage, liver fibrosis, and viral load. The polymorphism ofMIC-1gene at rs1059519 locus affects plasma MIC-1 level and is associated with HCV infection.
Research perspectives
As the number of spontaneous viral clearance (SVC) was far less than 20% among the CHC cases that we have collected and did not meet the statistical requirements, we had to exclude this group in this study for the time being. However, we will continue to collect more cases in the future, and add the SVC group to further study the relationship between MIC-1 and SVC. In addition, the correlation between MIC-1 and antiviral efficacy and prognosis of CHC is also worth further exploration.
ACKNOWLEDGEMENTS
We thank Lin W and other doctors from the Department of Infectious Diseases at The Second Affiliated Hospital of Wenzhou Medical University for their support and assistance in the recruitment, clinical diagnosis, and efficacy judgment of the chronic hepatitis C cases.
杂志排行

World Journal of Gastroenterology的其它文章
- Focus on gastroesophageal reflux disease in patients with cystic fibrosis
- Efficacy and safety of non-pharmacological interventions for irritable bowel syndrome in adults
- Endoscopic gastric fenestration of debriding pancreatic walled-off necrosis: A pilot study
- Older age, longer procedures and tandem endoscopic-ultrasound as risk factors for post-endoscopic retrograde cholangiopancreatography bacteremia
- Escalating complexity of endoscopic retrograde cholangiopancreatography over the last decade with increasing reliance on advanced cannulation techniques
- Efficacy and safety of anti-hepatic fibrosis drugs