Effective (kinetic freeze-out) temperature, transverse flow velocity, and kinetic freeze-out volume in high energy collisions
2020-12-08MuhammadWaqasFuHuLiuLiLiLiHaidarMasudAlfanda
Muhammad Waqas · Fu-Hu Liu· Li-Li Li · Haidar Mas’ud Alfanda
Abstract The transverse momentum spectra of different types of particles produced in central and peripheral gold–gold(Au–Au)and inelastic proton–proton(pp)collisions at the Relativistic Heavy Ion Collider, as well as in central and peripheral lead-lead (Pb–Pb) and pp collisions at the Large Hadron Collider, are analyzed by the multi-component standard (Boltzmann–Gibbs, Fermi–Dirac, and Bose–Einstein) distributions. The obtained results from the standard distribution give an approximate agreement with the measured experimental data by the STAR, PHENIX,and ALICE Collaborations. The behavior of the effective(kinetic freeze-out) temperature, transverse flow velocity,and kinetic freeze-out volume for particles with different masses is obtained,which observes the early kinetic freezeout of heavier particles as compared to the lighter particles.The parameters of emissions of different particles are observed to be different,which reveals a direct signature of the mass-dependent differential kinetic freeze-out.It is also observed that the peripheral nucleus–nucleus (AA) and pp collisions at the same center-of-mass energy per nucleon pair are in good agreement in terms of the extracted parameters.
Keywords Transverse momentum spectra · Effective temperature · Kinetic freeze-out temperature · Transverse flow velocity · Kinetic freeze-out volume
1 Introduction
A hot and dense fireball is assumed to form for a brief period of time (~a few fm/c) over an extended region after the initial collisions, which undergoes a collective expansion that leads to the change in the temperature and volume or density of the system. Three types of temperatures, namely the initial temperature, chemical freeze-out temperature, and kinetic freeze-out temperature, can be found in the literature, which describe the excitation degrees of an interacting system at the stages of initial collisions, chemical freeze-out, and kinetic freeze-out,respectively [1–7]. There is another type of temperature,namely the effective temperature, which is not a real temperature and it describes the sum of excitation degrees of the interacting system and the effect of transverse flow at the stage of kinetic freeze-out.
In principle,the initial stage of collisions happens earlier than other stages such as the chemical and kinetic freezeout stages. Naturally, the initial temperature is the highest,and the kinetic freeze-out temperature is the lowest among the three real temperatures, while the chemical freeze-out temperature is in between the initial and kinetic freeze-out temperatures. The collision system does not get rid of the simultaneity for chemical and kinetic freeze-outs, which results in the chemical and kinetic freeze-out temperatures to be the same. The effective temperature is often larger than the kinetic freeze-out temperature but is equal to the kinetic freeze-out temperature in case of zero transverse flow velocity.
To understand the given nature of the nuclear force and to break the system into massive fragments [8, 9], it is a good way to make the nucleons interact in nucleus–nucleus(AA) collisions at intermediate and high energies. Such a process provokes a liquid–gas type phase transition as a large number of nucleons and other light nuclei are emitted. In AA collisions at higher energies, a phase transition from hadronic matter to quark–gluon plasma (QGP) is expected to occur. The volume occupied by the source of such ejectiles, where the mutual nuclear interactions become negligible(they only feel the Coulombic repulsive force and not the attractive force), is said to be kinetic freeze-out volume and it has been introduced in various statistical and thermodynamic models [10, 11]. Similar to the kinetic freeze-out temperature, the kinetic freeze-out volume also gives the information of the coexistence of phase transition.This is one of the major factors,which are important in the extraction of vital observables such as multiplicity, micro-canonical heat capacity, and its negative branch or shape of caloric curves under the external constraints [12–16].
It is conceivable that the temperature (volume) of the interacting system decreases (increases) from the initial state to the final kinetic freeze-out stage. During the evolution process,the transverse flow velocity is present due to the expansion of the interacting system. The study of the dependence of effective (kinetic freeze-out) temperature,transverse flow velocity, and kinetic freeze-out volume on the collision energy, event centrality, system size, and particle rapidity is very significant. We are very interested in the aforementioned quantities in central and peripheral AA and (inelastic) proton–proton (pp) collisions at the Relativistic Heavy Ion Collider (RHIC) and the Large Hadron Collider (LHC) over a wide enough energy range in which QGP is expected to form.
The remainder of this manuscript is structured as follows. The formalism and method are described in Sect. 2.The results and discussion are given in Sect. 3. In Sect. 4,we summarize our main observations and conclusions.
2 Method and formalism
Generally,two main processes of particle production are under consideration, which includes the soft and hard excitation processes. The soft excitation process corresponds to strong interactions among multiple partons,while the hard excitation process corresponds to a more violent collision between two head-on partons. The soft excitation process has numerous choices of formalisms,including but not limited to the Hagedorn thermal model(statistical-bootstrap model) [17], the (multi-)standard distribution [18], the Tsallis and related distributions with various formalisms[19],the blast-wave model with Tsallis statistics [20], the blast-wave model with Boltzmann statistics [21–25], and other thermodynamics-related models [26–29]. The hard excitation process has very limited choices of formalisms and can be described by the perturbative quantum chromodynamics (pQCD) [30–32].
The experimental data of the transverse momentum (pT)spectrum of the particles are fitted using the standard distribution, which is the combination of Boltzmann–Gibbs,Fermi–Dirac,and Bose–Einstein distributions corresponding to the factor S=0, +1,and -1,respectively.The standard distribution at the mid-rapidity can be demonstrated as[18]
where the chemical potential is neglected. Here, N is the experimental number of considered particles,T is the fitted effective temperature, V′is the fitted kinetic freeze-out volume(i.e.,the interaction volume)of the emission source at the kinetic freeze-out stage, g=3 (or 2) is the degeneracy factor for pions and kaons(or protons),and m0is the rest mass of the considered particle. As a probability density function, the integral of Eq. (1) is naturally normalized to 1, i.e., we have∫pTmax0fS(pT)dpT=1, where pTmaxdenotes the maximum pT. At very high energy, the influence of S=+1 and -1 can be neglected. Only the Boltzmann–Gibbs distribution is sufficient to describe the spectra at the RHIC and LHC.
Considering the experimental rapidity range [ymin,ymax]around mid-rapidity, Eq. (1) takes the form
where the chemical potential μ is particle dependent,which we have studied recently [33]. In high energy collisions, μj(j=π, K, and p) are less than several MeV, which slightly affects V′comparedwith thatfor μj=0.Then,wemay regard μ ≈0 in Eq. (2) at high energies considered in the present study. In Eqs. (1) and (2), only T and V′are the free parameters.
Usually, we have to use the two-component standard distribution because single-component standard distribution is not enough for the simultaneous description of very low-(0 ~0.2-0.3 GeV/c) and low-pT(0.2–0.3 ~2-3 GeV/c or slightly more) regions, which are contributed by the resonance decays and other soft excitation processes,respectively.More than two or multi-component standard distributions can also be used in some cases. We have the simplified multicomponent (l-component) standard distribution to be In Eqs. (3) and (4), only Ti, V′i, and ki(i ≤l-1) are free parameters. Generally, l=2 or 3 is enough for describing the spectra in a not too wide pTrange.
Equations (1) or (2) and (3) or (4) can be used for the description of pTspectra and for the extraction of effective temperature and kinetic freeze-out volume in very low-and low-pTregions. The high-pT(>3-4 GeV/c) region contributed by the hard excitation process has to be fitted by the Hagedorn function[17],which is an inverse power law function, given by
where k is the contribution ratio of the soft process and gives a natural result in∫pTmax0f0(pT)dpT=1.In Eq.(6),the contribution of the soft process is from 0 to ~2-3 GeV/c,or even up to ~3-5 GeV/c at very high energy, and the hard component contributes to the whole pTrange.There is some mixing between the contributions of the two processes in the low-pTregion.
According to the Hagedorn model [17], the contributions of the two processes can be separated completely.One has another superposition
where θ(x)is the usual step function and A1and A2are the normalization constants, which make A1fS(p1)=A2fH(p1).Equation (7) gives the contribution of soft process from 0 to p1, while the hard component contributes from p1up to the maximum.
In the aforementioned two-component functions[Eqs.(6)and(7)],each component(fS(pT)and fH(pT))is a traditional distribution.The first component (fS(pT))is one of the Boltzmann–Gibbs, Fermi–Dirac, and Bose–Einstein distributions if we use a given S,such as S=0,+1,or-1.The second component (fH(pT)) is the Tsallis-like distribution[19]if we let n=1/(q-1)and p0=nTT,where q is the entropy index and TTis the Tsallis temperature.
We will use only the first component in Eq. (7) due to the reason that we are not studying a wide pTrange in the present work. In the case of neglecting the contribution of the hard component in the low-pTregion in Eq.(6),the first component in Eq. (6) gives the same result as that of the first component in Eq. (7). Equation (4) with l=2, which is the two-component standard distribution, is used in the present work. In addition, considering the treatment of normalization, the real fitted kinetic freeze-out volume should be V1=N1V′1/k1and V2=N2V′2/(1-k1), which will be simply used in the following section.
It should be noted that the value of l in the l-component standard distribution has some influences on the free parameters and then on the derived parameters. Generally,l=1 is not enough to fit the particle spectra.For l=2,the influence of the second component is obvious since the contribution of the first component is not sufficient to fit the particle spectra. For l=3, the influence of the third component is rather small because the main contribution is from the first two components, and the contribution of the third component can be neglected.
3 Results and discussion
3.1 Comparison with the data
The fitting in Figs. 1 and 2 for peripheral collisions appears to be worse compared to central collisions.This is caused by a statistical fluctuation and the effect of a cold spectator in peripheral collisions. In the region of the cold spectator, particles are produced by multiple cascade scattering processes which are different from the thermalization processes of particle production in the region of the hot participants. In addition, our fits are done in all ranges of pT<4.5 GeV/c. However, as an alternative model, the blast-wave fit takes different cuts of pTfor the analysis of different particles (see for instance Ref. [2]). These different cuts affect the extraction of parameters,in particular for the analysis of the trends of particles, which is not an ideal treatment.
We would like to point out that the vertical axes of Figs. 1, 2 and 3 are not the probability density function.We cannot fit them with Eq.(4)with l=2.Hence,we have done a conversion during our fitting. For Fig. 1, we have used the relation (1/2πpT)(d2N/dpTdy)=(1/2πpT)N0fS(pT)/dy for the conversion, where N0is the normalization constant in terms of particle number. For Fig. 2, we have used the relation d2N/dpTdy=N0fS(pT)/dy for the conversion, where Nevon the vertical axis is neglected because d2N/dpTdy is directly regarded as the result per event. For Fig. 3, we have used the relation Ed3σ/dp3=(1/2πpT)(d2σ/dpTdy)=(1/2πpT)σ0fS(pT)/dy in the conversion, where σ0is the normalization constant in terms of the cross section.
From Figs. 1,2 and 3 and Table 1,it can be seen that the fitting quality is not great in some cases. It should be pointed out that the model used in these fittings is for soft processes but is used for analyzing pTspectra up to 4.5 GeV/c.The high values of pTanalyzed in this study contain hard processes which could be responsible for the bad fitting as indicated by χ2in Table 1 and also in the ratio of data to the fitting of Figs. 1, 2 and 3. Then, it may seem necessary to attempt fitting by taking into account the function part corresponding to the hard process. However,the hard process is not necessary for extracting the parameters of the soft process.Although the fittings will be better if we also consider the contribution of the hard process, it is not useful for extracting the parameters considered in the present work.Therefore,we did not consider the contribution of the hard process.
3.2 Discussion on the parameters
Considering the contributions of the two components,the effective temperature averaged over the two components is T =k1T1+k2T2and the kinetic freeze-out volume by adding the two components is V =V1+V2.Further,the normalization constants contributed by the first and the second components are k1N0and k2N0, respectively.

Table 1 Values of parameters(T1,T2,V1,V2,k1,and N0(for Figs. 1 and 2)or σ0[for Fig. 3)],χ2,and the ndof corresponding to the solid curves in Figs. 1, 2 and 3
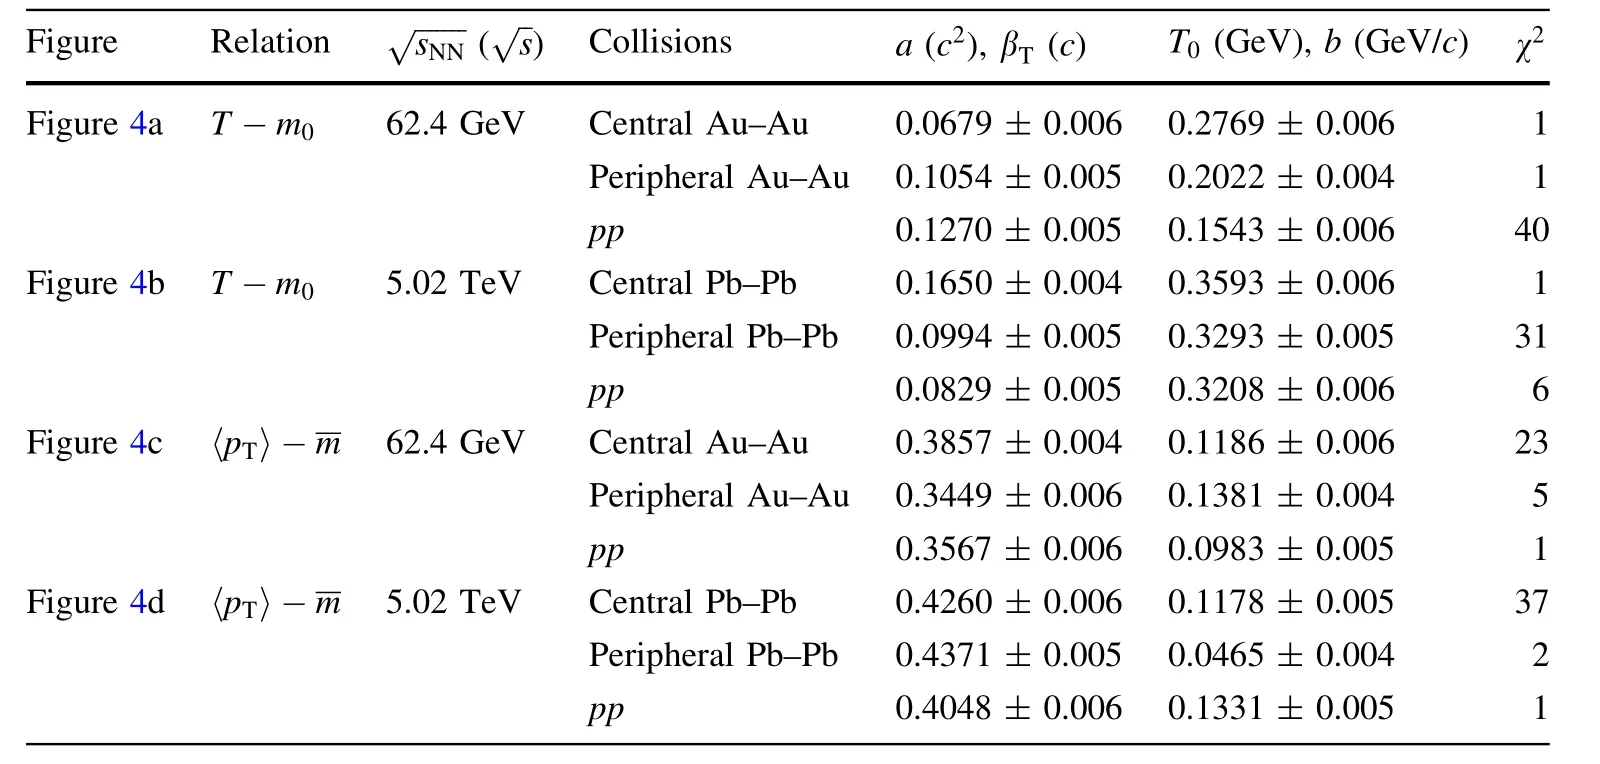
Table 2 Values of slopes,intercepts, and χ2 in the linear relations T =am0+T0 and〈pT〉=βT m+b, where T, m0(m), and 〈pT〉 are in the units of GeV, GeV/c2 and GeV/c,respectively
It should be noted that although Fig. 4 also shows the enhancement of T when m0increases, this has been observed in many experiments and was reported for the first time by NA44 Collaboration [45] as evidence of the flow.This result was from a fit of pTto a thermal model for π-, K-, and ¯p. This indicates that the use of the twocomponent source model is unnecessary to observe the enhancement of T when m0increases. Although one can arrive at the same conclusion using a single-component source model, the two-component source model can describe well the pTspectra.In addition,including the hard component, the model can describe better the pTspectra.
The mass dependence of T(T0)and βTexists because it reflects the mass dependence of〈pT〉.We do not think that the mass dependence of T (T0) and βTis a model dependence, though the values of T (T0) and βTthemselves are model dependent.In our fittings,we have used the same pTrange for π-, K-, and ¯p, while in the blast-wave fitting,different pTranges were used for the three types of particles[2].The treatment by the latter increases the flexibility in the selection of parameters.
Figure 5a shows the dependences of kinetic freeze-out volume V on rest mass m0for production of negatively
Figure 6 shows the dependences of T on V for the production of negatively charged particles in (a) central and peripheral Au–Au collisions as well as in pp collisions at 62.4 GeV, and in (b) central and peripheral Pb–Pb collisions as well as in pp collisions at 5.02 TeV. The filled,empty, and half-filled symbols represent central AA,peripheral AA,and pp collisions,respectively.One can see that T decreases with the increase in V in the central and peripheral AA and pp collisions. This result is natural due to the fact that a large V corresponds to a long kinetic freeze-out time and then a cool system and a low T.
As we have not done any systematic analysis of the mass dependence of T0(βT) in the present work, we shall not study the relation between T0(βT) and V, though we can still predict the trend. As a supplement, our recent work[46] reported the mass dependence (slight dependence) of T0(βT)using the same method as used in the present work,but using the Tsallis distribution as the‘‘thermometer.’’We understand that with increasing m0(decreasing V), T0would increase naturally, and βTwould decrease slightly.
From Figs. 4,5 and 6,one can see that T,T0,βT,and V obtained from collisions at the LHC are larger than those obtained from the collisions at the RHIC. This is expected due to more violent collisions happening at higher energy.However, from the RHIC to LHC, the increase in the collision energy is considerably large, and the increases in T, T0, βT, and V are relatively small. This reflects the penetrability of the projectiles in the transparent target. In addition, pions correspond to a larger V than protons in some cases. This is caused by the fact that pions have larger βTand thus reach larger distance than protons due to the smaller m0in the case of the former at similar momenta for pions and protons at the kinetic freeze-out. This hypothesis is true because V is a reflection of multiplicity,and the experimental results indicate an enhancement in the hadron source with the multiplicity.
The result that pions correspond to a much larger V than protons indicates that the protons cease to interact while pions are still interacting. One may think that pions and protons stop interacting in different V, where large V corresponds to long interaction time. As protons have larger m0than pions, protons are left behind as the system evolved from the origin of collisions to the radial direction,which is the behavior of hydrodynamics [47]. This results in the volume-dependent freeze-out scenario that shows the early freeze-out of heavier particles as compared to the lighter particles [10, 11]. Thus, pions correspond to larger interacting volumes than protons, at the kinetic freeze-out stage.
To further study the dependences of T and V on centrality and collisions energy, Table 3 compiles the values of average T (〈T〉) and average V (〈V〉) for different types of collisions at the RHIC and LHC. These averages are obtained by different particle weights due to different contribution fractions (V) of π-, K-, and ¯p. One can see that 〈T〉 and 〈V〉 at the LHC are larger than those at theRHIC.Generally,the value of T lies between Tchand T0.In particular,Tchin central AA collisions is approximately 160 MeV,and T0in central AA collisions is less than 130 MeV[26,27,48,49].However,the values of〈T〉in Table 3 are larger because of Eq. (4) was used. Equation (4) contains the contributions of both thermal motion and flow effect,which can be regarded as a different ‘‘thermometer’’ from the literature [26, 27,48–50]and results in different T that is beyond the general range of [Tch,T0].
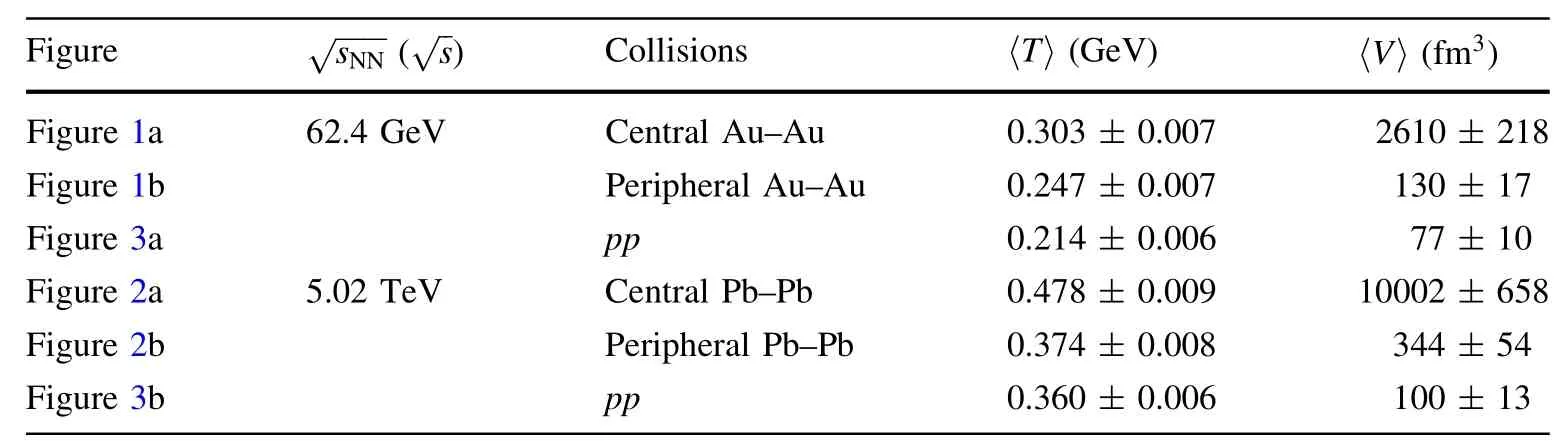
Table 3 Values of 〈T〉 and 〈V〉for different types of collisions at the RHIC and LHC
Although the absolute values of T (T0) and βTobtained in the present work are possibly inconsistent with other results,the relative values are worth considering.Similar is true for V. The present work shows that V in central and peripheral Pb–Pb and pp collisions at 5.02 TeV is also larger than that in central and peripheral Au–Au and pp collisions at 62.4 GeV.This shows a strong dependence of the parameters on the collision energy. Furthermore, V in central and peripheral Pb–Pb collisions is larger than that in central and peripheral Au–Au collisions also shows parameter dependence on the size of the system, though this dependence can be neglected due to a small difference in the size.The dependence of collision energy and system size is not discussed here in detail because of the unavailability of a wide range of analyses but it can be focused in future work.
3.3 Further discussion
Before the summary and conclusions, we would like to point out that the method that the related parameters can be extracted from the pTspectra of the identified particles seems approximately effective in high energy collisions.At high energy (dozens of GeV and above), the particle-dependent chemical potential μ is less than several MeV,which affects the parameters less.Equations(1)–(4)can be used in the present work. We believe that our result on the source volume for pp collisions being larger than that(~34 fm3) by the femtoscopy with two-pion Bose–Einstein correlations [51] is caused by the use of different methods.
At intermediate and low energies,the method used here seems unsuitable due to the fact that the particle dependent μ at kinetic freeze-out is large and unavailable. In general,the particles of different species develop μ differently from chemical freeze-out to kinetic freeze-out. This seems to result in more difficulty in applying Eqs. (1)–(4) at intermediate and low energies. μ has less influence on the extraction of source volume due to its less influence on the data normalization or multiplicity.
As we know, the source volume is proportional to the data normalization or multiplicity.Although we can obtain the normalization or multiplicity from a model, the obtained value is almost independent of the model.In other words, the normalization or multiplicity reflects the data,but not the model itself.Different methods do not affect the source volume considerably due to the normalization or multiplicity being one of the main factors, if not the only one. In the case of using a significant μ, neglecting the radial flow, and using T, there is no considerable influence on the normalization or multiplicity, then on the source volume.
In addition, although we use the method of linear relation to obtain T0and βTin the present work, we used the blast-wave model [20, 21, 24, 25] to obtain the two parameters in our previous works[22,43,44].Besides,we could add indirectly the flow velocity in the treatment of standard distribution [52]. Because of different ‘‘thermometers’’ (fit functions) being used in different methods,the‘‘measured’’temperatures have different values,though the same trend can be observed in the same or similar collisions. The results obtained from different ‘‘thermometers’’ can be checked with each other.
In particular, we obtained a higher temperature, though it is also the kinetic freeze-out temperature and describes the excitation degree of emission source at the kinetic freeze-out stage.We cannot compare the T0obtained in the present work with Tchused in the literature directly due to different ‘‘thermometers.’’We found that the present work gives the same trend for main parameters when we compare them with our previous works[22,43,44],which used the blast-wave model [20, 21, 24, 25]. It may be possible that the relative size of the main parameters in central and peripheral collisions as well as in AA and pp collisions will be the same if we use the standard distribution and the blast-wave model.
It should be pointed out that although we have studied some parameters at the stage of kinetic freeze-out, the parameters at the stage of chemical freeze-out are lacking in this study. In fact, the parameters at the stage of chemical freeze-out are more important[53–58]to map the phase diagram in which μ is an essential factor. Both the Tchand μ are the most important parameters at the chemical freeze-out stage. In the extensive statistics and/or axiomatic/generic non-extensive statistics [53–55], one may discuss the chemical and/or kinetic freeze-out parameters systematically.
Reference [56] has tried to advocate a new parametrization procedure rather than the standard χ2procedure with yields. The authors constructed the mean value of conserved charges and have utilized their ratios to extract Tchand μ. Reference [57] evaluated systematic error arising due to the chosen set of particle ratios and constraints. A centrality dependent study for the chemical freeze-out parameters [58] could be obtained. Meanwhile,with the help of the single-freeze-out model in the chemical equilibrium framework[59,60],reference[61]studied the centrality dependence of freeze-out temperature fluctuations in high energy AA collisions.
We are very interested to do a uniform study on the chemical and kinetic freeze-out parameters in the future.Meanwhile, the distribution characteristics of various particles produced in high energy collisions are very abundant[62–65], and the methods of modeling analysis are multiple. We hope to study the spectra of multiplicities, transverse energies,and transverse momenta of various particles produced in different collisions by a uniform method, in which the probability density function contributed by each participant parton is considered carefully.
4 Summary and conclusions
We summarize here our main observations and conclusions
(a) Main parameters extracted from the transverse momentum spectra of identified particles produced in central and peripheral Au–Au collisions at 62.4 GeV and Pb–Pb collisions at 5.02 TeV were studied.Furthermore, the same analysis was done for pp collisions at both RHIC and LHC energies.The twocomponent standard distribution was used, which included both the very soft and soft excitation processes. The effective temperature, kinetic freezeout temperature,transverse flow velocity,and kinetic freeze-out volume were found to be larger in central collisions as compared to that in the peripheral collisions, which shows higher excitation and larger expansion in central collisions.
(b) Effective temperatures in central and peripheral Au–Au (Pb–Pb) collisions at the RHIC (LHC) increased with increasing the particle mass, which showed a mass-dependent differential kinetic freeze-out scenario at RHIC and LHC energies.The kinetic freezeout temperature is also expected to increase with increasing the particle’s mass.The kinetic freeze-out volume decreased with the increase of particle mass that showed different values for different particles and indicated a volume-dependent differential kinetic freeze-out scenario. The transverse flow velocity is expected to decrease slightly with the increase of particle mass.
(c) Effective(kinetic freeze-out)temperatures in peripheral Au–Au and pp collisions at 62.4 GeV as well as in peripheral Pb–Pb and pp collisions at 5.02 TeV were, respectively, similar and had a similar trend,which showed similar thermodynamic nature of the parameters in peripheral AA and pp collisions at the same center-of-mass energy (per nucleon pair).Effective (kinetic) freeze-out) temperatures in both central and peripheral AA and pp collisions decreased with an increase in the kinetic freeze-out volume. The transverse flow velocity is expected to increase slightly with the increase in the kinetic freeze-out volume in the considered energy range.
(d) Effective(kinetic freeze-out)temperature,transverse flow velocity, and kinetic freeze-out volume in central and peripheral AA and pp collisions at the LHC were larger than those at the RHIC, which showed their dependence on collision energy. Also,central (peripheral) Pb–Pb collisions rendered slightly larger effective (kinetic freeze-out) temperature,transverse flow velocity,and kinetic freeze-out volume than central (peripheral) Au–Au collisions.This showed the dependence of the parameters on the size of the system, which could be neglected for Pb–Pb and Au–Au collisions due to their small difference in the size.
杂志排行

Nuclear Science and Techniques的其它文章
- Analytic RF design of a linear accelerator with a SLED-I type RF pulse compressor
- Preliminary analysis of fuel cycle performance for a small modular heavy water-moderated thorium molten salt reactor
- Design, assembly, and pre-commissioning of cryostat for 3W1 superconducting wiggler magnet
- Simulation-based correction of dose enhancement factor values in photon brachytherapy with metal nanoparticle targeting
- Preliminary evaluation of the radiotherapeutic efficacy of 131I-atorvastatin in rats with hepatocellular carcinoma
- Design of a 162.5 MHz continuous-wave normal-conducting radiofrequency electron gun