Determination of the major geochemical processes of groundwater along the Cretaceous-Tertiary boundary of Trichinopoly,Tamilnadu, India
2020-11-10DevarajChidambaramVasudevanPradeepNepolianPrasannaAdithyaThilagavathiThivyaBanajaraniPanda
N. Devaraj · S. Chidambaram · U. Vasudevan · K. Pradeep · M. Nepolian ·M. V. Prasanna· V. S. Adithya · R. Thilagavathi · C. Thivya ·Banajarani Panda
Abstract The hydrogeochemical variations in groundwater are mainly influenced by lithology, residence time of water in the aquifer matrix, and anthropogenic activities.This study was focused on the geochemical variations of groundwater in different lithological units (Archaean,Cretaceous,Tertiary,and Quaternary)by understanding the major factors governing the geochemical variations in each lithology. The 71 groundwater samples were collected from these rock types, namely, Archaean (14), Cretaceous(37), Tertiary (11), Quaternary (9). The collected samples were measured for major ions and they were used for preparation of standard geochemical plots and ionic ratios.Factor analysis and factor score were used to identify the major factors controlling the hydrochemistry and their spatial distribution in the study area. In addition, geochemical model, WATEQ 4F was used to determine the saturation condition of carbonate and sulphate minerals in the groundwater.Na-Cl and mixed Ca-Na-HCO3 were the dominant hydrochemical facies irrespective of lithological units. The overall interpretation of geochemical data revealed that leaching of secondary salts, weathering and ion exchange reaction along the groundwater flow path through various lithological units, and anthropogenic influence from domestic sewages and agricultural activities constitute the major geochemical processes in the study area. Hence, this study brings out the multiple hydrogeochemical process in the complex geological terrain along the Cretaceous-Tertiary boundary.
Keywords Groundwater · Geochemical process · Major ions · Correlation · Factor analysis
1 Introduction
The hydrogeochemical processes such as ion exchange,dissolution, and precipitation of minerals through water-rock interactions and various anthropogenic activities influence the groundwater chemistry (Aref and Roosta 2016; Ayed et al. 2017; Kim et al. 2019; Ahmed et al.2019). These hydrogeochemical processes are the major controlling factors for the spatial and temporal variations in groundwater composition (Singh et al. 2011, 2017; Rina et al. 2013a, b; Arslan 2017; He et al. 2017; Savic et al.2018). Researchers have identified several other factors governing the groundwater chemistry such as rate of flow of groundwater, infiltration from surface saline water,through wastewater, upward flow from deep salt diapir or saline water and seawater intrusion (Araguas Araguas 2003;Aunay et al.2006;Carol et al.2009;Ferchichi et al.2017; Senthilkumar et al. 2018; Acharya et al. 2019).
Hydrogeochemical studies of groundwater from different lithological units help us to understand the variation in chemical composition of each formation. The contribution of the characteristics of the different geochemical processes of each formation plays a complex role in governing the geochemical nature of the groundwater in the region with multiple lithology.Several authors(Singh et al.2013;Adithya et al. 2016; Thilagavathi et al. 2017; Olofinlade et al.2018;Mallick et al.2018;Li et al.2019)reported that the heterogeneities of geology control the hydrogeochemical processes on varied scales.Similarly,studies of Champ et al.(1979),Morgan-Jones and Eggboro(1981),and Pucci and Owens (Pucci et al. 1979) had claimed that heterogeneities between aquifer and confining unit have affected the regional hydrogeochemical process. The chemical interaction of calcite and chlorite of Otago Schist (distinctively flat-lying terrain with platy minerals such as biotite, micas, and muscovite- forming foliated schist in Central Otago) was inferred to be responsible for higher concentration of Ca2+, Mg2+andin the surface and groundwater (Litchfield et al. 2002). Back (1966)suggested that increases in bicarbonate (HCO3) concentration could have been caused by dissolution of calcareous material and infiltration of calcium carbonate (CaCO3)from overlying marine strata into the underlying nonmarine formation. This present study is made more interesting due to hydrochemical studies on different lithological units(Archaean,Cretaceous,Tertiary and Quarternary)because of the variation in the composition, nature of weathering, porosity, and permeability of these aquifers.Several localized hydrogeochemical studies have attempted to address the role of weathering in groundwater chemistry,regulating the concentration of dissolved ions in groundwater (Thivya et al. 2015; Mehra et al. 2016; Saravanan et al. 2016; Loganathan and Jafar Ahamed, Loganathan and Ahamed 2017; Kumar et al. 2017; Saravanan et al. 2018). A similar hydrogeochemical study by Chidambaram et al. (2007) in the north of the present study area with varied lithology concluded that the release of HCO3into the groundwater is mainly governed by the process of weathering and partial pressure of carbon dioxide (pCO2). The variation in pCO2along with lithology controls the saturation states of minerals. Globally,several investigations to understand the geochemical processes responsible for the variation in hydrogeochemistry along the KT boundary have already been undertaken;albeit,hydrogeochemical studies along the KT boundary of Trichnopoly, Tamil Nadu, India are scarce. Hence, it has become imperative to determine the major geochemical processes controlling the hydrogeochemistry of groundwater and characterize the geochemical nature in the Archaean,Cretaceous,Tertiary,and Quaternary aquifers of the study area.
1.1 Study area
The present study area is located between 11° 449′to 10°974′north latitude and 78° 808′E to 79° 275′E (Fig. 1)covering an area of about 1.774 km2.The study area forms a part of Cauvery basin,which lies in the southeast coast of India. It consists of a thick (5-6 km) pile of syn-rift(more than 1000 m) and post-rift (about 5000 m) sedimentary rocks resting over the Archaean basement(Rangaraju et al.1993). Well exposure of Cauvery basin’s sediments in linear patches are found in Ariyalur, Virdhachalam(Tamilnadu) and in Pondicherry district. Uttatur, Trichinopoly, and Ariyalur are the 3 major stratigraphic formations of Ariyalur region (Blanford 1862). The Cretaceous sediments of Ariyalur region were studied for the ammonites and foraminifera (Sastry 1968; Ayyasami 1990; Hart et al.2001).The Ariyalur Formation,which is the focus of the present study,is exposed along the east and northeast of the Ariyalur town. The Cretaceous succession of Cauvery basin has divided the Ariyalur formation as Sillakkudi,Kallankurichchi, Ottakovil, and Kallamedu on the basis of its recent lithostratigraphic classification. The Ariyalur Formation overlies the Trichinopoly Formation (Table 1).There are several reports available on these sedimentary rocks including stratigraphy succession, fossil contents,clay minerals, geochemical characteristic, and tectonic evolution. The Ariyalur Formation representing the Mesozoic succession and detailed studies regarding stratigraphy, fossil content, paleoclimatic evolution and tectonic characteristic of the succession were carried out by different researchers (Nair 1974; Banerji 1979; Ramanathan 1979; Sundaram and Rao 1986; Ramasamy and Banerji 1991;Ramasamy et al.1995;Govindan et al.1996;Madhavaraju and Ramasamy 1999; Sundaram et al. 2001;Madhavaraju et al. 2002; Ayyasami 2006). Except Kallamedu Formation, all other deposits of the Ariyalur Formation are marine(Sundaram and Rao 1986;Madhavaraju and Lee 2009). Unfossiliferous calcareous sandstones are found in the basal part of Sillakkudi Formation which became thinner toward the northern part; but, it is wellexposed in the central and southern part of the study area.Major portion of the Sillakkudi Formation is represented by sandstone. The Kallankurichchi Formation rests on the Sillakkudi Formation.
1.1.1 Archaean
Groundwater in the Archaean aquifer is fissured and fractured formations have been observed spatially located along the western portion of study area.Small exposures of Achaean rocks,also known as basement of crystalline rock have been observed in the northwestern side of the study area. They consist mainly of Peninsular Gneiss (Bhavani Group), schists, granites, and charnockites. Since this formation is a hard rock aquifer, the permeability is lower than the other sedimentary formations observed in the study area. The transmissivity in this formation ranges from 32 to 80 m2/d; whereas, the specific yield is 1.5 %.The yield of wells is ranging from 1 to 2 lps (CGWB 2009).

Table 1 Geological succession of the study area
1.1.2 Cretaceous
The combination of all the older and deeper sedimentary rock forms the Cretaceous aquifer.White sandy limestone,fossiliferous sandstone, fossiliferous calcareous mottled sandstones, shelly limestone, basal limestone, fossiliferous clay and sandy beds represent the Cretaceous formation.The groundwater of sandy clay lenses and fine sand overlies the clay beds. There are 5 phreatic aquifers ranging between 10 and 15 m below ground level. The transmissivity in this formation ranges from 33 to 772 m2/d;,whereas,the specific yield is ranging from 0.3%to 2.5%.The yield of wells is ranging from 1 to 3.5 lps (CGWB 2009).
1.1.3 Tertiary
The Tertiary Formation is represented by Cuddalore sandstone, comprising mottled ferruginous clay and pebbles. Both semi-confined and confined aquifers have been reported to have good groundwater potential in this formation. The transmissivity in this formation was found to range from 43 to 52 m2/d; whereas, the specific yield is ranging from 1.5%to 2.5 %.The yield of wells is ranging from 1 to 2 lps (CGWB 2009).
1.1.4 Quaternary
The Quaternary Formation aquifer has a maximum and average thickness of 37 m and 14 m.The litho-units of this formation are both porous and permeable and have a good water- yielding capacity. The transmissivity in this formation was found to range from 49 to 216 m2/d; whereas,the specific yield is 7.2 %. The yield of wells is ranging from 10 to 20 lps (CGWB 2009).
1.2 Rainfall and climate
The Ariyalur region obtains considerable rainfall throughout the NE monsoon (45.9 %), SW monsoon (39.6 %),winter (2.8 %), and summer (11.7 %). It receives a standard annual rainfall of 1096 mm. The atmospheric temperature showed that the hot months are April, May, and June with the high temperature from 38 to 39 °C, and the cool months being January and February with the lowest temperature from 20 to 21 °C (CGWB 2009). Humidity varies from 38 % to 60 %, high during NE monsoon. This region experiences tough winds during the SW monsoon.The wind rate is >25 km/h from June to August.
1.3 Water level
The groundwater level in this study area varies according to the formation. The groundwater occurred in semi-confined and confined aquifers with good groundwater potential.The Alluvial bordering the north of River Vellar is developed by dug wells to a depth ranging from 12 to 37 mbgl.
1.4 Land use
The land use types in the study area consist of agricultural/forest land,plantation/orchard,wasteland,scrub land,and water bodies (river, stream, lake, reservoir, tank, and canal).The total area of agricultural land is about 1102.9 km2(62.16 %).Plantation/Orchard is represented in the northern and eastern parts covering the 111.6 km2(6.29 %).Wasteland is identified in the central region and occupies an area of 122.9 km2(6.88 %).Scrub land is found all over the study area and occupies 55.79 km2(3.14 %). Both artificial and natural water bodies, included as water bodies, are rivers,streams,lakes,tanks,and reservoirs.The water bodies cover about 380.7 km2(21.45 %)of the total study area.
2 Methodology
A total of 71 groundwater samples were collected from hand pumps at various depth by covering different rock types of the study area (Archaean (14), Cretaceous (37), Tertiary (11),Quaternary(9)(Fig. 2).Water samples were collected in 1-l polythyne bottle during the month of August 2014.The in situ parameters, such as pH, total dissolved solids (TDS), and electrical conductivity (EC) were measured by using a portable water analysis kit(Thermo Orion)in the field.The instrument was calibrated using standard solution of pH and EC. The collected samples were sealed and brought to the laboratory and stored at 4 °C.Subsequently,the samples were filtered with 0.45-μm filter paper before analysis. The collected samples were measured for major ions.Ca2+and Mg2+were analyzed by EDTA titration;Cl by AgNO3titration andby HCL titration. Na+and K+were analyzed by Flame photometry(CL 378),and the range was 1-100 ppm with an accuracy of ± 1 digit.and H4SiO4were analyzed byusing spectrophotometer(DR 6000,HACH)and the range was 340-1000 nm with an accuracy of± 2.5 nm.Noreplicateswere analyzedforthesesamples.The reliability of the results was determined by the ionic balance,and an error percentage of 5 %-10% was observed.Correlation and factor analysis were carried out by using SPSS(version 17.0) software. WATEQ 4F program was used to compute the saturation index, Log pCO2and ionic strength(Ball and Nordstrom 1992). Spatial distribution maps for elementalconcentrationandfactorscoreswerepreparedusing MapInfo Professional(GIS software V.8)and Vertical Mapper by interpolation using the Inverse Distanced Weighted(IDW)method(Lee et al.2006).
3 Results and discussion
Table 2presentsthemaximum,minimum,andaveragevalues of all the chemical parameters. The complete data set was given as supplementary material (Table 5, ‘Appendix 1’).The values were compared with the World Health Organization(WHO)standards.The pH of the sample ranged between 7.03 and 8.41(i.e.,neutral to alkaline)and it was found to be higherin Archaean Formation.The EC value ranged from326 to15,550μS/cm,andTDSfrom200to7810 mg/L,and higher values were observed in Cretaceous Formation.
3.1 Geochemical classification
The variation in concentration of ions is represented by box plots(Fig. 3).A rectangle in the plot represents the second and third quartiles, usually with a vertical line inside indicating the median value.The lower and upper quartiles are shown as horizontal lines on either sides of the rectangle. Na is the dominant cation; whereas, HCO3and Cl were the dominant anions, irrespective of lithologies.Higher concentration was observed in the central part,represented by Cretaceous formation, and the lower EC values along the northeastern part of the study area, represented by Tertiary Formation.
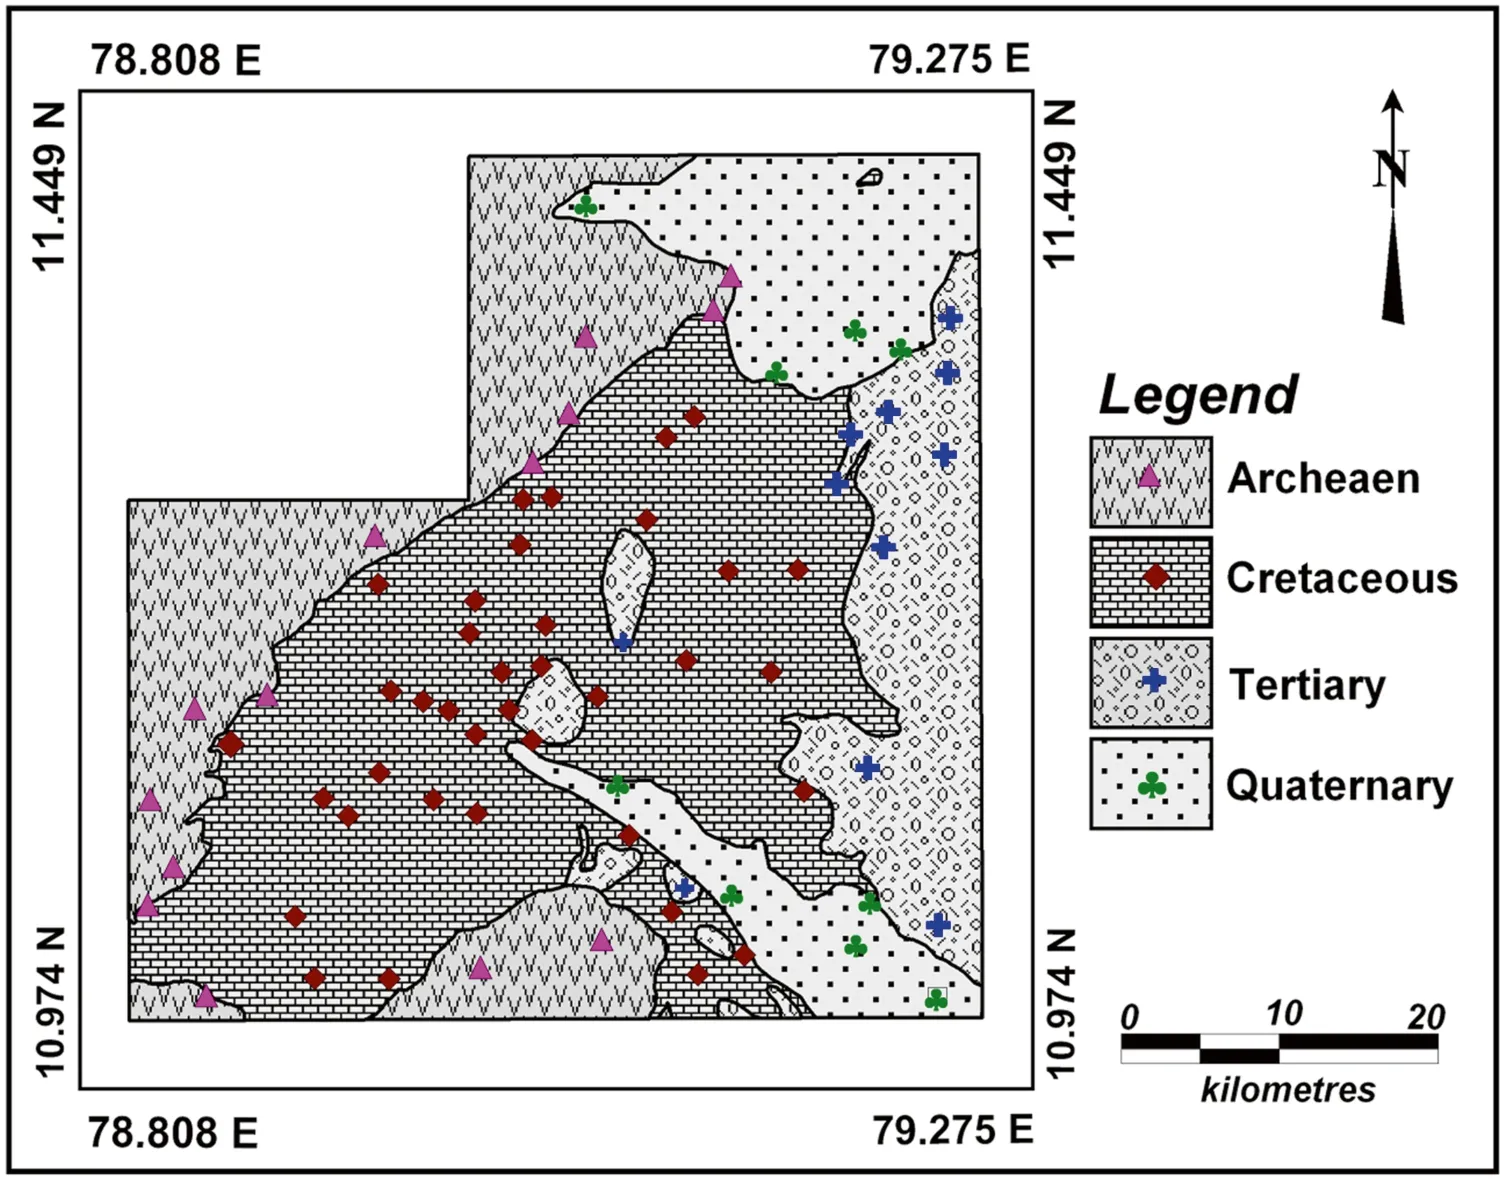
Fig. 2 Sample location in the study area

Table 2 The maximum,minimum,and average chemical constituents of groundwater(All the values are in mg/L except pH and EC in μS/cm)and comparison with WHO standards
Piper diagram (Piper 1944) describes the process responsible for the evolution of hydrogeochemical parameter in groundwater. Majority of samples were shown under Na-Cl and mixed Ca-Na-HCO3water types, irrespective of lithologies (Fig. 4). In Cretaceous Formation, majority of samples were of the Na+-Clwater type, indicating the leaching of secondary salts(Wagh et al. 2016). In Tertiary, Archaean, and Quaternary Formations, samples were of the Ca-Na-HCO3and Na-Cl water types, indicative of the dissolution of minerals, ion exchange, and anthropogenic activities(Barzegar et al. 2016). The Piper plot showed that there was an excess of alkali (Na+) over alkaline earth (Ca2+,Mg2+)and strong acid(Cl-)over weak acidIn Fig. 5, majority of the samples fell within the Na+-field along the central part of the study area, represented by the river and the contact zone between Archaean and Cretaceous formations.The Na+-HCO3-Cl-were seen represented in either sides of Na+-along the northeastern, eastern, and southwestern regions. Further, the Na+-Cl-type was observed along the southern part of the study area.

Fig. 4 Piper plot to identify the various hydrochemical facies in the groundwater samples

The aforementioned trend would explain that as groundwater infiltrates to deeper region or along the migratory pathway, it would acquire Na+, Ca+,and Cl-.However, water with limited circulation could result in intense water rock interaction which could leading to shifting of anion predominance, i.e.,to Cl-(Prasanna et al. 2006). The lower infiltration rate of meteoric water into the aquifer acted as a significant factor. The addition and removal of Ca2+during this process could be a result of ion exchange during the circulation of the groundwater through various geological formations.
Ionic ratios in the groundwater samples are illustrated in Table 3. Source rock plays an important role in determining the possible origin of groundwater chemistry (Avtar et al. 2013; Singh and Mukherjee 2015). Rainwater is a major source which affects groundwater composition initially, but weathering could further alter the water composition by adding major ions. The Mg2+/(Ca2++Mg2+)ratio indicated the fact that most of samples were seen to favor limestone and dolomite weathering, while lesser representation was noted in dolomite dissolution and calcite precipitation.ratio indicated that the calcium was mainly derived from carbonates or silicate than sulfates.anions implied that the values are indicative of low sulfate waters.

Fig. 5 Spatial distribution of water types in the study area
Nitrate versus EC plot showed that there was a proportionate increase of EC with the increase ofirrespective of the aquifer (Fig. 6). Landfill leachates, fertilizer used in agricultural lands, animal droppings are the major sources of nitrate (Naveen et al. 2018). In highly urbanized area, the septic tanks and bore wells are not properly maintained, thus, resulting in the infiltration of nitrate and ammonia into the aquifers. By the process of oxidization,ammonia changes to nitrate.The higher nitrate was noted in the Cretaceous Formation,which is the major litho-unit of the study area. It was observed to be chiefly controlled by the sewage discharge in addition to the fertilizers applied in the agricultural lands. Intensive use of fertilizers in the agricultural lands could contribute nitrate to the groundwater in the shallow aquifers.
Ionic strength(IS)is the total concentration of ions.The species of charge greater than one could contribute nonideality to solution (Domenico and Schwartz 1998).

Here, miis the concentration of a given ion in moles per liter, and Ziis the charge on that ion. The terms in the summation include one for each ionic species present.Ionic strength value of 0.04 was observed for few samples of Alluvium and Cretaceous aquifer; however, the rest of the samples showed an IS ranging from 0.01 to 0.04 (Fig. 7).Higher values of ionic strength were noted in Cretaceous aquifer samples, ranging from 0.01 to 0.015; although, in Tertiary, it showed to be still less than 0.01. The ionic strength of few samples was seen to be almost equivalent to freshwater(0.005),and mixing was reflected in Cretaceous Formation by a drop in pCO2values (Hem 1989).
The average value of atmospheric Log pCO2was seen to be - 3.5 (Wigley 1973). The pCO2values increased with depth, which could have been due to lesser atmospheric interaction or higher carbonate saturation which could have resulted from interacting with host rock during its flow(Chidambaram et al. 2011). Higher freshwater recharge lowers the ionic strength in Cretaceous Formation (Prasanna et al. 2006). The pCO2decreases in mixed water due to its higher interaction with atmosphere,as mixing zone is an open system (Raymahashay,1986); but, this reduction of pCO2 results in the increase of the saturation states of minerals.
The highest ratio of Ca/Mg was noted in Cretaceous Formation and lesser values in Tertiary Formation. The molar ratio when compared to themolar value showed that there was an increase in these values up to 8 mmol of HCO3(Fig. 8). This may have been due to the dissolution of carbonate minerals such as Calcite and Dolomite in the Cretaceous Formation.On further increase ofconcentration, there was a decrease in the Ca/Mg molar ratio. This could have been because of the increase in pCO2values or could have been due to saturation and precipitation of Calcite. This process was evidently witnessed in Log pCO2vs HCO3plot (Fig. 9).

Table 3 Ionic ratios for the groundwater composition

Fig. 6 Relationship between NO3 and EC to depict the anthropogenic influence of nitrate in groundwater
The saturation state of carbonate and sulfate minerals showed the order as follows: Calcite >Aragonite > Magnesite > Dolomite > Gypsum > Anhydrite.The relationship ofto that of saturation index of these minerals showed an increase up to 400 mg/L, and that calcite and aragonite reached a near saturation at this concentration (Fig. 10).It was also detected that there was a moderate decrease in state of saturation beyond this concentration. Figure 10 also reflects the fact that there is an increase of SI of dolomite to 500 mg/L and as light decrease in the state of saturation of minerals beyond the particular concentration. This may be due to the nonavailability of Ca2+, which forms the integral component of all these minerals.The nonavailability may be due to the removal by ion exchange process or by control in dissolution by pCO2. The decreasing trend of Ca2+/Mg2+ratio in water showed the dissolution of calcite and dolomite,further reflecting the residence time of water in the aquifer(Lopez-Chicano et al. 2001; Musgrove and Banner 2004;McIntonsh and Walter 2006; Rina et al. 2013a, b; Singh et al. 2014). This dissolution of calcite and dolomite also depends upon temperature. In this process, gypsum (or anhydrite) and dolomite get dissolved; however, precipitation of calcite occurs. The Ca2+derived from gypsum,could cause oversaturation of the solution. Thus, rapid precipitation of calcite would decrease the alkalinity and increase H+ion, pCO2,thereby, resulting in sub-saturation of dolomite. Accordingly, it can be concluded thatdedolomitization is a phenomenon of an increase of SO4,Ca2+, Mg2+, and pCO2,decreasing alkalinity and pH.

Fig. 7 LogpCO2 versus ionic strength (to determine the residence time of groundwater in the aquifers)

Fig. 8 Relationship between HCO3 and Ca/Mg to determine the dissolution of carbonates in the groundwater
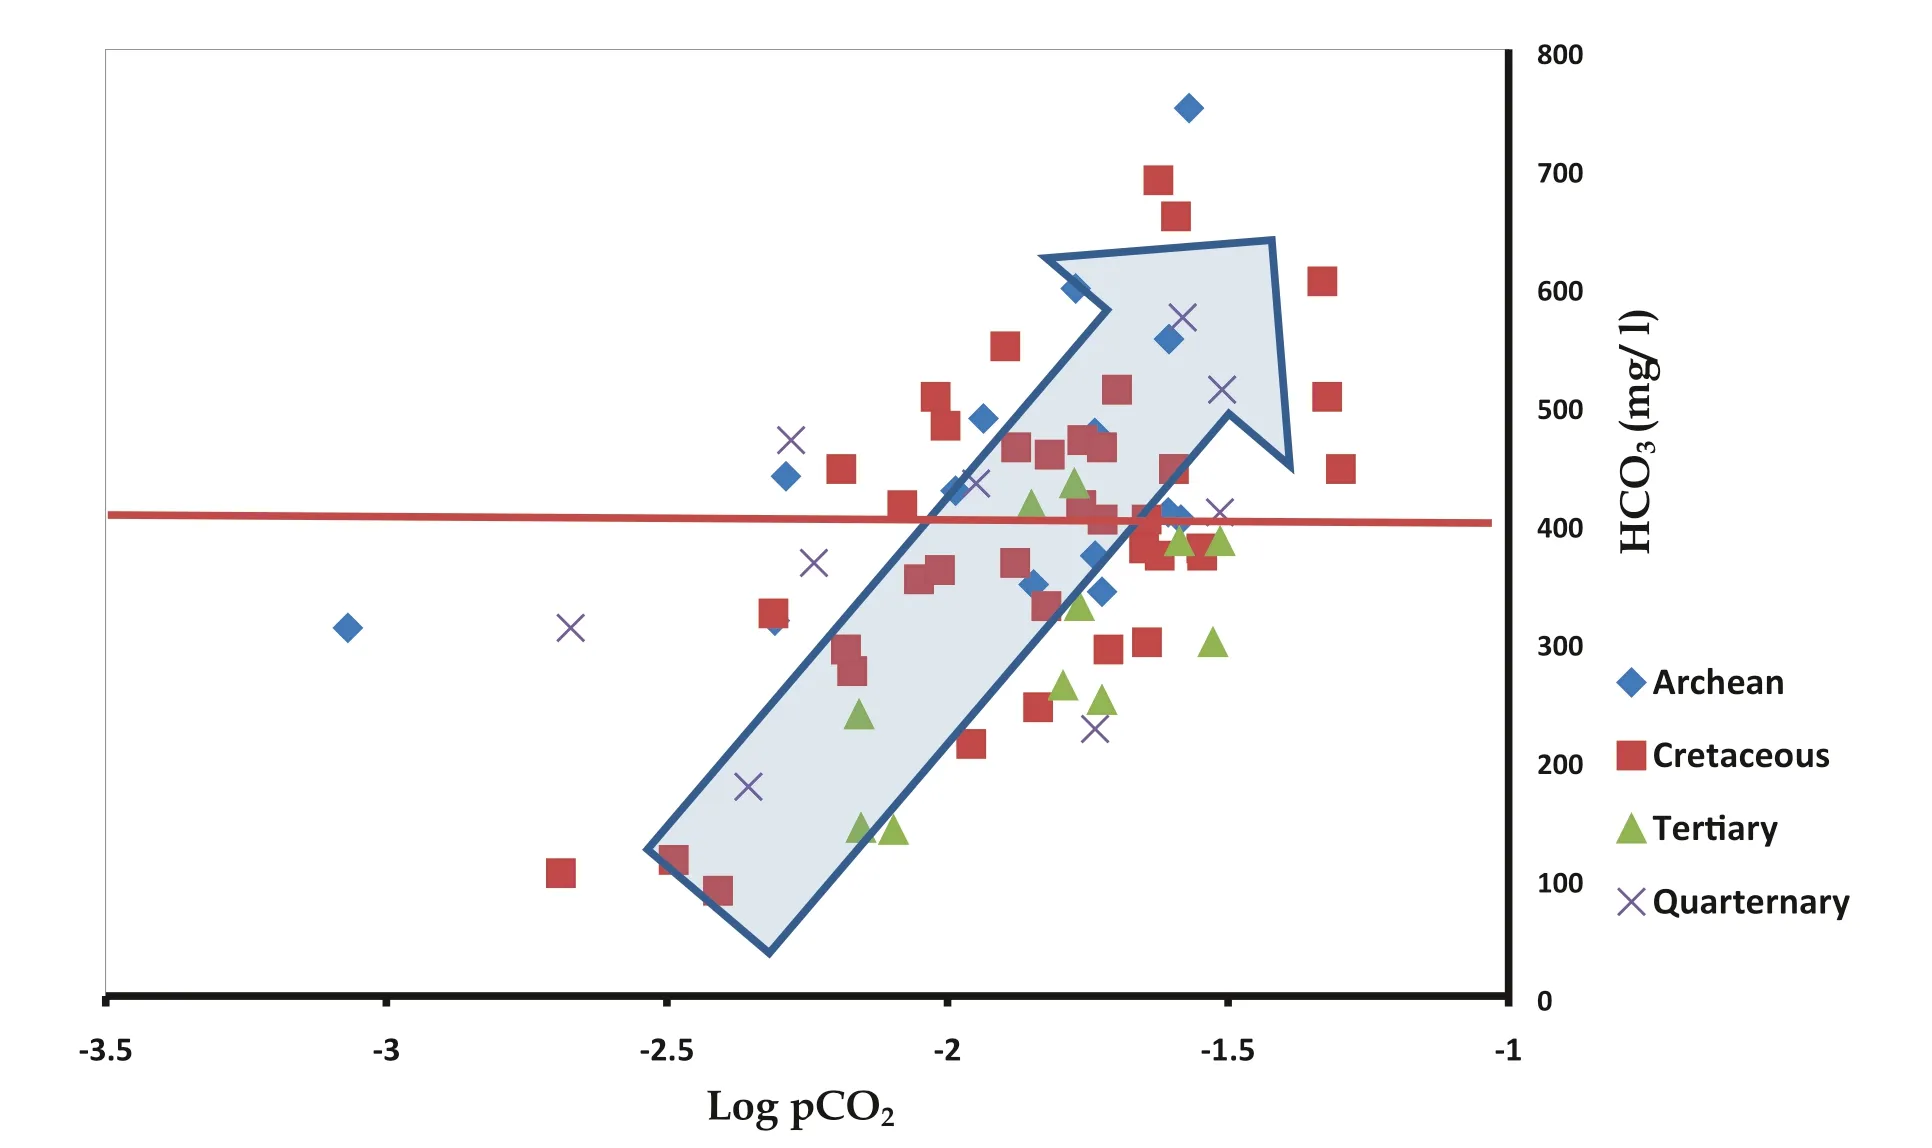
Fig. 9 Relationship between HCO3 and Log pCO2 (to determine the influence of pCO2 and HCO3 for the saturation of calcite)

Fig. 10 Saturation index of carbonate and sulphate minerals with respect to HCO3 concentration
Figure 11 shows the relationships betweenand Ca2+.In the study area,groundwater samples were seen to be highly enriched inrelative to Ca2+. If all calcium were derived from calcite and dolomite dissolution,samples would plot along the equiline. Many points fall above the equiline, signifying an additional source of calcium. Other sources of Ca2+in groundwater can be an enrichment of Ca2+by cation exchange and chemical weathering of carbonates (Patnaik et al. 2013). Cation exchange processes result in a deficiency of marine cations and an excess of the freshwater cation, Ca2+. It tends to develop Ca2+-Cl-water type in this region, which is typical for salinization (Walraevens and Van Camp 2005).Chloro-alkaline indices (CAI1 and CAI2) were used to determine the cation ion exchange during water rock interaction (Scholler 1965). The following expressions are used for the indices.
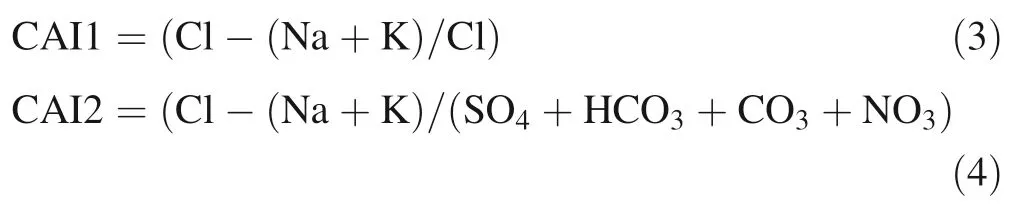
Ions used in the indices are in epm. If there were to be an exchange of Ca or Mg in water with Na and K in the rock during the reaction, then the indices would be negative. If there were a reverse ion exchange,then the indices would be positive.In the study area,most of the groundwater samples showed positive indices,indicative of the release of Ca2+into the water by the substitution of Na+ion in the solid surface.
3.2 Factor analysis
3.2.1 Archaean
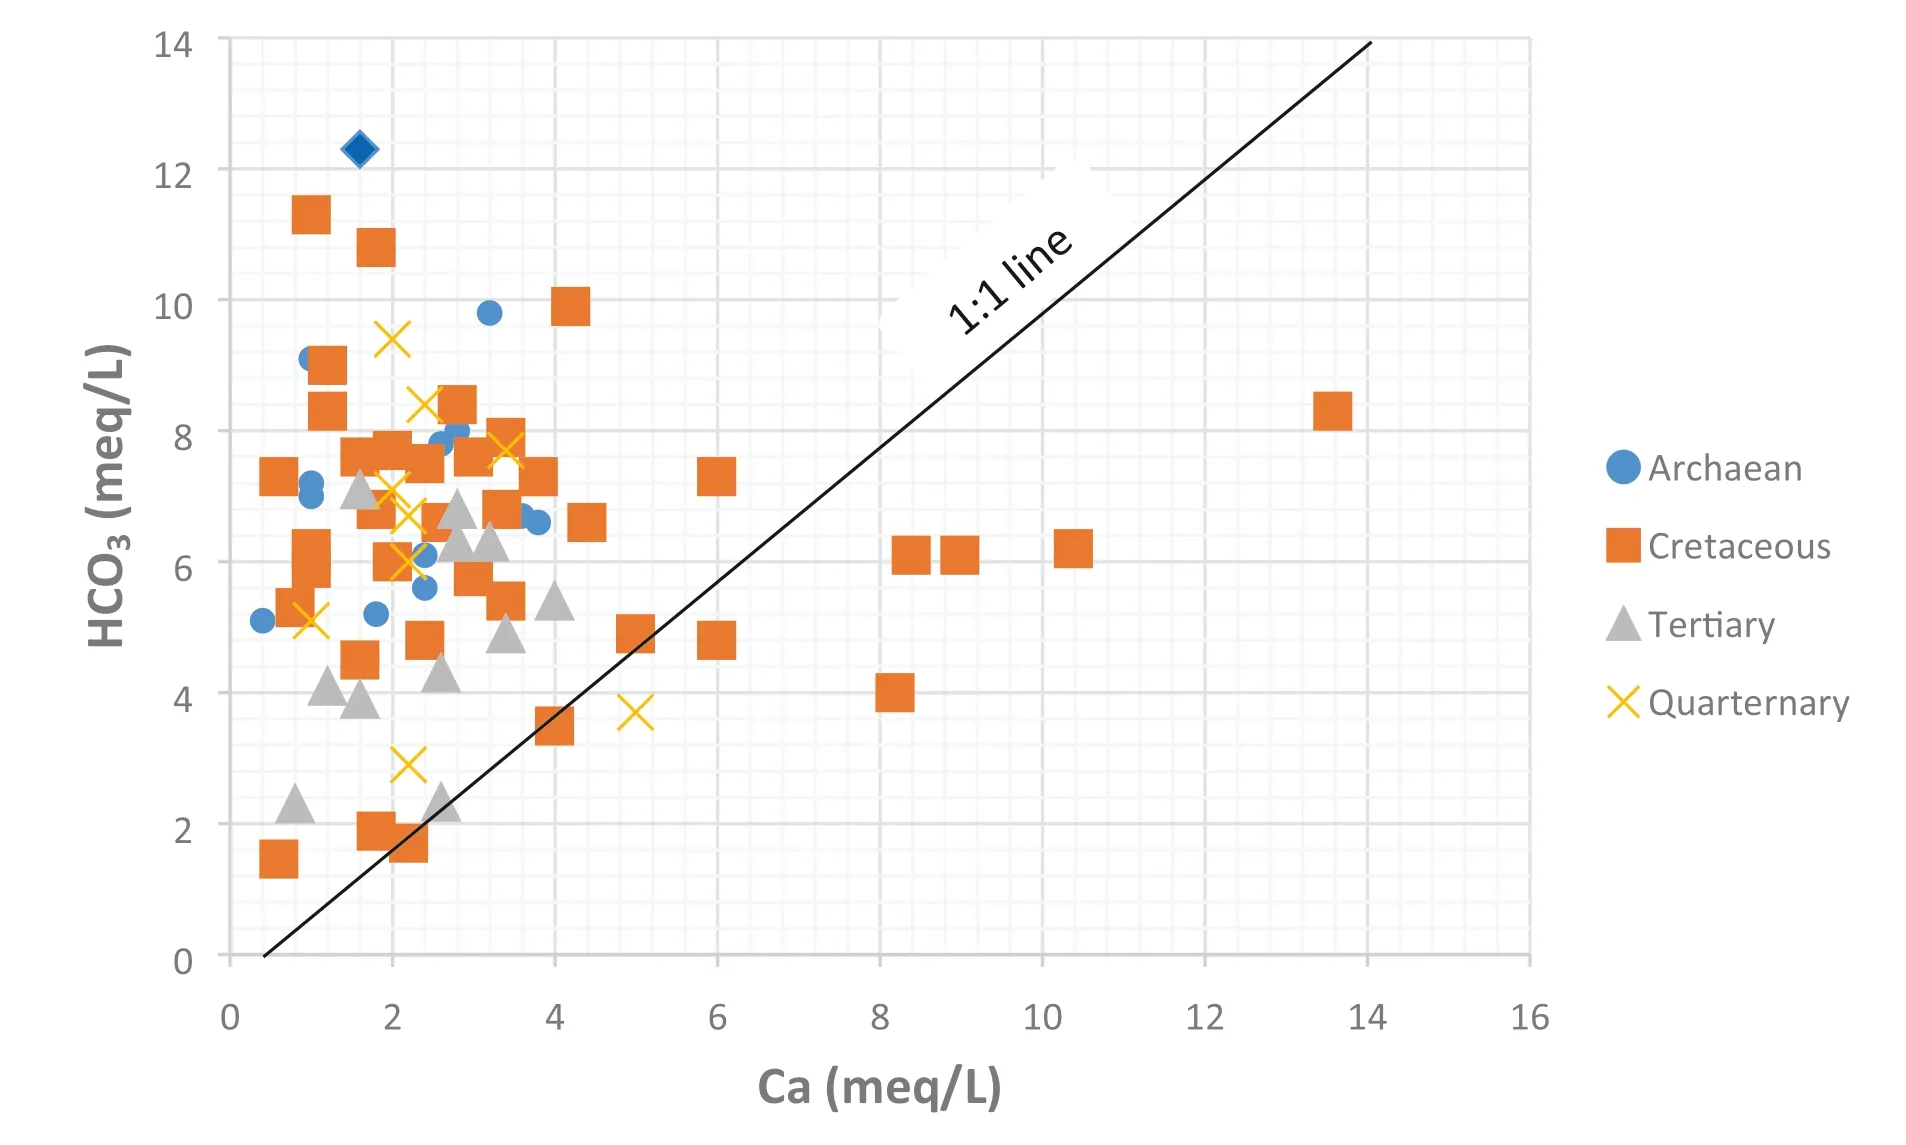
Fig. 11 Relationship between Ca and HCO3 (to identify the possible sources of Ca in the groundwater)
The factors with Eigen values larger than 1.0 were selected and rotated iteratively by the varimax method (Davis 1986).Four independent factors were extracted,accounting for 86.38 % of the total variance of the original data set(Table 4).
Factor 1 accounted for 39.35 % of the total variance with positive loadings on Na+,Mg+,Cl-,and EC.The positive association of Na+and Cl-can be ascribed to the infiltration of secondary salts through chlorination,which was noted in the field during sampling. The higher positive loading of Ca2+, Mg2+, andwould state that water has recharged naturally, and water rock interaction process has dominated. Infiltration of atmospheric inputs attacked the aluminosilicates, feldspar, and micas,thereby liberating cations such as Ca and Mg into the water and leaving clay minerals as residue.As a result,there has been an increase in pH and(Freeze and Cherry 1979). The association of these aforesaid processes indicated the leaching of secondary salts from geogenic source(Chidambaram et al. 2008).
Factor 2 accounted for 16.60 % of total variance, with strong positive loadings onInorganic carbon could get accumulated in groundwater either due to bacterial activities (oxidation) or dissolution of carbonate minerals. Thus, mineralization, dissolution, and bacterial activities are the key factors of nitrogen in groundwater.However, decomposition of organic matter could lead to mineralization of organic nitrogen (Speiran 1996) according to Eq. 5.Hydrolysis of ammonia in water yields ammonium hydroxide, most of which is ionized to ammonium and hydroxyl (OH-) ions. In addition, infiltration of pit-latrine effluents has introduced large amounts of ammonium into the unsaturated zone (Graham and Polizzotto 2013).


321049217124 F30.11 0.75 0.39 0.34 0.54 0.09 0.85 0.13 0.05 0.21 0.44 0.58- 0 0.88.33 0.85 0.34 0.32- 0.26 0.27 0.02.11.66 F2- 00.50- 00.33 Qu aternary.04 F10.03 0.53 0.70 0.07 0.75- 0.08- 00.94 0.97 0.47 0.17 0.73.08.24.22 F4- 0- 00.23 0.15- 0.23 0.26 0.00 0.16 0.38- 00.92- 0.11.04.03.80.02.06 F3- 00.01- 00.36 0.29- 0- 00.88 0.64- 00.08 0.15.22.03.19.06.05 F2- 00.24 0.32 0.68- 0- 00.80- 00.16 0.83- 00.22 Tertiary 8 F10.86 0.71 0.90 0.34 0.91 0.44 0.50 0.23 0.59- 0.45- 0.20.96 0.255- 0.036 F4- 0.00.96 0.00- 0.07 0.30 0.06 0.10 0.17- 0.10.07 F3- 0.13 0.08 0.221- 0.00.06 0.80 0.60- 0.30 0.17- 0.48 0.11 0.17 0.29 0.36 0.02 0.07 0.14 0.23 0.027 0.04 0.324 0.14 Cretaceous F2- 0.7- 0.7 0 0.77 0.82 0.92 0.06 0.97221 F1- 0.00.51- 0.10.88- 0.5- 0.50.94 ples 0.82 0.26 0.01 0.13 0.11 0.180 0.08 0.1952 0.16 ater sam F4- 0.2- 0.1- 0.9- 0.04 F3 undw 0.25- 0.14 0.91- 0.024- 0.00.12 0.90 0.29- 0.13 actor analysis for the gro- 0.02- 0.08 6 2 F2- 0.10.18 0.26- 0.13 0.04 0.94 0.85 0.21- 0.10.35- 0.11 0.20 Arch aean.15.14.59.17 F10.30 0.73 0.91- 00.98 0.02 0.26- 00.94- 0- 00.96 b le 4FTa Ca Mg Na KCl HC O3 NO3 PO4 SO4 H4SIO4 pHEC
Factor 3 was represented by 15.52 %of the total variance with strong positive loadings on K+andPhosphorous in groundwater was observed of lesser quantity because of its low solubility and high phosphate retaining capacity of soils.Although phosphate is influenced by biological cycles,strong bond exists between phosphate, clay minerals, and metal hydroxide.The higher amount of phosphate was found in the weathered layers of hard rock aquifers compared to sandy formation, thereby pointing out that the origin of phosphate could be mainly either from Archaean formation or the intermittent clay in the aquifer(Rao and Prasad 1997).Thus, the phosphate may have evolved from clay minerals,and this is also supported by the release of K+from clay by ion exchange processes (Thilagavathi et al. 2017).
Factor 4 accounted for 14.89 % of the total variance with strong positive loading on Ca2+, and negative loadings of pH again would demonstrate the ion exchange processes.This has led to exchange of calcium adsorbed on clay particles, enriching groundwater with calcium.Markedly, intensity of cation exchange could vary according to the lithology of the region.
3.2.2 Cretaceous
Four independent factors were extracted,which could explain 80.65 %of the total variance of the original data set(Table 4).Factor 1 accounted for 45.78 % of the total variance with positive loadings onand EC.The positive representation ofwith Cl-would suggest the anthropogenic origin (Demlie 2007). Main potential sources of NO3are numerous shallow pit toilets and oxidation of organic matter in the study area.Factor 2 has a negative representation ofand pH.The low content ofand the absence ofin groundwater would suggest their sorption on organic colloids (in the under-saturated source of zone)or the locationof rice fields rather in low-lying swampy areas. Factor 3 accounted for 12.26 % of the total variance,with strong positive loadings onand NO3.This is similar to that of factor 2 in the Archaean formation.Factor 4 was represented by 9.66 % of total variance, with strong positive loadings on K+and negative representation of pH,indicating the ion exchange process.
3.2.3 Tertiary

Fig. 12 Spatial distribution for the factor scores in various lithological units
In Tertiary formation, four factors were extracted with 87.63 % of total data variability (Table 4). Factor 1 accounted for 41.82 % of total variance represented by Cl-, Na+, Ca2+, Mg2+,and EC. This was seen to have been represented along the Tertiary formation where the major lineament was observed. Factor 2 was loaded with 17.60 % of total variance, implying the anthropogenic processes observed by H4SiO4,NO3,and K+due to the presence of NO3in soil water (<5 cm deep)from rice farms (Fonge et al. 2012). This is mainly due to the agricultural practices along the region. Opaline silica derived from rice plants may be said to provide a readily soluble source of silica and frequent oxidation reduction cycles of paddy soil, thereby activating the weathering of smectite, thus, making silica more soluble. Further, Factor 3 accounted for 17.15 % of total variance, with strong positive loadings onandwhich could be mainly due to the dissolution/weathering of the Karai Formation. This Formation consists of variegated shales,veins of gypsum, phosphatic nodules, and abundant belemnite casts. Phosphatic nodules, locally known as‘Uttatur potatoes’ are normally encased in a chalky shell.The dissolution/weathering of these rocks could reach the adjacent aquifer. Factor 4 accounted for 11.05 % of total variance,with strong positive loadings on pH and negative loadings of Mg2+, indicative of ion exchange process.

Fig. 12 continued

Fig. 12 continued
3.2.4 Quaternary

Fig. 12 continued
Three independent factors were extracted,which explained 76.78 % of the total variance (Table 4). Factor 1 was loaded with 33.03 %of total variance,with strong positive loadings onCl-,Na+,Mg2+,and EC,which would indicate the leaching of secondary salts which could have either precipitated in the pore spaces during the previous season or could have been due to infiltration of salts from the surface soils. Factor 2 was represented by 23.08 % of total data variability (TDV). Ca2+, K+, and H4SiO4signified the weathering of mica minerals in the aquifer matrix. Factor 3 accounted for 20.66 % of total variance, with strong positive loadings on NO3and Mg2+reflecting the leaching of the anthropogenic salts from the surface or due to the mixing of groundwater from the adjacent aquifer along its flow path. Factor 4 was represented by Na+,and H4SiO4,thus reflecting the weathering of Albite feldspar.
3.3 Factor score
The factor score representations of the samples were spatially plotted, clearly showing that the score of the first factor for all the formations represented the leaching of the secondary salts (Fig. 12). They were spatially represented along the contact of the formations in Archaean and Cretaceous formations, and along the contact between the Cretaceous and Tertiary in the Tertiary formation, along the river course in the Quaternary formation. The association of nitrate in the factor loadings denoted the leaching facilitated by the domestic sewage. The last factor, irrespective of the formation,would imply the geogenic source either by ion exchange or weathering process. Further, the third factor of Tertiary and the second factor of Quaternary also would represent geogenic source. Ca2+-Mg2+-Na+-water facies were observed in this region,and most of the samples have near-zero factor scores, suggesting that they are moderately represented by these factors(Olobaniyi and Owoyemi 2006).The factor loadings of Archaean(factor 2 and factor 3),third factor of Cretaceous,second factor of Tertiary, and third factor of Quaternary also indicated anthropogenic sources. In general, the anthropogenic sources are mainly due to agricultural impact along with hydrolysis of ammonia from pit latrines.The geogenic sources are mainly leaching of secondary salts, ion exchange process, and weathering of minerals.The entire geochemical process of the region can be summarized as five major processes (Fig. 13). Process 1 pointed to the leaching of secondary salts; Process 2 indicated the leaching of salts governed by domestic sewage;Process 3 revealed the anthropogenic impact, mainly hydrolysis of the ammonia produced from pit latrines;Process 4 was governed by the weathering and ion exchange of the geogenic materials, and Process 5 indicated the mixing of the water travelled from the adjacent formation along its flow path.
4 Conclusions

Fig. 13 Conceptual diagram to explain the five major hydrogeochemical processes occurred in the groundwater system
The dominance of cation and anion trend was seen to vary with lithology due the difference in residence time, variation in lithological composition, and the complex geochemical processes. The higher EC was noted in the Cretaceous formation. Most of the samples showed Na+-water type near the river and along the contact between Archaean and Cretaceous formations.The Mg2+/(Ca2++Mg2+) ratio indicated that most of the samples favoring carbonate weathering, with lesser indication of dolomite dissolution and calcite precipitation.ratio also revealed that the calcium was derived from carbonates and silicates apart from gypsum. The ionic strength of few samples was seen to be almost equivalent to freshwater, and mixing was reflected in Cretaceous Formation accompanied by a drop in pCO2values. The decrease ofcould be either due to the increase in pCO2values or could be due to saturation and precipitation of Calcite; whereas, the excess release ofcould be because of the weathering of minerals.Carbonate minerals were observed to be under saturation to near saturation state; whereas, the sulfate minerals fell under saturation state. The statistical analysis revealed the geochemical process of leaching of secondary salts,leaching of salts governed by domestic sewage, anthropogenic impact, mainly hydrolysis of the ammonia produced from pit latrines, weathering, and ion exchange of the geogenic materials, and by mixing of the water that traveled from adjacent formation along its flow path. The lithological relationship to geochemistry showed that impact of the recharge processes was reflected in Tertiary and Archaean aquifers. Other aquifers showed anthropogenic process and an interplay of these processes resulting in the major geochemical changes in the groundwater of the study area.
Compliance with ethical standards
Conflict of interestOn behalf of all authors, the corresponding author hereby declares that there is no conflict of interest relative to the article.
Appendix
See Table 5.
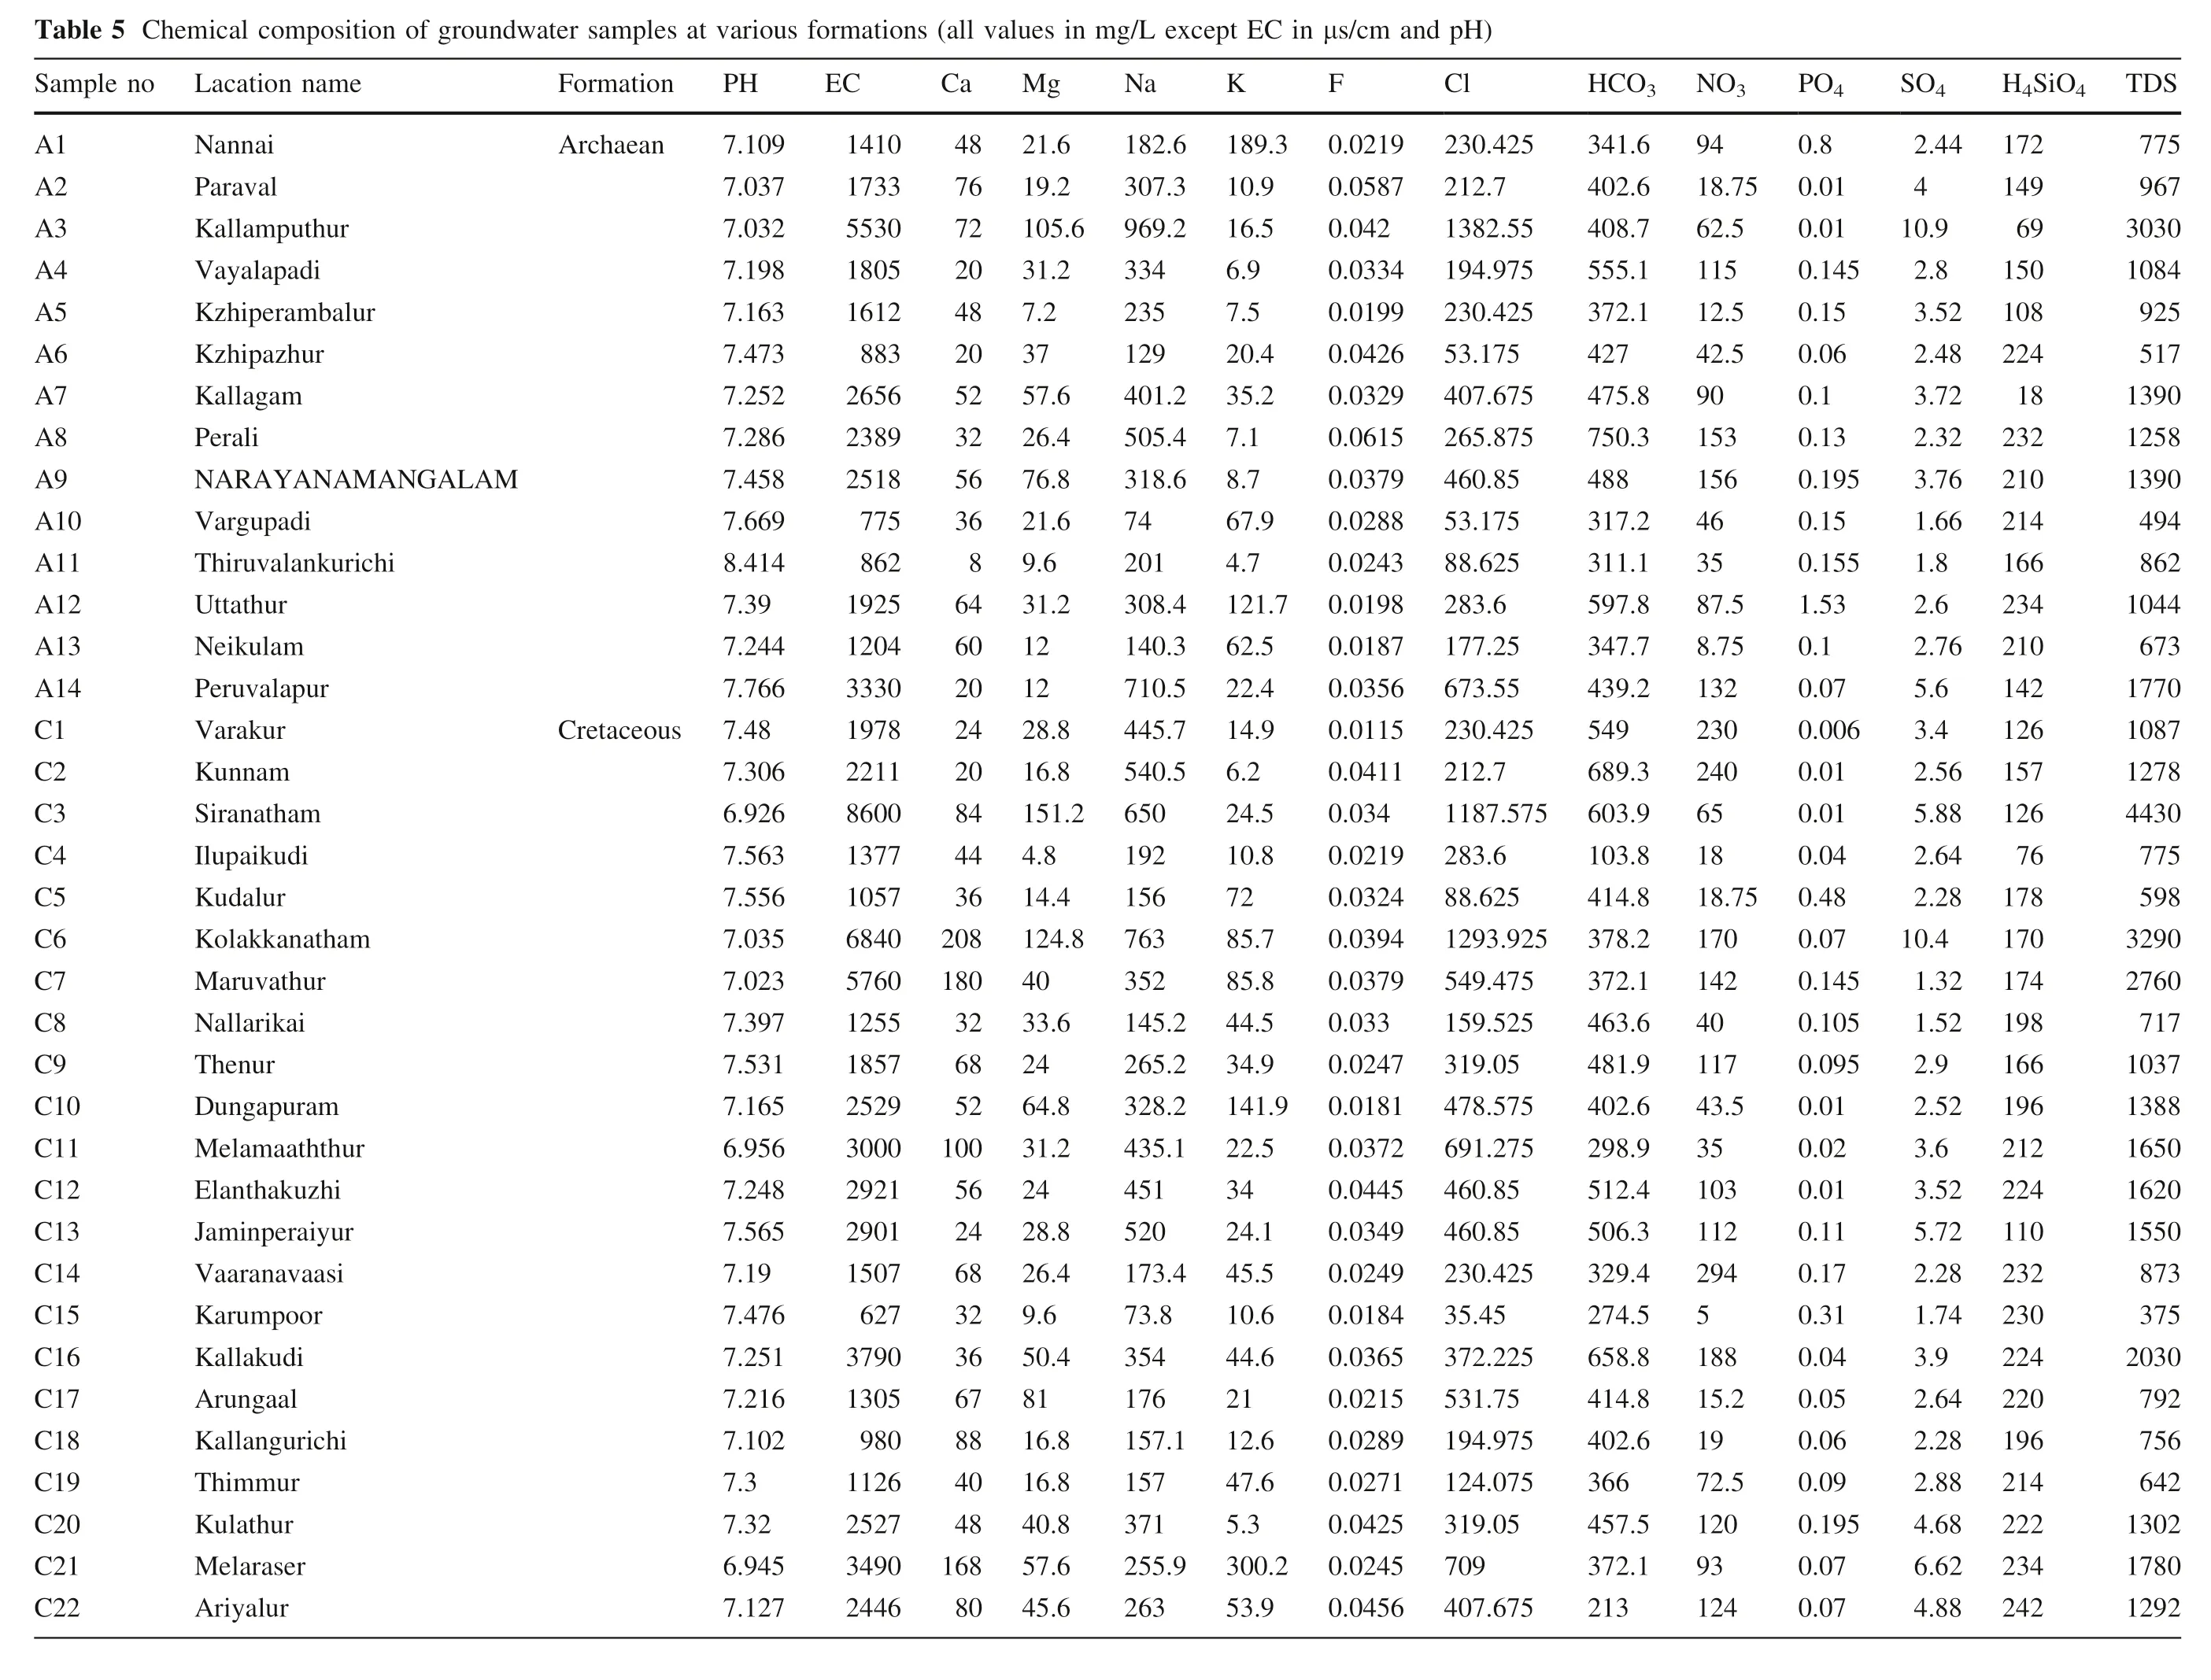
5757423 H4SiO4 T DS 77963030 108492511390 1258 139049861044671770 1087 127858735262 4430 1721496915010822418232210214166234210142126157 77593290 2760711037 1388 1650 1620 1550873720307975641302 1780 1292 12676 SO42.44 410.92.83.52 2.48 3.72 2.32 3.76 1.66 1.82.62.76 5.63.42.56 178170174198166196212224110232230224220196214222234242 5.88 PO4 0.81 0.01 0.145 0.15 0.06 0.10.13 0.195 0.15 0.155 1.53 0.10.07 0.006 0.01 2.64 2.28 10.41.32 1.52 2.92.52 3.63.52 5.72 2.28 1.74 3.92.64 2.28 2.88 4.68 6.62 4.88 0.01 O35 0.0 O3 N 9418.7 62.5 11512.5 42.5 90153156463587.5 8.75 132230240 0.048 5 0.40.07 0.145 0.105 0.095 0.01 0.02 0.01 0.11 0.17 0.31 0.04 0.05 0.06 0.09 0.195 0.07 0.07 65 HC 34404055374247754831315934435468 1.62.68.75.12.175.80.387.21.17.87.79.299.3 and pH)757525 Cl 30.425 212.7 1382.55 194.975 230.425 53.1 407.675 265.875 460.85 53.1 88.683.6 177.25 673.55 230.425 212.7 1818.7 1701424011743.5 35103112294518815.2 1972.5 12093124 1041 3.84.8 374648402951503227654140 2.13.61.92.68.92.46.39.44.58.84.82.6 36453721 67.52.13 255 1187.575 603.9 C in μs/cm 219 2 198 2 F 0.0587 0.042 0.0334 0.0199 0.0426 0.0329 0.0615 0.0379 0.0288 0.0243 0.0187 0.0356 0.0115 0.0411 283.6 88.6 1293.925 378.2 549.475 159.525 319.05 78.575181 4 691.275 460.85 460.85 230.425 35.4 372.225 531.75 194.975 124.075 319.05 09245 7 407.675 0.034 t E .3 0.0.7 0.0 g/L excep K 16.5 6.97.520.4 67.9 4.7 0.0219 0.0324 0.0394 0.0379 0.033 0.0247.9 0.00.0372 0.0445 0.0349 0.0249 0.0184 0.0365 0.0215 0.0289 0.0271 0.0425.2 0.00.0456 24.5 Na 1830 2.6 189 7.3 10.9 33231240503174203014714454 4591.2 35.2 5.4 7.1 8.6 8.7 18.4 121 0.3 62.5 0.5 22.4 5.7 14.9 0.5 6.2 us formations (all values in m Mg 21.6.6 969.2 28.8 10.8 7285.7 85.8 3424.1 10.6 44.6 2147.6 5.353.9 1915 26351426324345521773351715 25.2 44.5 5.2 34.9 8.2 141 5.1 22.5 103.4 45.5.8467.1 12.6 15372526 715.9 300 3.2 650 Ca 4876 19.2 72 105 20 31.2 48 7.2 20 37 52 57.6 32 26.4 56 76.8 36 21.6 8 9.6 64 31.2 60 12 20 12 2420 16.8.8 763 84 151 3 52 EC 1410 1733 5530 1805 1612882656 2389 251877861925 1204 3330 1978 2211 44 4.8 36 14.4 32 33.6 68 24 52 64.8 56 24 24 28.8 68 26.4 32 9.6 36 50.4 67 81 88 16.8 40 16.8 48 40.8 80 45.6 70 8600 ples at v ario PH 7.109 7.037 7.032 7.198 7.163 7.473 7.252 7.286 7.458 7.669 8.414 7.39 7.244 7.766 7.48 7.306 1377 1057 6840 208 124 5760 180 40 1255 1857 2529 3000 100 31.2 2921 2901 1507623790 1305981126 2527 3490 168 57.6 2446 6.926 ater sam Form ation Archaean Cretaceous dw AL AM sition o f groun NG i e MA po am NA rich hemical com acation n thur ur Nannai Paravalpu Kallam Vayalapadi Kzhiperambalur Kzhipazh Kallagam P erali Y ARA up adi ur Varg Thiruvalanku U ttath ulamNeik valapurPeru Varakur Kunnam 7.563 7.556 7.035 7.023 7.397 7.531 7.165 6.956 7.248 7.565 7.19 7.476 7.251 7.216 7.102 7.37.32 6.945 7.127 r r aasi i uram akuzhi oormp i rich ur mur alur Siranatham NA Ta ble 5 C Sample no L A1A2A3A4A5A6A7A8A9A10 A11 A12 A13 A14 C1C2 Ilupaikudi Kudalur Kolakkanatham Maruvathur Nallarikai Then Dungap Melamaaththu Elanth Jaminperaiyu Vaaranav Karu Kallakud Arungaal Kallangu Thim Kulathur Melaraser Ariy C3C4C5C6C7C8C9C1 0 C1 1 C1 2 C1 3 C1 4 C1 5 C1 6 C1 7 C1 8 C1 9 C2 0 C2 1 C2 2

421670 H4SiO4 T DS 562080 4030821045 7810 2760 2950 3080 4970551730698115909940177046571 4831 1901287014417612012014496166220158198222224208 SO42.12 6.76 7.76 3.24.22 18.44.76 4.24 9.72 4.21.91.61.61.84 3.41.24 PO4 0.23 0.1551 0.13 0.22 0.01 0.005 0.344 0.045 0.15 0.10.01 0.045 0.15 0.09 0.01 O3O3 N 33270217.5 0.1 3838.5 300300152380249381563144828.75 HC 4435 5.32.1 2932 2.83.3 4646 9.73.6 107327471070201033738754641540738516605176154076 192224210158882302402101942151482001822042108411418658 1.22 1.92 1.74 2.22.44 1.72 2.92 1.64 1.96 1.24 1.52 2.32 21.96 5.84 1.88 2.38 2.92 1.92 0.01 0.01 0.01 0.04 0.11 0.11 0.11 0.04 0.035 0.01 0.01 0.10.027 5 0.08 5 0.215 5 0.10.0054 0.01 351986.25 2827.5 21.5 1687717.5 62.5 68052.5 56.2 18.7 13.7 26.5 116.8 0.0 21 298944373511262538234132141443 2.85.38.29.952.3 Cl 70.9.375 20237 6 1861.125 244 212.7 319.05 4165.375 506.3 567.2 797.625 1329.375 445.3 1807.95 70.9 638.1 141.8 265.875 655.825 141.8 F 0.0525 0.0326 0.0326 0.0548 0.0397 0.0562 0.0525 0.0372 0.0289 0.0341 0.0201 0.0234 0.0359 0.0293 0.025 K 4.8297.7 0.0 35.5 10.2 11.4 13.4 9813.6 1216.39.452.3 27.5 Na 1651 431838 214456 60 0.14.37.94.89.40.323.1 2938512243403631465717 8.94.32.45.73.18.761.19.73.46.9 535.4 319.0575 53.175 53.1 460.8575 53.1 301.325 141.8 301.325 124.075 141.8 567.2 159.525 319.05 638.1 141.8 212.7 496.3 336.775 0.0214 0.0243 0.0336 0.0364 0.0215 0.0214 0.0277 0.0268 0.0233 0.025 0.0322 0.022 0.0288 0.0221 0.0251 0.0194 0.0206 0.0274 0.0184 6.41215.1 14.2 1.374.4 24.3 3525.911.4 3 93135447222944607026751622532219 9.5 6.5 251.7 22.2 1.8 23.6 82.7 Mg .6 982.6 2471 16.8 Ca 12 21.6 60 21.6 48 26.4 16 9.6 40 72 60 55.2 12 16.8 76 57.6 20 24 20 33.6 36 48 52 0 0 272 141 1 4 EC 923990 8350 164 153 1492 1874 5300 5690 6350 120 74.4 9840 120 48 973290 1211 1474 339080 PH 7.697 7.432 7.028 7.57.67 6.812 15,55 7.263 7.221 7.06 6.991 7.23 6.78 6.982 7.419 7.385 7.075 Form ation Tertiary eam ur r ble 5 continued acation n Kaarai Saththan Anaipadi Azudalaiper Varakuppai thu rAnth Mungilpadi Adhanu Kzhakudikadu Aiyanavaram araik ulamTham Rayapuram Redaliyarpalayam Kadagur athanallu rPoiy Ullarth Ta Sample no L C2 3 C2 4 C2 5 C2 6 C2 7 C2 8 C2 9 C3 0 C3 1 C3 2 C3 3 C3 4 C3 5 C3 6 C3 7 T1 7.5 20.2.57066.1 22.2 1413241720214717244518 2.8 17 09.8 16.4 024.1 18.4 082.6 9.4 2.6 57.7 6.7 15.7 24 12 64 38.4 32 16.8 56 4.8 80 33.6 16 14.4 52 28.8 32 43.2 68 38.4 56 1219.2 4840 14.4 44 33.6 44 52.8 20 9.6 68 7.2 40 62.4 44 33.6 055 19668 4577 3 20126 321909 1261 15771 961237 2935 100 60 1241 1523 31908 891357 2980 1377 6.993 6.943 7.47.328 7.127 7.116 7.155 7.261 6.852 7.0373 Quaternary 7.06.926 7.441 6.975 7.635 8.023 7.87.174 7.453 r u ulam ikad i rich Ponkud Elaigadampoo Poyyur angalam anur ur Vikram Velakudi ur iUjan Mangalam huraiSend araip oo ndiTham Periyaku Oganur Kuruzh Iyankath Maravakurichi uthth aykThav pamVaip Suntakkuzhi b alav arkattalaiAm Kadamb T2T3T4T5T6T7T8T9T1 0 T1 1 R1R2R3R4R5R6R7R8R9
杂志排行

Acta Geochimica的其它文章
- Late Ordovician mass extinction caused by global warming or cooling?
- In-situ LA-ICP-MS trace element and oxygen isotope signatures of magnetite from the Yamansu deposit, NW China, and their significance
- Geochemical constraints on the origin of Early Cretaceous alkaline intrusions and its tectonic implication, Sulu Orogenic Belt, Eastern North China Craton
- Hydrogeochemical characteristics of groundwater and quality assessment for the purposes of drinking and irrigation in Bougaa area, Northeastern Algeria
- Organic geochemical characteristics of Eocene crude oils from Zhanhua Depression, Bohai Bay Basin, China
- Geochronology and geochemistry of magmatic rocks in the Dongzi-Changhanboluo Pb-Zn ore district in Chifeng,Inner Mongolia, and their relationship with metallogenesis