Hydrogeochemical characteristics of groundwater and quality assessment for the purposes of drinking and irrigation in Bougaa area, Northeastern Algeria
2020-11-10RiadKouadraAbdeslamDemdoum
Riad Kouadra · Abdeslam Demdoum
Abstract In the northern part of Algeria, the intensive exploitation of groundwater resources and pollution has considerably affected the aquifer water quality, especially in rural areas where groundwater is the main source of water supply for most uses. This study was performed to evaluate the groundwater quality and its suitability for drinking and irrigation purposes through the hydrogeochemical study on the groundwater in Bougâa region(Northeastern Algeria). Fourteen groundwater samples were collected and analyzed for pH, T, EC, TDS, and major ions.Most samples are suitable for drinking based on the permissible limits of the Bureau of Indian standards(Indian standard specification for drinking water(IS 10500:2012), but only 35 % of the samples are good enough for drinking purposes based on the water quality index of the groundwater. Assessment of groundwater samples from various parameters and methods such as ‘Electrical conductivity, Sodium adsorption ratio, Soluble sodium percentage, Magnesium adsorption ratio, Residual sodium carbonate, Permeability index, Kelly’s ratio, Wilcox’s diagram,and US salinity laboratory classification’showed that groundwater in the area is chemically suitable for irrigation uses.The Piper trilinear diagram suggests that the groundwater mainly belongs to the hydrochemical facies Ca-Mg-Cl and Na-Cl. The combination of ionic ratios,Gibbs plots, and saturation indices show that water-rock interaction, particularly the dissolution of carbonate,evaporation minerals, and ion exchange processes affects hydrogeochemistry of the area. Additional processes such as evaporation and anthropogenic pollution from various sources can also have major impacts on groundwater salinity.
Keywords Groundwater · Irrigation · Drinking · WQI ·Sodium adsorption ratio · Wilcox’s diagram
1 Introduction
Groundwater is a major source of water for domestic,agricultural, and industrial uses in many countries in the world. In areas with low annual rainfall and long dry season, the underground reservoirs play a major role in satisfying the water supply. In Africa, groundwater is considered a substantial share of total natural water resources. In recent years, with the rapid increase in population, groundwater is becoming more important as a source of drinking and irrigation uses. Therefore, groundwater quality is a critical factor that influences human health and plant development, which is affected by its chemical composition. The geochemical properties of groundwater rely mainly on the chemistry of recharging water,water-rock interaction,and anthropogenic activities.Several hydrogeochemical studies have been applied to evaluate the status of groundwater quality (Abbasnia et al.2019; Acharya et al. 2018; Akter et al. 2016; Aminiyan et al. 2018; Belkhiri and Mouni 2012;et al.2018; Jain et al. 2010; Kaur et al. 2017; Sarath Prasanth et al. 2012; Singh et al. 2015) using certain physicochemical characteristics and geochemical indices such as‘electrical conductivity (EC), sodium adsorption ratio(SAR), soluble sodium percentage (SSP)’.
Groundwater in Northern Algeria has been considerably reduced due to over-exploitation, lack of rainfall and pollution, resulting in the shortage and deterioration of the groundwater. This could render serious threats to human beings, livestock and agricultural production. In this regard, hydrogeochemical analysis and methods were used to assess the quality of groundwater and its suitability for drinking and irrigation. Groundwater in Bougâa area(Northeast of Algeria) is a significant fraction of water supplies, with over 60 percent of the total water for domestic purpose and about 40% for agricultural and industrial purposes. This study will help to review the current state of water resources in the area, and also provide baseline data and a framework for future studies.
2 Study area
The study area(36°19′-36°21′N,5°03′-5°06′E)is situated in northeast Algeria, covering an area of about 70 km2(Fig. 1a). Its climate is sub-humid, with the annual precipitation of approximately 604.4 mm and the average atmospheric temperature of 15.6 °C. The average altitude varies between 800 and 1400 m. The geology of the study area consists of formations ranging in age from Triassic to Mio-Plio-Quaternary(Vila 1980).The Triassic is located in the west of the study area, which consists mainly of clay and evaporite minerals (gypsum, halite). The Jurassic formation is composed only of limestone and dolomite. The Cretaceous formations (Barremian to Maastrichtian) are characterized by an alternation of marl and limestone(Fig. 1b). The Paleocene and Eocene are formulated by limestone and marl. The Mio-Plio-Quaternary formations are composed of sand, clay, and gravel; These formations represent heterogeneous continental sedimentation (Vila 1977).
From a hydrogeological point of view, two important aquifers were identified based on lithostratigraphic and hydrogeological studies(Athemna 2006;Boudoukha 1998;Boudoukha and Athamena 2012; Cheddad 2008; Vila 1980); the first is the deep aquifer of limestones Cretaceous-Eocene (Neritic carbonate aquifer) recharged by vertically infiltrating meteoric water by fractures and fissures of massifs(Dj Guergour).This aquifer is exploited by deep wells with an average depth of 200 m (Athemna 2006). The second is the alluvial aquifer which is mainly formed by alluvial deposits. The latter is very heterogeneous alluvium comprising an alternation of permeable sediments (sand, gravel, sandy clay) with a thickness of 15-25 m.The study area is situated on the alluvial plain of the Mio-Plio-Quaternary where there are many water wells that tap shallow alluvial aquifer to a depth of 1 to 20 m with the direction of groundwater flow is from South to North toward Oued Sidi Ali (Cheddad 2008).
3 Sampling and analytical procedures
A total of fourteen groundwater samples (well and spring)were collected in April 2014 from the study area(Fig. 1a).In-situ parameters, including pH, EC, T, and TDS were measured by portable conductivity-meter (HANNA Hi-9813-6 Multiparameter) (Table 1). All samples were filtered with 0.45 μm membrane filter and collected in sterile 1000 mL bottles which had been stored in an icebox at a constant temperature < 4 °C and preserved in a refrigerator(< 4 °C)after acidification by nitric acid(5 mL of 6 N HNO3). The concentrations ofwere determined byusing a Jenway 6051 Colorimeter,by atomic absorption spectrometer (Perkin-Elmer model AAnalyst 200). All chemical analyses were performed in the laboratory of Hydrogeology, in the Constantine Faculty of Earth Sciences. The analytical precision of chemical analysis in groundwater samples can be checked by calculating the ionic balance error using the Eq. (1) (Appelo1996), which is within 5 % (Table 1).

4 Water quality index
Water quality index (WQI) is a useful tool to evaluate the suitability of water quality for drinking purposes. It has already been used in several studies to assess the quality surface water and groundwater (Bora 2017; Bouderbala 2017; Chaurasia et al. 2018; Fathi et al. 2018; S¸ener et al.2017; Soleimani et al. 2018; Wu et al. 2018). WQI was firstly proposed by Horton(1965)and further developed by Brown et al. (1970) based on physicochemical data and assigned weights according to their relative importance in the overall quality of water for drinking purpose. In this study, WQI has been calculated by the following three steps based on nine physicochemical parameters (n= 9):
· The first step is to assign weights (wi) to each of the parameters according to the relative significance of the groundwater parameter in drinking water quality.According to our physicochemical data, a maximum weight of 5 has been assigned to parameters such asand TDS as it plays a significant role in groundwater quality assessment; minimum weight of 1 was assigned tofor its insignificant role, while other parameters such as pH,Ca2+,Mg2+,Na+,and K+were assigned weights between 1 and 5 depending on their importance for drinking (Table 2).

Fig. 1 a Geological map of the study area (Vila 1980); b geological cross section through profile (AB)
· The second step involves calculating the relative weights (Wi) which are calculated using the following equation:

whereWiis the relative weight;wiis the weight of each parameter andnis the number of parameters.
· The third step consists in dividing the concentration of each parameter(Ci)in mg/L by its respective standards(Si) of drinking water quality recommended by theWorld Health Organization(WHO 2011),to compute a quality rating scale (qi) for each parameter using Eq. (3):
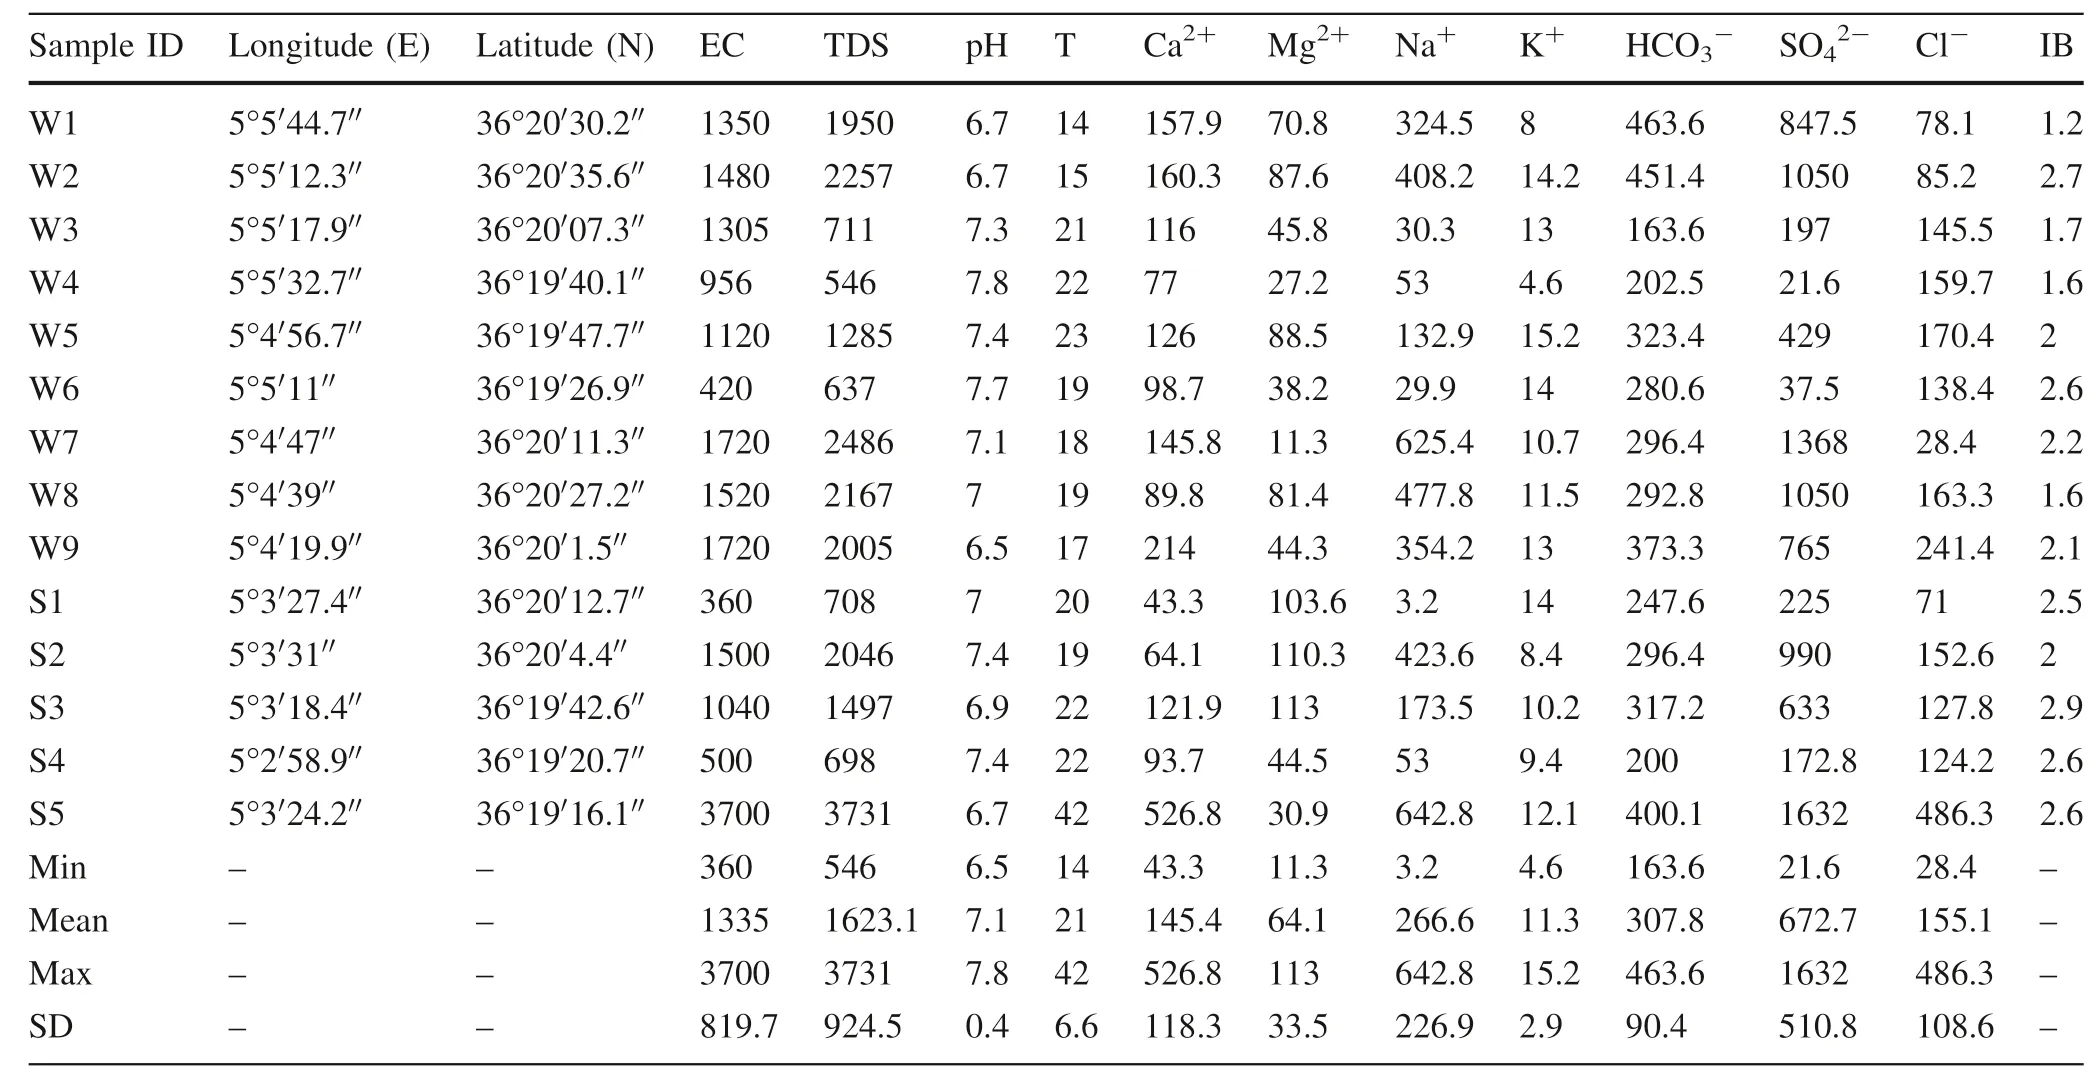
Table 1 Sampling locations and hydrochemical parameters of groundwater in the study area

Table 2 The weight (wi) and relative weight (Wi) of each chemical parameter

Finally, Eq. (4) represents the general formula for calculatingWQIvalues that can show water quality for drinking purposes. Five categories of water were classified according toWQIvalues, from excellent to water unsuitable for drinking purposes, as shown in Table 3.

4.1 Irrigation parameters
· Sodium adsorption ratio of water is a useful parameter used to assess the suitability of groundwater foragricultural activities (Richards 1954). It is calculated from Eq. (5):

Table 3 Water quality classification based on WQI value (Sahu and Sikdar 2008)

· Soluble sodium percentage is calculated by the following equation:

where Na+, K+, Ca2+and Mg2+are in (meq/L)
· Magnesium adsorption ratio is a calculated value,and it is defined by the following Eq. (7) in which the concentrations are in meq/L (Raghunath 1987):

· Residual sodium carbonate (RSC) can be calculated as follows:

All ions concentrations are expressed in meq/L.
· Permeability index (PI) is defined by the following equation:

· Kelly’s ratio (KR) is calculated using the following expression:

where Na+, Ca2+and Mg2+are expressed in (meq/L)
5 Results and discussion
5.1 Water quality for drinking purposes
Safe drinking water is a crucial factor in human health.Therefore, the change in physicochemical characteristics due to natural or anthropogenic pollution, which directly affects its quality attributes.The summary of the analytical results and the statistical measures such as a minimum,maximum, and mean are given in Table 1. The concentration of various physiochemical parameters in the groundwater samples is compared with the standard values of proposed by the BIS (Table 4),the qualified rates of the groundwater were 100% for pH and Cl-, 85% for Ca2+,78% for Mg2+, 71% for EC and 66% for TDS, respectively. As to Na+,K+,and SO42-,the qualified rates were 50%, 50%, and 42%, respectively. Generally speaking,most of the groundwater in the study area is suitable for drinking.
5.2 Water quality index
Water quality index(WQI)is considered as an indicator for the classification of water into five classes, which are excellent, good, poor, very poor and water unsuitable for drinking (Sahu and Sikdar 2008), the WQI values ranging from 55.8 to 342(Table 5)indicated that only 35.7%of thegroundwater is good for drinking purpose, and 42.8%,14.3% and 7.1% of the groundwater are defined as poor,very poor and unsuitable for drinking purpose,respectively(Fig. 2a, b).

Table 4 Comparison of the chemical composition of studied groundwater with BIS (2012)
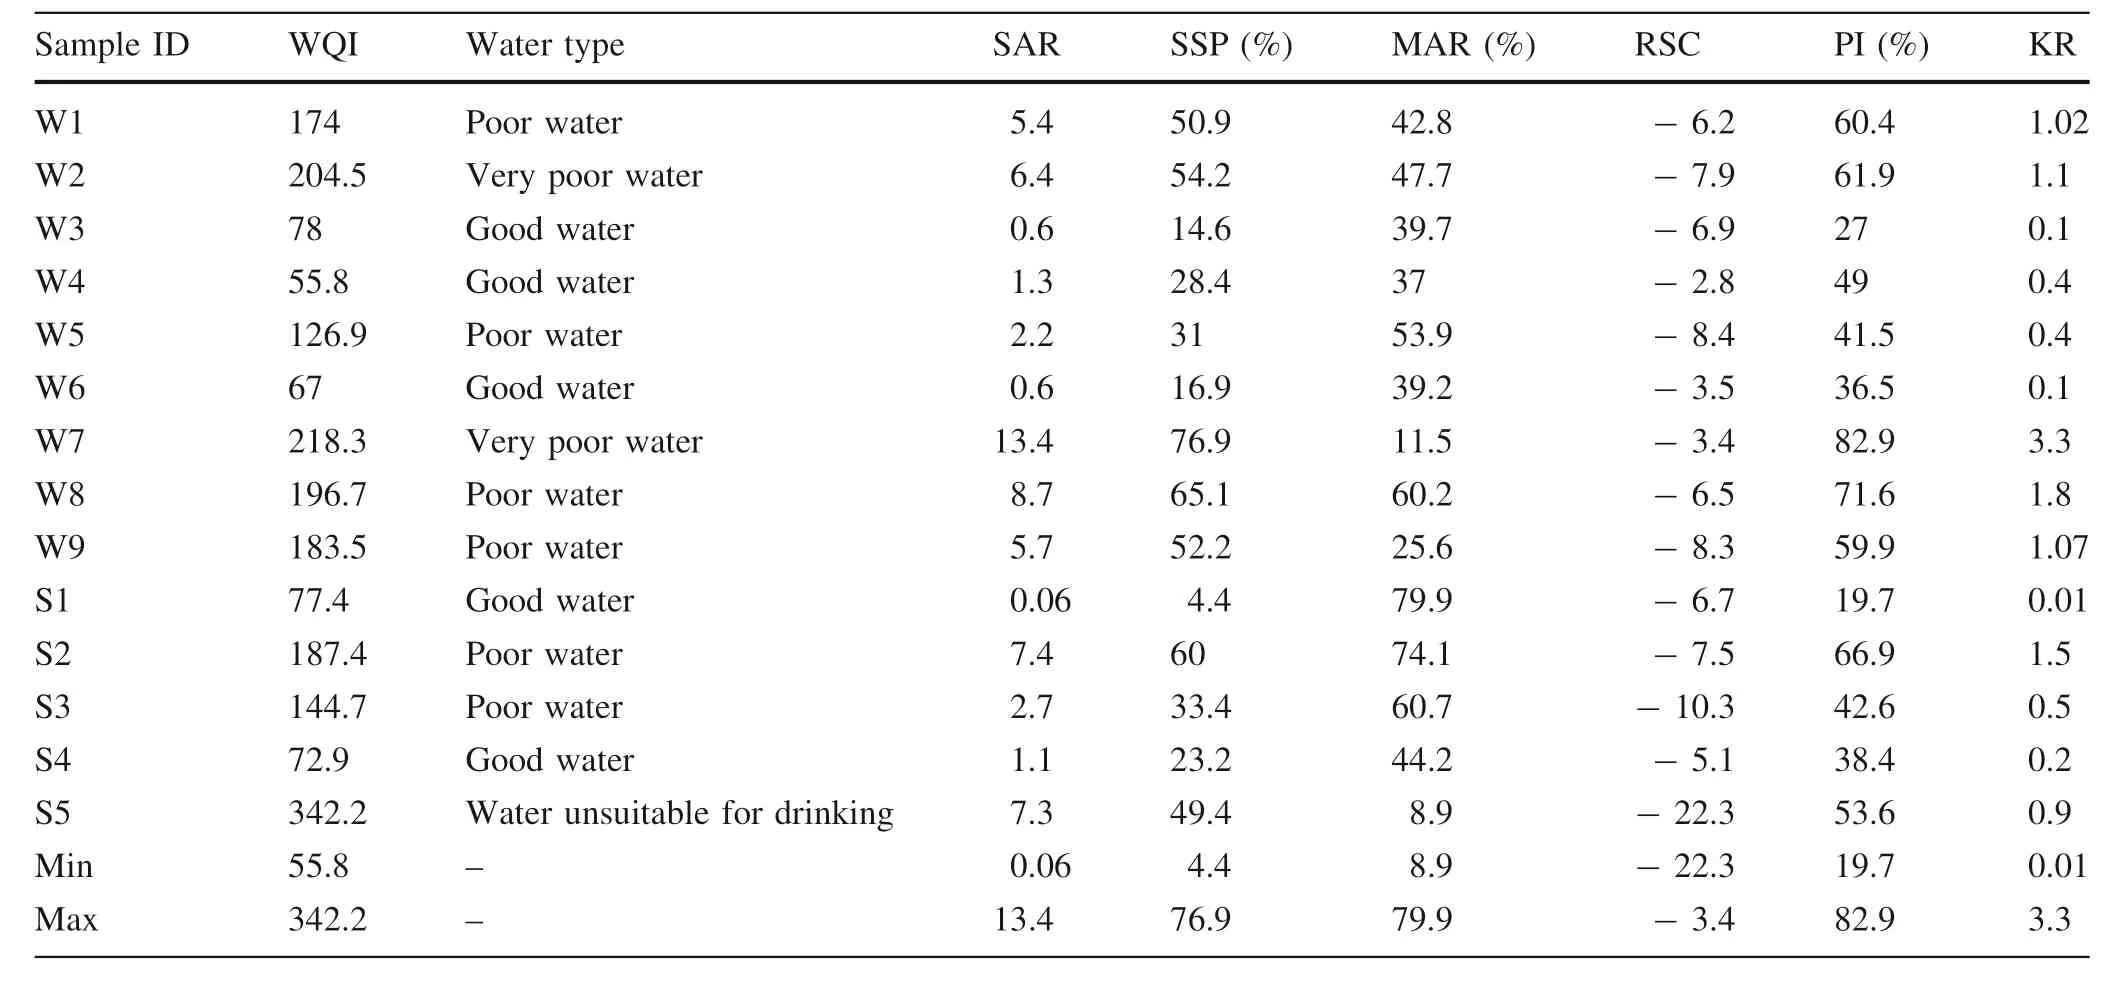
Table 5 Statistical summary of the calculated indices for the quality of drinking water and irrigation in the present study
5.3 Water quality for irrigation purposes
In agricultural areas,water is essential for irrigation and its quality significantly affects crop production. The high concentration of salt in water affects crop growth and soil.This is due to its accumulation in the root zone where it affects the permeability of the soil due to excess sodium or calcium leaching. In this study: (Electrical conductivity(EC), Sodium adsorption ratio (SAR), Soluble sodium percentage (SSP), Magnesium Adsorption ratio (MAR),Residual sodium carbonate(RSC),Permeability Index(PI),Kelly’s ratio (KR), US Salinity and Wilcox Diagrams)were used as indicators of water suitability for irrigation.

Fig. 2 a Variation in water quality index (WQI) in the study area; b WQI categories of groundwater samples (%)
5.3.1 Electrical conductivity (EC)
Electrical conductivity (EC) is one of the most important parameters that are needed for evaluating the quality of water for irrigation uses. Based on electrical conductivity values, water is divided into five classes from good to unsuitable for irrigation according to the World Food and Agricultural Organization (FAO) (Ayers and Westcot 1985). The five categories include excellent water(< 250 μS/cm), good water (250-750 μS/cm), permissible(750-2000 μS/cm), doubtful (2000-3000 μS/cm) and unsuitable(> 3000 μS/cm).In most parts of the study area,water quality varies from ‘good’ to ‘permissible’ for irrigation (Table 6), except for water of spring 5 it is considered unsuitable.
5.3.2 Sodium adsorption ratio (SAR)
Richards (1954) divided irrigation water into four categories, as shown in Table 6. The values of SAR in the studied groundwater ranged from 0.05 to 13.39 (about 92 % of the samples were less than 10) (Table 5), which are considered excellent for irrigation. This means that sodium has low risks and water of the area can be used for irrigation in all kinds of soil and crops.
5.3.3 Soluble sodium percentage (SSP)
SSP is frequently used to evaluate the hazard of sodium for irrigation(Wilcox 1955).In this case,the groundwater can be divided into five categories: excellent (SSP <20 %),good (20 %<SSP <40 %), permissible (40 %<SSP <60 %), doubtful (60 %<SSP <80 %), and unsuitable(SSP >80 %).In the present study,the values of SSP were between 4.4 and 76.9 % (Table 5), indicate that groundwater inarea basically suitable for irrigation(Table 6), except for two samples fall into doubtful category (60 %<SSP <80 %).
5.3.4 Magnesium adsorption ratio (MAR)
According to MAR values(in%),water is divided into two categories: Unsuitable (MAR >50) and Permissible(0 < Mar < 50). Based on the analytical results found(Table 5), about 57 % of groundwater samples are permissible and 43% come under the doubtful category for irrigation (Table 6).
I decided11 it was time to confront myself. That night at home, I took off all my clothes and had a long look at the woman in the mirror. She was androgynous. Take my face - without makeup12, it was a cute young boy s face. My shoulder muscles, arms and hands were powerful and muscular from the crutches13. I had no breasts; instead, there were two prominent scars on my chest. I had a sexy flat stomach, a bubble butt14 and a well-developed thigh15 from years of ski racing. My right leg ended in another long scar just above the knee.

Table 6 Classification of groundwater samples for irrigation use on the basis of EC, SAR, SSP, MAR, RSC, PI, KR
5.3.5 Residual sodium carbonate (RSC)
RSC is another parameter that can be an indicator of sodium carbonate in water. Due to a higher concentration ofthis leads to precipitateand Mg2+as carbonates (Eaton 1950). If RSC >2.5, water is usually unsuitable for irrigation (hazardous),1.25 < RSC < 2.5, water is potentially hazardous, if RSC <1.25; water is safe for irrigation. The RSC values of groundwater in this study area (Table 5) are less than 1.25, which shows that water is suitable and safe for irrigation (Table 6).
5.3.6 Permeability index (PI)
According to Doneen (1964), ‘the soil permeability is affected by long-term use of irrigation water. It is influenced by sodium, calcium, magnesium and bicarbonate contents of soil’. He classified the groundwater as three classes: class 1 (Excellent), class 2 (Good), and class 3(Unsuitable) based on Permeability Index. Class 1 and 2 water is categorized as good for irrigation with 75 % or more maximum permeability. Class 3 water is unsuitable with 25 % of maximum permeability. In the present study, all values of PI (%) ranged from 19.7 % to 82.9 %(Table 5). Almost all groundwater samples are in a good category, except that one sample is unsuitable (Table 6).Thus, we can conclude that the groundwater quality in the study area is good and suitable for irrigation.
5.3.7 Kelly’s ratio (KR)
KR is considered as an important parameter for the determination of the suitability of irrigation water, which is based mainly on the level of sodium against calcium and magnesium(Kelley 1963).When the values of KR are less than 1, water is suitable for irrigation. If the values of KR are over 1,this shows an excess level of Na+in water.The values of Kelly’s ratio of groundwater samples in the study area are shown in Table 5, where 57 % of samples are suitable for irrigation (KR <1), while 43 % is unsuitable (KR over one suggesting an excess of Sodium in groundwater) (Table 6). This result indicates that groundwater quality is partially suitable for irrigation.
5.3.8 US Salinity Laboratory’s diagram
5.3.9 Wilcox’s diagram
To determine the suitability of water for irrigation,Wilcox(1955) proposed a diagram in which sodium percentage(Na %) is plotted against electrical conductivity. This diagram classifies water into five types with increasing salinity hazards and sodium hazards: Excellent to good,good to permissible, permissible to doubtful, doubtful to unsuitable and unsuitable. In the present study, Wilcox classification diagram (Fig. 3b) shows that 21 % of samples belonging to excellent to good, 42 % fall in the good to permissible type, 35 % in the permissible to doubtful category and only samples S5 belongs to unsuitable zone for irrigation use. The studied water can be considered as good for irrigation.
5.4 Hydrogeochemical facies and mechanisms of controlling groundwater chemistry
To characterize different water type,Piper(1944)proposed a diagram where the concentration of cations and anions(in milliequivalent percentage) are plotted in two base triangles, which are projected further into the central diamond field. The water type is determined according to their placement near the four corners. The chemical data values from the different groundwater samples in the study area are plotted on the Piper diagram (Fig. 4), where it shows that most water samples under Ca-Mg-Cl and Na-Cl hydrochemical facies.
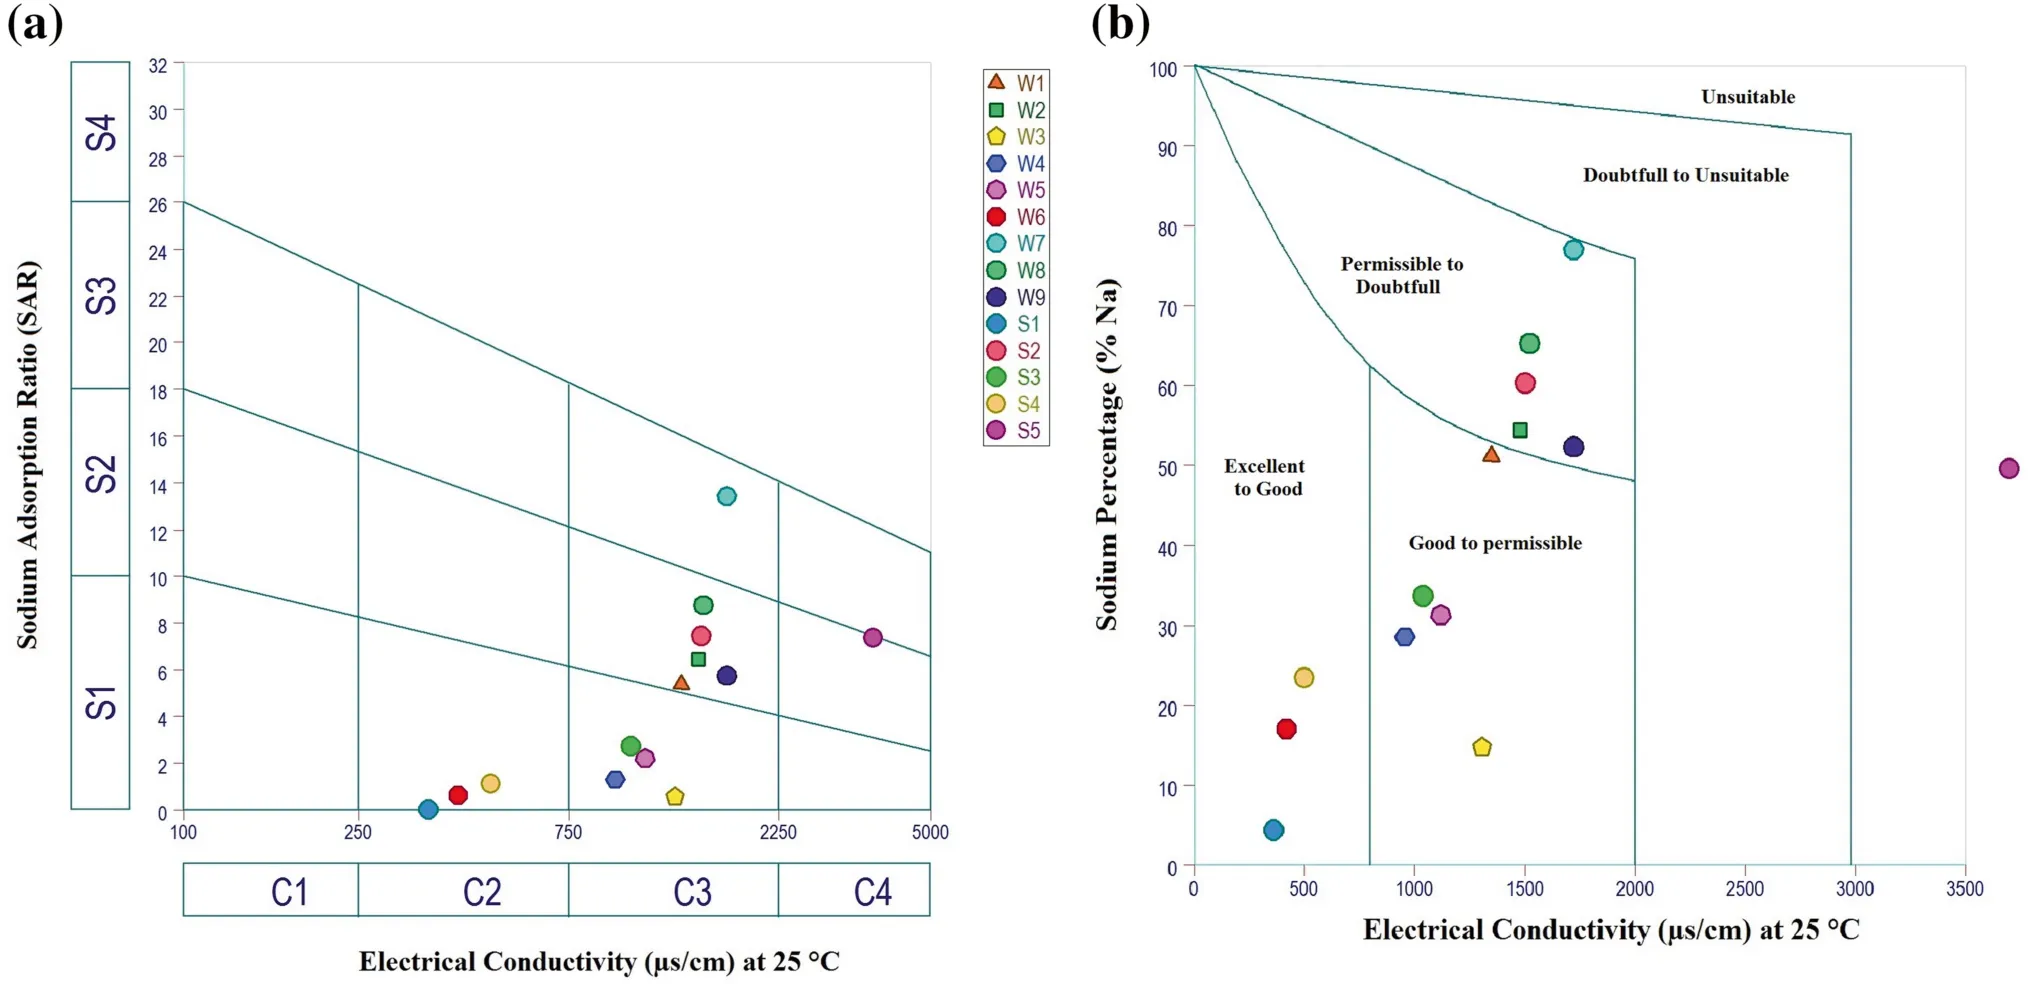
Fig. 3 a US salinity diagram of water samples; b Wilcox diagram of groundwater samples (after Wilcox 1955)

Fig. 4 Piper trilinear diagram for groundwater samples
Gibbs diagrams are an effective tool to determine the main processes that control the chemistry of groundwater,such as atmospheric precipitation, evaporation and rock weathering (Gibbs 1970). In the Gibbs diagrams, the ratio of dominant anions [Cl-/(Cl-+and cations[Na+/(Na++ Ca2+)] are plotted against the value of total dissolved solids (TDS). Gibbs diagram (Fig. 5a,b) shows that the predominant samples fall in the rock-water interaction and evaporation dominance fields which suggest that groundwater chemistry is affected by rock weathering,while the samples in the evaporation dominance field show increases in salinity by the increasing ions of Na+and Clin relation with increasing in TDS (Subba Rao 2002;Srinivasamoorthy et al. 2008; Al-Ahmadi 2013; Nazzal et al. 2014).
The concentrations of Cl-vary in low relation to those of Na+(Fig. 6a), which means that the presence of other likely sources of Cl-, which can be related to anthropogenic pollution from diversesuch as agriculture,industrial and domestic.and Ca2+concentrations vary from 163.6 to 463.6 mg/L and 43.3 to 526.8 mg/L,respectively. The plotversus(Fig. 6b) and Ca + Mg versus(Fig. 6c) suggest other non-carbonate sources of calcium, which is the dissolution of evaporite (mainly gypsum) as shown in the plot Ca2+versus(Fig. 6d). The plot (Ca + Mg) versus(HCO3+ SO4) (Fig. 6e) shows that most of the samples cluster around the 1:1 line indicates that the dissolutions of calcite,dolomite,and gypsum are the dominant reactions in groundwater according to Eqs. (11), (12) and (13) respectively, while the sampled waters shift to the left relative to an excess of HCO3+ SO4showing the influence of silicate dissolution and ion exchange.

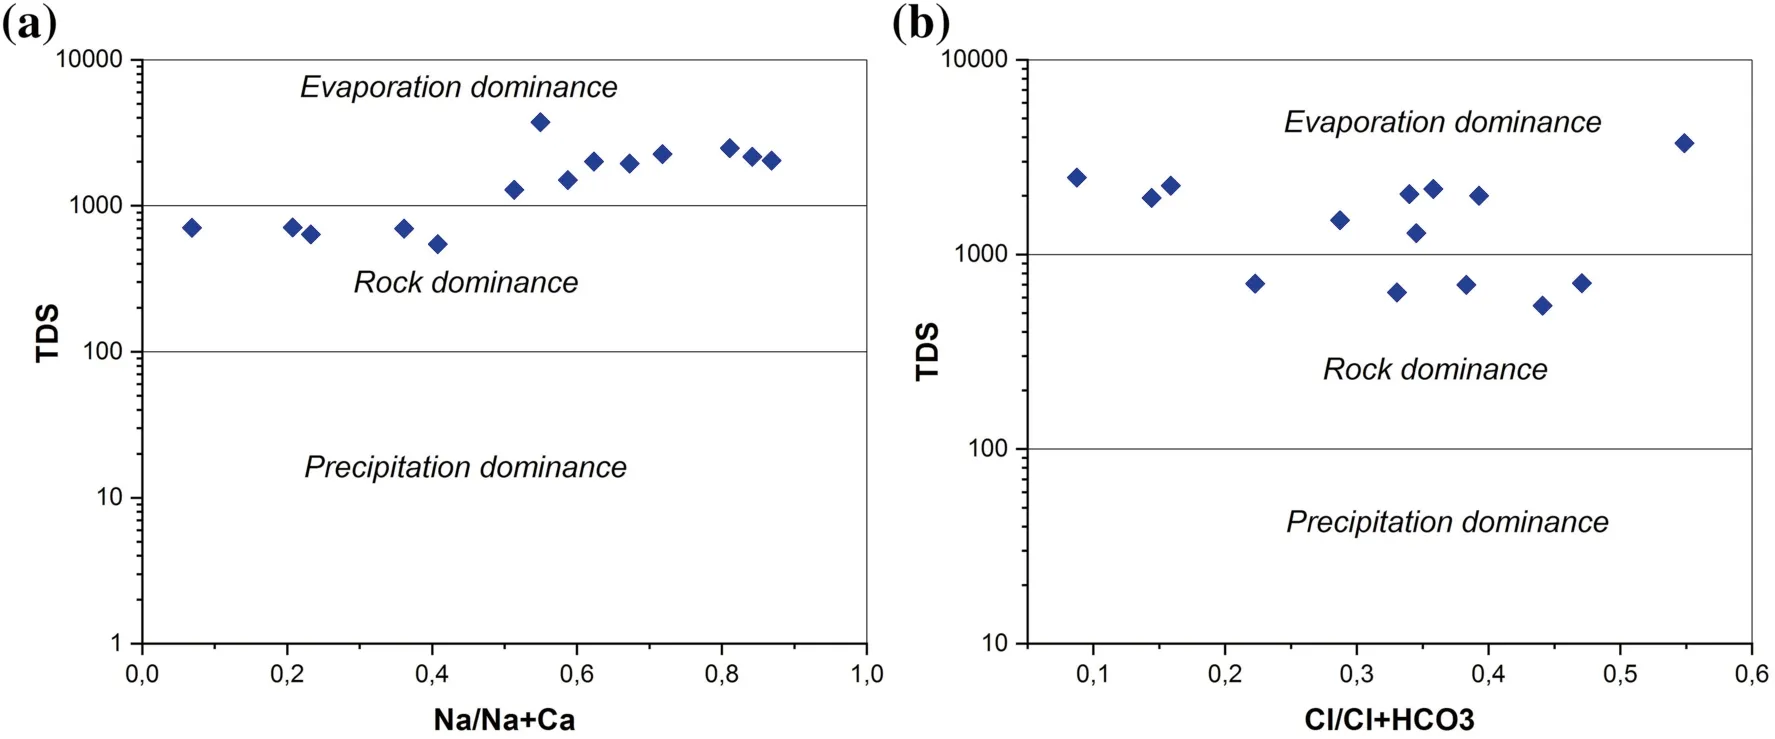
Fig. 5 Gibbs diagram for controlling factor of groundwater quality (a for cation; b for anion)
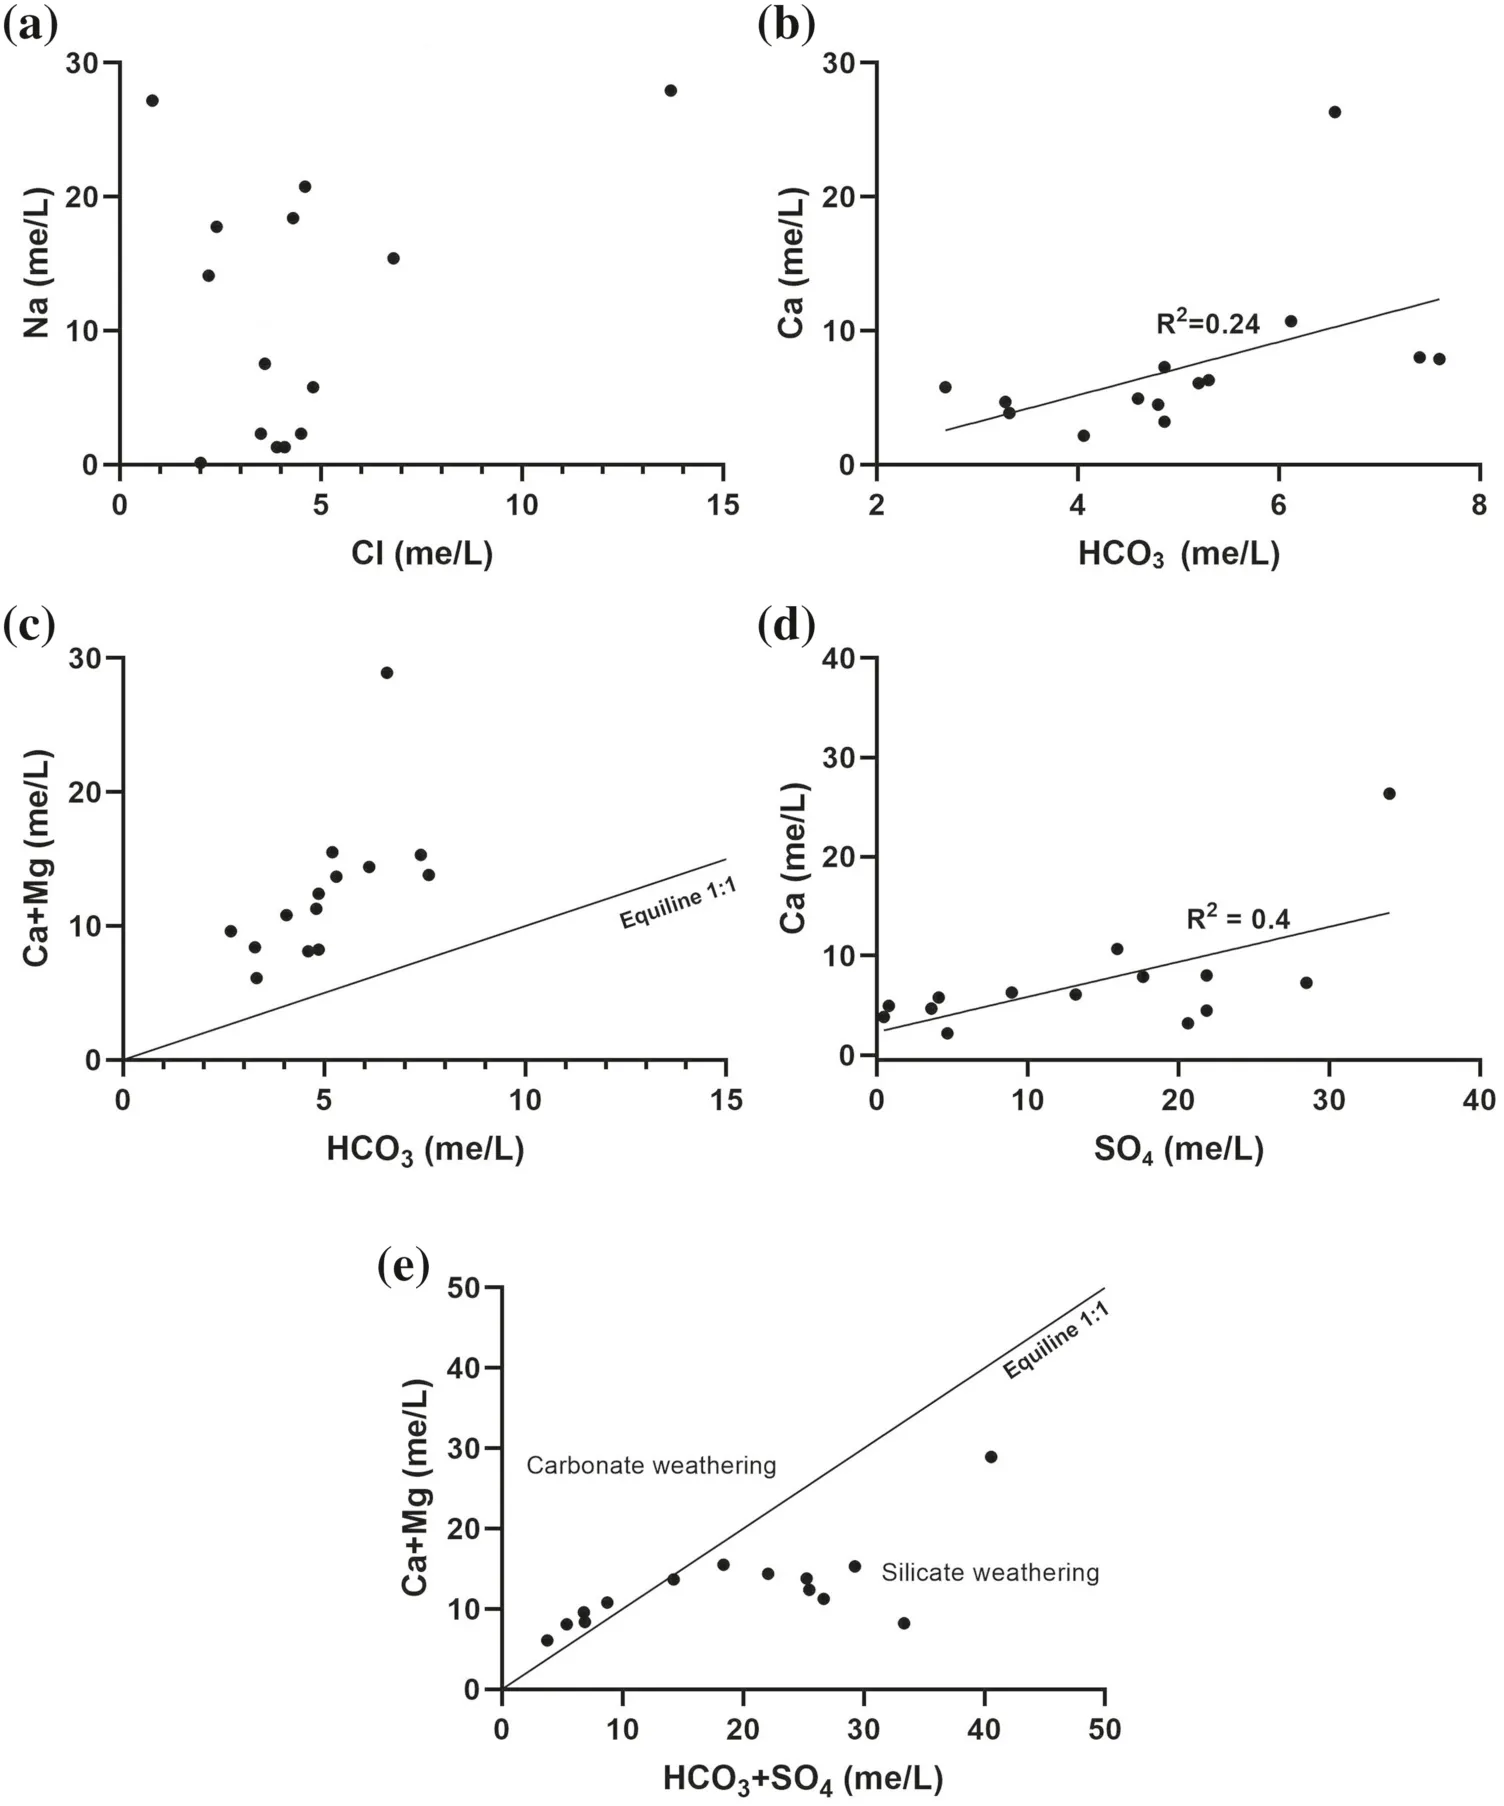
Fig. 6 a Na versus Cl;b HCO3 versus Ca; c Ca + Mg versus HCO3; d Ca versus SO4;e Ca + Mg versus HCO3 + SO4
Cation exchange is one of the most important geochemical processes that play an important role in controlling changes to groundwater chemistry (Clark 2015). The latter can be described by the chloro-alkaline indices(CAI), which has been suggested by Schoeller (1977) to indicate the exchange of ions between the groundwater and its host environment. According to Schoeller, CAI is defined as the ratio of [Cl--(Na++ K+)]/Cl-(in meq/L)where the positive value shows the existence of cation exchange between Na+and K+in the groundwater with Ca2+and Mg2+in the aquifer material (direct exchange),while a negative value indicates that there is an exchange Mg2+and Ca2+of the water with Na+and K+found in rocks (reverse exchange). In the present study, CAI values ranged from 0.03 to 2 (Fig. 7a) which suggest that Na and K from water get exchanged with Ca2+and Mg2+of the rocks.The ratioandis one of the most frequently used indicators to illustrate the occurrence of cation-exchange processes and its contribution to groundwater chemistry. If the cation exchange is the dominant process, the ratio should be a straight line with a slope of- 1(Fisher and Mullican 1997;Huang et al. 2013; Wang et al. 2015). Figure 7b clearly explains the cation exchange of Ca2+and Mg2+by Na+in groundwater. The results suggest that cation exchange is one mechanism responsible for the chemical composition of the groundwaters in the study area.
Geochemical modeling is a powerful tool for understanding the processes of water-rock interactions. The tendency for a mineral to precipitate or dissolve with respect to a given water composition is represented by the saturation index(SI)which indicates the des-equilibrium or the saturation state of a solution with respect to the certain mineral. This latter is defined by the following Eq. (14)(Deutsch 1997):

where IAP is the ion activity product andKspis the equilibrium constant. A negative saturation index (SI <0)indicates that the solution is undersaturated with respect to the mineral, while If SI >0, the solution is supersaturated with the components of the considered mineral. If the saturation index close to zero (SI = 0) indicates that the aqueous solution is at equilibrium with respect to the given mineral.
In this study,saturation indices were calculated from the chemical data of groundwater samples using the geochemical modeling code PHREEQC(Parkhurst and Appelo 1999). Figure 8 summarizes the results of the saturation indices for the studied waters, where all samples were undersaturated with respect to the gypsum, halite, and anhydrite, while most of the groundwater samples were supersaturated with respect to calcite, dolomite, and aragonite. These findings suggest that the dissolution evaporite minerals, precipitation/dissolution of carbonate minerals are the dominant processes controlling the hydrochemistry of groundwater in the area.
6 Conclusions
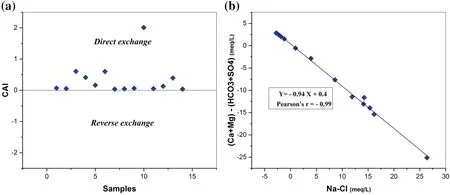
Fig. 7 a Chloro-alkaline indices (CAI) of groundwater samples; b relationships between (Ca + Mg)-(HCO3 + SO4) and (Na-Cl) in groundwater samples

Fig. 8 Saturation indices of groundwater samples
This paper highlights the groundwater quality and its suitability for drinking and irrigation purposes in Bougâa region (Northeast Algeria) using ten physicochemical parameters for fourteen groundwater samples. The chemical analyses showed that two hydrochemical facies are mainly observed in the groundwater samples: sodiumchloride (NaCl type) and calcium-magnesium -chloride water type (Ca-Mg-Cl type). According to the Bureau of Indian Standards (BIS IS 10500-2012), most groundwater samples are considered safe and fit for drinking as they fall within the permissible limits. The WQI results show that the groundwater samples have good to poor quality for drinking purposes.Various water quality indices like:‘EC,SAR, SSP, MAR, RSC, PI, KR’ show that most water samples are suitable for irrigation uses.US salinity diagram illustrates that the groundwater samples belong to C2S1,C3S1, and C3S2 categories indicating a medium to high salinity and alkalinity;this can be considered as suitable for irrigation uses, with few exceptions under specific conditions. Wilcox’s diagram shows that most of the groundwater in the study area is good for irrigation. Gibbs diagrams show that the predominant samples fall in the rock-water interaction and evaporation dominance field,suggesting that they are the dominant processes that control the groundwater chemistry.The chloro-alkali indices show that all samples have positive values, so the cation exchange process can influence the chemical composition of groundwater. Scatter plots show that groundwater chemistry is affected by anthropogenic activities, being derived from agricultural and domestic activities. The construction of sewage treatment plants before draining in irrigation canals,rivers and develop a practical strategy for monitoring groundwater quality are the appropriate solutions that can offer practical solutions to specific water pollution problems and to preserve and protect groundwater quality in the area.
AcknowledgementsThe authors wish to thank all members of the laboratory of Hydrogeology in the Constantine Faculty of Earth Sciences to provide the time and resources necessary to complete this work.
杂志排行

Acta Geochimica的其它文章
- Late Ordovician mass extinction caused by global warming or cooling?
- In-situ LA-ICP-MS trace element and oxygen isotope signatures of magnetite from the Yamansu deposit, NW China, and their significance
- Geochemical constraints on the origin of Early Cretaceous alkaline intrusions and its tectonic implication, Sulu Orogenic Belt, Eastern North China Craton
- Organic geochemical characteristics of Eocene crude oils from Zhanhua Depression, Bohai Bay Basin, China
- Geochronology and geochemistry of magmatic rocks in the Dongzi-Changhanboluo Pb-Zn ore district in Chifeng,Inner Mongolia, and their relationship with metallogenesis
- Zircon U-Pb dating, geochemical, and Sr-Nd-Pb-Hf isotopicconstraints on the age and origin of intermediate to felsic igneous rocks at South Altyn, Xinjiang, China