Soft landing of runaway currents by ohmic field in J-TEXT tokamak
2020-11-10JieHU胡捷WeiYAN严伟RuihaiTONG佟瑞海WeiLI李维ZhongyongCHEN陈忠勇AnjueDAI戴岸珏DuweiHUANG黄都伟YunongWEI魏禹农TiankuiMA马天逵YuanHUANG黄缘YangLI李阳WeiZHENG郑玮ZhifangLIN林志芳YouLI李由HuaiyuYANG杨怀玉DuoqinWANG王铎钦WeiBAI白炜YuZHONG钟昱JiangangF
Jie HU(胡捷),Wei YAN(严伟),5,Ruihai TONG(佟瑞海),2,5,Wei LI(李维),Zhongyong CHEN(陈忠勇),3,Anjue DAI(戴岸珏),Duwei HUANG(黄都伟),Yunong WEI(魏禹农),Tiankui MA(马天逵),Yuan HUANG(黄缘),Yang LI(李阳),Wei ZHENG(郑玮),Zhifang LIN(林志芳),You LI(李由),Huaiyu YANG(杨怀玉),Duoqin WANG(王铎钦),Wei BAI(白炜),Yu ZHONG(钟昱),Jiangang FANG(方建港) and J-TEXT Team,6
1 International Joint Research Laboratory of Magnetic Confinement Fusion and Plasma Physics,State Key Laboratory of Advanced Electromagnetic Engineering and Technology,School of Electrical and Electronic Engineering,Huazhong University of Science and Technology,Wuhan 430074,People’s Republic of China
2 Southwestern Institute of Physics,Chengdu 610041,People’s Republic of China
3 Chengdu University,Chengdu 610106,People’s Republic of China
4 Beibu Gulf University,Qinzhou 535000,People’s Republic of China
Abstract
Keywords:tokamak,disruption,runaway electron,hard x-ray
1.Introduction
Due to the large toroidal electric field during the current quench(CQ)of disruptions,it is predicted that a large runaway electron(RE)current could be generated in ITER[1-3].REs with several tens of mega-electron volt(MeV)energy striking the plasma facing components(PFCs)will threaten the safe operation of tokamaks.In order to achieve collisional suppression of the REs generated during disruptions,massive gas injection(MGI)[4-9]and shattered pellet injection(SPI)[10,11]system have been established in many devices.But the high-Z impurities injected cannot increase the electron density enough to reach the Rosenbluth-Putvinski density[12],which is related to the theoretical critical electric field.
Furthermore,the application of resonant magnetic perturbations(RMPs)can significantly reduce the RE current in ASDEX Upgrade[13]and COMPASS[14].Even in some devices[15-17],the RE current can be significantly suppressed by RMP.However,for the large device JET,the RMP has failed to suppress the RE generation during disruptions[18].Results of experiments and simulations in DIIID have shown that MHD instabilities may be effective in the RE current mitigation[19,20].Excitation of whistler and Alfvénic waves by REs observed in the series of experiments in DIII-D[21-24]can cause an increase of RE loss.Accordingly,it is possible to develop a novel method for RE current mitigation based on these studies of instabilities.
Once the suppression of REs failed,the RE current will be formed.The RE current with huge magnetic energy and kinetic energy must be dissipated or soft landed to reduce the damage to the device.The dissipation of RE current by high-Z MGI has been performed in several devices,while the dissipation effect becomes saturated with the increase of injected impurity quantity[25,26].Post-disruption RE beam dissipation by the SPI in DIII-D has been reported,but the dissipation effect does not show a significant difference between pellets and gas[27].An alternative method is to ramp down RE current plateau by reducing the toroidal electric field,i.e.the soft landing of RE current.
The theory in[12]has shown that the avalanche growth is predicted to not occur when the toroidal electric field of postdisruption plasma is less than the theoretical critical electric feild,i.e.E/Ecrit<1.Whether for suppression,dissipation or soft landing,it is particularly important to determine the critical electric feildwhich is a function of the total(free or bound)electron densityn.
e,tot It indicates that the toroidal electric field and total electron density together determine the value ofE/Ecrit.Experimental measurements of RE growth and decay rates under quiescent conditions have been performed in DIII-D,and the transition of HXR emissions from growth to decay has been found to occur 3-5 times above the theoretical critical electric field for avalanche growth[28].Later,a variety of ITPA joint experiments in many devices(including DIII-D,C-Mod,FTU,KSTAR,and TEXTOR)have measured the RE generation threshold electric field based on observations of RE onsets during the flattop phases,which is related to Dreicer generation.The measured threshold electric field on these devices of joint experiments is in the range of 4.5-12 times aboveEcrit[29].Simulations considering the whistler wave instability have indicated that the excitation of whistler waves can increase the critical electric feild and produced a threshold ofE/Ecrit~6.4,which is much closer to the above observations[30].The growth/decay rate of plateau-phase RE currents with applied positive/negative toroidal electric field has also been measured in DIII-D.It has been found that the RE current transition from growth to decay is atE−Ecrit≈1.0V m−1,and a fairly constant anomalous dissipation rate of order10 s−1exists[31].
Most of the experimental data on the RE generation threshold electric field come from the non-disruptive discharges,while the motivation for the above studies is REs during disruptions.Therefore,in order to obtain more data of disruptive discharges,the soft landing of RE currents by ohmic field is performed in J-TEXT,scanning the surface toroidal electric field from 1.6 to−0.3 V m−1during RE plateau phases.After the position of RE beam has been well controlled,the significant ramp down of RE currents can be observed when the surface toroidal electric field is less than about0.6 V m−1in J-TEXT.The RE current growth/decay rate and HXR emission growth/decay rate are both measured to describe the RE growth rate and compared with the avalanche theory.In addition,when the different toroidal electric fields are applied,the evolution of HXR emissions is analyzed in detail to study the RE loss characteristics.
This paper is organized as follows.In section 2,the experimental setup in J-TEXT is presented.In section 3,the typical experimental results are described,including the soft landing of RE current by the applied toroidal electric field and the measurement of RE current growth rate in J-TEXT.In section 4,the analysis of HXR bremsstrahlung spectra during disruptions is presented.The discussion is given in sections 5 and 6 is the summary.

Figure 1.The top view with the toroidal locations of the maindiagnostics and MGI valves in J-TEXT tokamak.The distances from the Forward HXR detector and the Backward HXR detector to the chamber wall are 4.5 m.The distance from the Limiter HXR detector to the limiter is 8 m.
2.Experimental setup
2.1.Experimental scenario
The experiments mentioned in this paper are performed in limiter configuration discharges in J-TEXT tokamak,which is a conventional iron core tokamak,operated at the major radiusR=1.05 m,the minor radius a=0.25-0.29 m with a movable titanium-carbide-coated graphite limiter[32].Typical pre-disruption plasma parameters are plasma currentIp=120- 150 kA,toroidal magnetic feildBT=2 T(and edge safety factorqa=4.1-5.2respectively).The line averaged electron density is in the range ofne~(1−2)×1019m−3and the electron temperature Te~0.8 keV.Under the above pre-disruption plasma parameters,the runaway(RE)current can be stably generated with MGI injection(about 2×10²⁰argon atoms)in J-TEXT tokamak[33].
2.2.Key diagnostics
Figure 1 shows the top view with the toroidal locations of the main diagnostics during disruptions and MGI valves in J-TEXT.
To study the REs during the flattop and the RE current plateau phase,the hard x-ray(HXR)spectrometer system has been developed in J-TEXT tokamak.The spectrometer system contains several NaI scintillator detectors and a multichannel analyzer(MCA)with 0.5 ms time resolution and 512 channels energy resolution[34].These scintillator detectors are used to measure the HXR emissions in the energy range of 0.4-10 MeV resulting from the thick target bremsstrahlung when REs are lost from the plasma and impact on the vessel walls[35-37].However,the measurements of the HXR emissions during the RE plateau regime are much more challenging because HXR emissions could reach the rates of 105-106counts s−1and higher.In order to prevent the output signals of detectors from saturating,the lead bricks have been placed in front of these detectors to shield part of HXR emissions.The HXR detector towards the limiter is still saturated due to a large amount of HXR emissions during disruptions.
Two HXR detectors are distributed in the forward and the backward REs movement direction to measure small pitchangle(less than 90° )and large pitch-angle(more than 90° )lost REs,respectively.In the following,‘Forward HXR’ and‘Backward HXR’ are used to represent these two HXR detectors.The positions of the Forward HXR detector and the Backward HXR detector are at the mid-plane with 4.5 m away from the chamber wall,and the collimation ports are aligned with the centerline of the vacuum vessel.
In addition,a fast frame visible camera which points at the MGI with a proper optical filter is used to monitor the penetration of impurity gas jet.Photos from the fast frame visible camera are filtered by Ar II(442.6 nm)filter for gas argon.
2.3.RE beam displacement control
In the event of failure of RE suppression,control of RE current and soft landing or dissipation of it are essential.During the thermal quench(TQ),the rapid drop in internal inductance means that the plasma is no longer in radial force equilibrium.However,the vertical field(VF)system maintaining radial equilibrium is essentially constant on the submillisecond timescale of TQ[38].Without optimized horizontal displacement control,the RE beam in J-TEXT will drift toward the low field side under the action of centrifugal force.
Experimental studies on the control of post-disruption RE beam have been documented in many devices,including TFTR,FTU,TCV,DIII-D and COMPASS[38-42].Referring to the control strategies in the above devices,similar experiments have been carried out by modifying the initial reference displacement of the VF.This strategy can avoid horizontal drift of RE beams toward the low field side,maintaining the RE beams in a safe position within the vacuum vessel,and avoiding the rapid termination of RE current.Without optimized horizontal displacement control(i.e.modifying the initial reference displacement of VF),the RE plateau is only lasting less than 20 ms.After the displacement control has been optimized,the RE plateau could be significantly elongated to more than 80 ms,as the statistical result illustrated in figure 2.Precise control of the VF could significantly lengthen the duration of RE plateau and provide preparation for following RE current soft landing experiments.
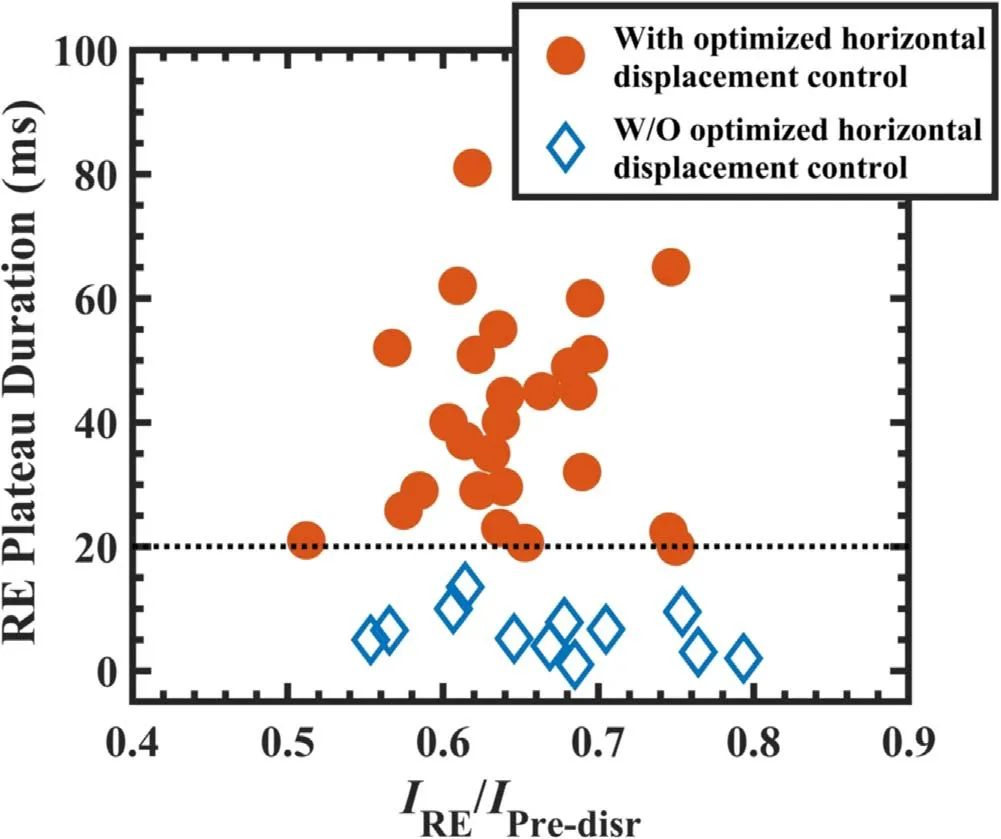
Figure 2.RE plateau duration versus the ratio of RE current IRE and pre-disruption plasma currentIPre-disr .Orange circles represent discharges with optimized horizontal displacement control.Blue rhombuses represent discharges without optimized horizontal displacement control.Each point represents one discharge.
3.Experimental results
3.1.Soft landing of runaway current
Under the stable control of the RE beam position,externally applied positive and negative toroidal loop voltages have a significant effect on the decay rate of RE current.In J-TEXT,rectification angle α of ohmic field coils could be modified to adjust the output voltage and the output power of OH field coils.The system of OH field coils is a 12-pulse rectifier bridge and its output voltageVOH=2.34Ecosα,where E is the secondary side voltage of the rectifier transformer(E=145 V),and the adjustable range of rectification angle α is 20°-160°.Because there is ohmic heat only,in the general discharge without external toroidal electric field applied,the role of the OH field is to maintain the plasma current and constantly provide energy for the RE beam.It is feasible to control the toroidal loop voltageVloopas well as the toroidal electric field by modifying the OH field output voltageVOHduring the RE plateau phase.
Time traces of plasma parameters from three discharges differing primarily in the externally applied toroidal loop voltage during disruptions are shown in figure 3.The external toroidal loop voltage is applied at the beginning of RE plateau phase on purpose,and the OH field output voltage reaches the set value at 0.31 s.In the general discharge(without modifying OH field voltage)with average toroidal loop voltageVloopis about 10 V(black curve,shot #1050017 in figure 3),the decay rate of RE current is very small.The average OH field voltageVOHis about 327 V.Mirnov signal shows that strong magnetic magnetohydrodynamic(MHD)activities have appeared in the CQ and the termination of RE current.The SXR emissions rapidly decline in CQ,and then gradually increase during the RE plateau phase.In the termination of RE current,the SXR emissions reach the maximum value and immediately drop down to zero.Each SXR emission spike corresponds to each burst of toroidal loop voltage and the Mirnov signal.Line averaged electron density is slowly rising with slight fluctuation.

Figure 3.Time traces from three discharges showing(a)plasma current Ip,(b)horizontal position of the plasmadx,(c)toroidal loop voltageVloop,(d)ohmic field voltageVOH,(e)Mirnov signal,(f)soft x-ray signal,(g)central line-averaged electron density ne .For the general discharge #1050017 represented by black curves,its average toroidal loop voltageVloop~10 V during the RE plateau phase.For the discharges#1050021 and#1050019 with externally applied toroidal loop voltage represented by blue curves and red curves,their average toroidal loop voltagesVloop~5 Vand Vloop~0 V during the RE plateau phase.The evolution trend of each signal in the discharge whose toroidal loop voltage is adjusted to the maximum(not shown in this figure)is almost the same with the general discharge #1050017.
As for the discharge whose toroidal loop voltage is adjusted to the maximum(not shown in figure 3),the evolution trend of each signal is almost the same with the general discharge #1050017(i.e.the discharge without external toroidal loop voltage applied).It can be considered that the output voltage of the OH field remains at the maximum value within the adjustable range in the general discharge.
Then for the discharge whose average toroidal loop voltageVloopis about 5 V(blue curve,shot #1050021 in figure 3),significant ramping down of RE current could be seen in figure 3.The average value of OH field voltageVOHdecreases to about 58 V.From the beginning of RE plateau to 0.31 s,SXR emissions rise slightly and then remain unchanged.During the termination of RE current,SXR emissions increase slightly again.Compared to the general discharge,the level of SXR emissions drops a lot.Line averaged electron density remains unchanged in the RE plateau phase.Both in toroidal loop voltage and Mirnov signal,only a small spike appears in the final loss phase.
For the discharge whose average toroidal loop voltageVloopis about 0 V and average OH field voltageVOHis about−216 V(red curve,shot#1050019 in figure 3),the decay rate of RE current is larger than that of shot #1050021.Spikes of toroidal loop voltage and Mirnov signal are also smaller.During the soft-landing phase,SXR emissions have a significant decline.So,the soft landing of RE current has been achieved by controlling the toroidal electric field reduction.
3.2.Runaway current growth rate
Previous work of theory for REs avalanche in[12]and DIII-D[31]has shown that due to the knock-on avalanche mechanism,the growth rate of RE current densityis given approximately by

One important issue is to estimate the value of the plasma internal inductancel.iThe soft x-ray emission profile can be used to roughly estimate theli.The approximateliis given by[43]:

where a is the minor radius of the plasma,and the width of the runaway current profileΔZcurrhas been characterized by the full width of the soft x-ray emission profile peak at 1/eof its maximum.Through this method,the internal inductanceliis about 1.3 in J-TEXT tokamak[44].
Another more important issue for the next-generation device is to confirm the value of ‘critical field’Ecritfor RE generation.The total electron density is difficult to obtain due to the lack of suitable diagnostics in J-TEXT,such as spectroscopy diagnostic or neutral pressure measurement on the vacuum vessel.Here we take a rough method to estimate the total electron density.After impurity injection by MGI,the electron density will increase due to the partial ionization of argon impurities.The change of the line-average electron density caused by the impurity can be expressed as Δne=Zmeannimp,wherenimpis the impurity density andZmeanis the mean ionization state of the impurity[26].The mean ionization stateZmeanis strongly dependent on the electron temperature but weakly dependent on the electron density.However,it is unavailable to measure the absolute electron temperature measurementTeduring disruptions in J-TEXT.
A method is adopted to estimate the post-TQ temperatureTe[45],where the exponential time constant of the current decay during CQ is a function of the electron temperatureTe.The decay of the plasma current during the CQ can be described with a simple circuit equation:

where the plasma is assumed to be a conductor of selfinductanceLp,with resistivityRp.The currents in the OH coils cannot significantly change during a fast CQ and therefore they have little influence on the current decay.ForLp/Rpconstant in time,the exponential time constantτCQis

The total plasma inductanceLpcan be approximated by

whereμ0is the permeability of vacuum,a is the minor radius of the plasma,andR0is the major radius of the plasma.The plasma resistivity is

where S is the plasma cross-section area.In consideration of impurity ions,the Spitzer resistivity can be expressed as[46,47]:

where the Coulomb logarithm lnΛ=9,and the effective Z is defined by

whereZjis the impurity ion charge number andnjis the ion density.The exponential time constant of the current decay during CQ is


Figure 4.The statistics of current quench time constant τCQ for 22 discharges.
A linear decay rate is often as good as the exponential decay rate in describing the decay of the current between 80%and 20%Ip,so that the time constantτCQcan be defined as

where due to the formation of RE plateau,the current decay to about60%Ipduring the CQ phase.The decay of the current between 90%and 70%Iphas been selected to calculate theτCQ.Figure 4 gives the statistics ofτCQfor 22 discharges.It can be found thatτCQis in the range of 0.5-0.9 ms and the average value is about 0.73 ms.Using this method,τCQcan be calculated knowing the electron temperatureTe.Then theZmeancan be calculated byTe.However,one issue must be noted:theZeffin equation(7)is related to theZmean(i.e.related to the ion composition of plasma).Therefore,at first,assumeZeff=1.AfterZmeanis obtained through the above calculation,a newZeffcan be obtained and used for the second iteration.After four iterations,the calculation error is less than10−4.The result of the fourth iteration is shown in figure 5,whereZeff=1.45.As shown in figure 5(a),the post-disruption electron temperatureTeis estimated as 2.58-3.62 eV,and the average value is 3.20 eV.TheZmeancalculated byTefor argon based on the ionization-recombination equilibrium is shown in figure 5(b)withne~(1−10)×1019m−3during disruptions in J-TEXT.It can be clearly seen thatZmeanof the argon impurity is estimated to be in the range of 1.75-2.06 and the average value is 2.00.
Although the PFC material is graphite in J-TEXT,previous research has shown that the+C content is less than 5%and mainly concentrated at the plasma boundary during the flattop phase in J-TEXT[48].For simple analysis,assume that the carbon composition can be neglected.In future work,the RE plasma composition during disruptions will be further measured accurately.Here,due to theZmean~2.00,the argon ion density can be estimated asis assumed that when+C content is ignored,the ionic composition during the RE plateau phase is 60%-81%+H mixed with 19%-40%Ar2+through this rough estimate.It

For bound argon electrons,the Coulomb logarithm is lnΛ=9.932 and for unbound(free)plasma electrons lnΛ=19.2.is only weakly dependent on Z.=46.5 for drag on REs due to electrons bound to argon(Z=18)and=46.3 for drag due to free electrons[31],and thecan be simply estimated as 46.4,for which only argon and free electrons are considered.
To study the RE current growth rate,the surface electric fieldEsurhas been scanned from 1.6 to−0.3 V m−1during the RE plateau phase in J-TEXT,and the critical electric field is estimated asEcrit≈0.04- 0.24 V m−1.The measured(blue squares)and predicted(red circles)RE current growth rateνRas a function of the ratio between surface electric field and the critical electric field,i.e.Esur/Ecrit,are shown in figure 6.The analysis method has been applied in DIII-D[31].Each circle or square pair corresponds to the middle of the RE plateau in a single discharge when the plasma position and electron density vary relatively slowly.The horizontal error bars on the squares in figure 6 reflect the range inEcritobtained from the error bar ofZmean.When ignoring the scatter of the data,there is an obvious linear relation between the RE current growth rate and the surface fieldEsur.The significant ramp down of RE currents can be observed when the surface toroidal electric field is less than about0.6 V m−1.The maximum ramp-down rate driven by the negative toroidal electric field is about3 MA s−1,which is much lower than by MGI with28 MA s−1in J-TEXT.The dissipation RE current by MGI injects a large amount of high-Z impurity gas,which may cause load on the vacuum vessel.Although the dissipation rate driven by the negative toroidal electric field is not as good as MGI,it still can be used as an auxiliary to MGI.When a certain dissipation rate of RE current is reached,combining these two strategies may require less gas injection,thereby reducing the requirements of MGI gas injection.

There are some differences between the trend of the experimental and theoretical curves.The intersection of the fitting line of measured points(blue line)and the horizontal axis is not at the point ofEcritin theory but the point of~ 12×Ecrit.WhenEsur/Ecrit~−3,the decay rate of RE current reaches its maximum of nearly70/s.As for the intersection of the fitting line of measured points withEsur/Ecrit=1,there is an anomalous RE current dissipation rate of−30/s.It is difficult to observe significant growth of RE current even with the large positive toroidal electric field in figure 6,which is similar to previous observations in JT-60U experiments[49].

4.HXR bremsstrahlung spectrum analysis
4.1.Comparison of HXR bremsstrahlung spectrum with different Esur/Ecrit
The typical HXR bremsstrahlung spectra of the lost REs from the MCA are shown in figure 7.To describe the HXR emission evolution clearly,we define the following two characteristic parameters:
(a)The maximum energymaxEREis defined as the intersection of the log-linear fit of an HXR high-energy tail with the levellog10Nγ/s=2.The analysis method refers to[24].
(b)The HXR temperatureTHXRis derived from the loglinear fit of an HXR high-energy tail,THXR=−1/k,where k is the slope of the fitting line.The analysis method refers to[50,51].TheTHXRcan represent the energy of the HXR spectrum to a certain extent.The larger theTHXR,the higher the HXR emission energy.The smaller theTHXR,the lower the HXR emission energy.
HXR bremsstrahlung spectra from three discharges have the same pre-disruption plasma parameters but the different externally applied toroidal electric fields during the RE plateau phase.The HXR bremsstrahlung spectra shown in figure 7(a)are measured with the Forward HXR detector and(b)with the Backward HXR detector.The pitch angle of RE,θ=arctan(v⊥/v‖),wherev⊥is the velocity vector parallel to the magnetic field and‖vis the perpendicular component.As shown in figure 1,the collimation chord of the Forward HXR detector is aligned with the direction of REs movement,measuring small pitch-angle lost REs,and the collimation chord of the Backward HXR detector is opposite to the direction of REs movement,measuring large pitch-angle lost REs.However,none of the HXR detectors in J-TEXT are absolutely calibrated.REs cannot be fully characterized by HXR emissions.The temperature of measured HXR spectra is not completely equal to the temperature of REs in the vacuum vessel.At present,we can only qualitatively describe the possible evolution trend of REs.In future work,we will do more calibration on the response of HXR detectors.
The measurement time of the HXR bremsstrahlung spectra is a period during the RE plateau phase when the evolution of RE current is stable,usually 15 ms after MGI injection until the beginning of the RE CQ.Three discharges shown in figure 7 are in the different conditions ofEsur/Ecritwhich are equal to 6.7,3.2 and 0.8.
It can be seen clearly that withEsur/Ecritincreasing,theTHXRfrom Forward HXR detector decreases but theTHXRfrom the Backward HXR detector increases,which means the large pitch-angle lost REs become more energetic but the small pitch-angle lost REs become less energetic.The defined maximum energymaxEREis similar to the variation ofTHXR.The temporal evolution of the HXR spectrum and the detailed analysis are described in the next section.
4.2.Temporal evolutions of HXR spectrum with different electric fields
The temporal evolutions of HXR emissions during disruptions with different electric fields are shown in figure 8.The HXR spectrum is shown for every 1.5 ms and obtains the two characteristic parameters mentioned above as well as the flux and total counts rate of HXR emissions.Figure 8 shows the temporal evolutions of these four characteristic parameters in two discharges.SettingVloop~10 V,Esur/Ecrit=6.7in shot#1050017 andVloop~0 V,Esur/Ecrit=0.8in shot#1050019.

The disruption is divided into three phases to analyze the temporal evolution of the HXR spectrum.There are two division criteria for the second phase.First,select the time range where toroidal loop voltage varies relatively slowly without obvious spikes.Second,select the time range where the temporal evolution of HXR emission approximately linear.For the two discharges in figure 7,first,the initial phase is defined as the middle of CQ to the initial phase of RE plateau(marked by I in figure 8),corresponding to the 0.003-0.012 s in shot #1050017 and 0.003-0.014 s in shot #1050019.Second,the middle phase is defined as the middle phase of the RE plateau(marked by II in figure 8),corresponding to the 0.012-0.024 s in shot #1050017 and 0.014-0.027 s in shot #1050019.Third,the RE CQ phase(marked by III in figure 8),corresponding to the 0.024-0.031 s in shot#1050017 and 0.027-0.031 s in shot #1050019.
4.2.1.The initial phase.For different applied toroidal electric fields,the temporal evolution trend of each characteristic parameter is similar.For the forward HXR emission,the log10Nγ,totand theTHXRrise rapidly.A large number of REs are generated and accelerated due to the large toroidal loop voltage during CQ.At the same time,a large fraction of REs are lost from the RE beam.The drop of the forwardlog10Nγ,totand the forwardTHXRcan be seen during the RE current initial formation phase,which probably due to the better confinement of REs.
As for the backward HXR emission,the temporal evolution of it is simple.The backwardlog10Nγ,totand the backwardTHXRboth keep slowly rising during the initial phase,and their values are lower than those of the forward.It seems that the loss of REs during the initial phase is dominated by the small pitch-angle REs rather than the large pitch-angle REs.
4.2.2.The middle phase.Compared with the initial phase,the evolution trend of HXR emission in the middle phase is gentler but performs a different evolution trend with different toroidal electric fields.In shot #1050017 with higherEsur/Ecrit,the forwardTHXRdecays but the backwardTHXRgrows.In shot#1050019 with lowerEsur/Ecrit,the evolution trend of HXR emission is opposite to the shot with higherEsur/Ecrit:the forwardTHXRgrows but the backwardTHXRdecays.The evolution trend of thelog10Nγ,totis similar to theTHXRin the two discharges.During this phase,HXR emission seems to be mainly affected by the toroidal electric field.As mentioned in section 2.2,the Forward HXR detector measures small pitch-angle lost REs and the Backward HXR detector measures large pitch-angle lost REs.These observations may indicate:when a higherEsur/Ecritis applied(shot #1050017),large pitch-angle lost REs become more energetic,and small pitch-angle lost REs become less energetic.In the case of the lowerEsur/Ecritapplied(shot#1050019),it is opposite that large pitch-angle lost REs become less energetic and small pitch-angle lost REs become more energetic.Detailed statistical results during this phase are given in figure 9.

Figure 9.Comparison of the growth rate of(a)total counts rate log10 Nγ,tot,(b)defined maximum energymax ERE and(c)HXR temperature THXR from the Forward HXR detector and the Backward HXR detector versus the ratio of surface electric field and critical electric feildEsur/Ecrit.
4.2.3.The RE CQ phase.In shot #1050017 with higherEsur/Ecrit,the variation of the plasma current is quite large during RE CQ phase so a large toroidal loop voltage is induced.It can be obviously seen that the forward HXR emissions lag behind the backward.During the first reduction phase of RE current which is corresponding to the first spike of toroidal loop voltage,what can be clearly seen that the drop of backwardTHXRandlog10Nγ,totis mainly caused by the loss of large pitch-angle REs.The increase of forwardTHXRand log10Nγ,totreflect the acceleration of small pitch-angle REs caused by the large toroidal loop voltage.During the second reduction phase of RE current which is corresponding to the second spike of toroidal loop voltage,the RE beam completely loses displacement control and directly hits the vacuum vessel wall,where the final drop of forwardTHXRand log10Nγ,totcan be seen.
In shot #1050019 with lowerEsur/Ecrit,the variation of the plasma current and the induced toroidal loop voltage are both small during RE CQ phase.There are only a small fraction of large pitch-angel REs losses.Without large toroidal loop voltage,the REs will almost not be accelerated so that there is no obvious rise in the forwardTHXRand log10Nγ,tot.The evolution trend of HXR flux and themaxEREis similar to theTHXRduring the whole disruption phase.
4.3.Characteristics of HXR
It seems that characteristic parameters in the phases II and III have a high correlation with the toroidal electric field.Figure 9 shows the growth rate of the total counts rate log10Nγ,tot,the defined maximum energymaxEREand the photon temperatureTHXRin forward and backward directions versus the ratio of surface electric field and critical electric fieldEsur/Ecrit,respectively.The time range of characteristic parameters in each discharge plotted in figure 9 is during the phase II,i.e.the middle phase of RE plateau mentioned above,when the influence of MGI gas injection is negligible and there is no obvious fluctuation in toroidal loop voltage.Each circle or square pair in figure 9 corresponds to the middle phase of the RE plateau in a single discharge.The horizontal error bars in figure 9 reflect the range inEcritobtained from the error bar ofZmean(the same in figure 6).
As theEsur/Ecritincreases,the growth rates of forward characteristic parameters are increasing,and the growth rates of backward characteristic parameters are decreasing.These statistical results may mean that as theEsur/Ecritincreases,the energy and quantity of small pitch-angle lost REs decrease,while the energy and quantity of large pitch-angle lost REs increase.The possible reasons for these observations will be discussed in section 5.Furthermore,the fitting line of the growth rate of each characteristic parameter from forward or backward direction has the same intersection atEsur/Ecrit~7.The transition from growth to decay is found to occur 3-5 times above the theoretical critical electric field measured by HXR emission under quiescent conditions in DIII-D[28].On the other hand,the transition of the RE current from growth to decay(or from decay to growth)happens atEsur/Ecrit~12in J-TEXT which is shown in figure 7.In response to changes in the toroidal electric field,t here is a~ 5×Esur/Ecritdifference between the growth rate of the RE current and the lost REs.

Figure 10.Ar II(442 nm)emissions measured with a filtered fast frame visible camera during disruptions in two discharges:Esur/Ecrit are equal to 6.7 and 0.8 in shot#1050017 and shot#1050019,respectively.Black dotted lines in(a)and(b)represent z-axis pixel at r=700,whose temporal evolution is drawn in(c)and(d)for the two discharges.The Ar II emission profiles are plotted in(a)and(b)at the moment when the plasma current Ip of two discharges is the same,which is represented by white dotted lines in(c)and(d).Black solid lines in(c)and(d)represent the temporal evolutions of the plasma current Ip.The MGI trigger time is atTMGI=0.3 s and Δ t=t−TMGI.
The influence of the toroidal electric field on the energy and the number of REs at different pitch angles is different.WhenEsur/Ecrit<1,the forwardmaxEREandTHXRgrowth rate are abnormally large,while the forwardlog10Nγ,totgrowth rate is small.That means when a large negative toroidal electric field is applied,forward HXR emissions are enhanced mainly due to the acceleration of small pitch-angle lost REs rather than an increase in the number of them.The backward maxEREandTHXRgrowth rate drop a little,while the backwardlog10Nγ,totgrowth rate drops a lot.The backward HXR emissions are reduced mainly due to the decrease in the number of large pitch-angle lost REs rather than the deceleration of them.
WhenEsur/Ecrit>7,the values of the backward maxEREandTHXRgrowth rate can exceed than zero easily.However,it is difficult to observe a large rise in RE current growth rate during the RE plateau phase in figure 6.
5.Discussion
This work has indicated that the transition of REs from growth to decay occurs at 12 times above the theoretical critical electric field by measuring RE current and 7 times by measuring HXR emission.In response to the changes ofEsur/Ecrit,the forward and backward HXR emissions show the opposite evolution trend.Possible sources are now discussed.
In order to study the effect on the argon impurities to REs,the fast frame visible camera with an Ar II(442.6 nm)filter is used to obtain the image which is expected to be dominated by line emission.The Ar II emission profiles in figures 10(a)and(b)are chosen at the time when the plasma current is the same.The temporal evolutions of the z-axis pixel and the plasma currentIpare shown in figures 10(c)and(d).
Strong emissions of the RE beam during disruptions can be seen in the image.BeforeΔt=0.01 s,the emission evolution trend is similar between the two discharges.Then the emission distribution becomes different after the externally toroidal loop voltage is applied atΔt=0.01 s.In shot#1050017 with higherEsur/Ecrit,even though the plasma current is slightly reduced over time,the emission distribution is wider.During the RE CQ phase,there are several large bursts of the emission distribution at the moment that the plasma current changes rapidly.Previous research in[19]has found that the RE loss is related to kink instabilities with similar bursts observed in the magnetic probe and HXR signals.However,in shot#1050019 with lowerEsur/Ecrit,as the plasma current decreases,the emission distribution becomes narrower and weaker.
The Ar II emission profile of the shot with higherEsur/Ecritis much broader than that of the shot with lowerEsur/Ecritunder the condition of the same plasma current.The previous result in figure 9 shows that when higherEsur/Ecritis applied,large pitch-angle lost REs are accelerated and increased.This Ar II emission profile may confirm the result of figure 9 that higherEsur/Ecritmay enhance the radial transport of REs and may cause high-energy REs to be scattered to a larger pitch angle.Furthermore,it would appear that the large toroidal electric field enhances the ionization of argon.Simulation results in[52,53]indicate that given the impact of collisions with screened nuclei on the dynamics of REs,RE beams will be strongly damped and the critical electric field will be increased due to the enhanced radiation loss rates in the presence of ionized impurities.This may explain the result shown in figure 6:through the analysis of figure 10,it can be found that the ionization of argon may be enhanced by the larger applied toroidal loop voltage.When a larger toroidal loop voltage is applied,because the partially ionized impurities are heavier,it is difficult to observe an obvious increase of the RE current growth rate in figure 6.Furthermore,the critical electric field is also increased by about 10 times as mentioned before due to the presence of ionized argon impurities.
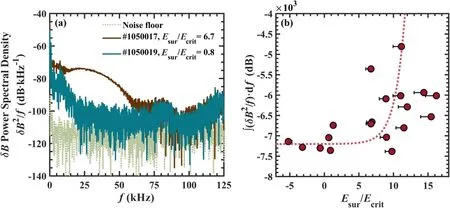
Figure 11.(a)Density-weighted magnetic fluctuation data are measured by Mirnov coil for discharges with different toroidal electric fields:Esur/Ecrit are equal to 6.7 and 0.8 in shot #1050017 and shot #1050019,respectively.The noise floor is measured prior to discharge initiation.(b)Density-weighted magnetic fluctuation data integration from 0 to 125 kHz for the discharges which were shown in figure 9 versus the ratio of surface electric field and critical electric field,Esur/Ecrit.There seems to be an exponential relationship between the density-weighted magnetic fluctuation data integration and theEsur/Ecrit .The scarlet dotted line shows this possible relationship.
In addition,the Mirnov coil is used to estimate magnetic fluctuation(δB)levels inside the RE beam,which are presented in figure 11(a).The measurement time range of two discharges is the same:Δtfrom 0.014 to 0.024 s.In the shot#1050017 with higherEsur/Ecrit,the magnetic fluctuation level in the range of 0-60 kHz is much stronger than the shot#1050019 with lowerEsur/Ecrit.Note that when the frequency range is higher than 60 kHz,the magnetic disturbance level between two discharges becomes less obvious.However,for other discharges,the frequency range with strong magnetic fluctuation amplitude is not necessarily in the range of 0-60 kHz.Density-weighted magnetic fluctuation data integration from 0 to 125 kHz(full frequency range)for each discharge versus theEsur/Ecritis shown in figure 11(b).The horizontal error bars in figure 11(b)reflect the range inEcritobtained from the error bar ofZmean(the same in figure 6).
Seemingly,the integration of density-weighted magnetic fluctuation data grows exponentially withEsur/Ecritincreasing,which can be seen from the dotted line in figure 11(b).WhenEsur/Ecritexceeds about 7,the density-weighted magnetic fluctuation data integration grows rapidly.This is very consistent with the growth/decay transition of the HXR characteristic parameters atEsur/Ecrit~7in figure 9.Previous studies have shown that kinetic instabilities in the MHz range driven by REs are considered to be a possible way to cause the losses of REs.Wave-particle interactions can increase the pitch-angle scattering of REs,therefore,they can induce local magnetic perturbations increasing the RE radial transport[24].The kinetic whistler wave instabilities can give a strong pitch-angle scattering for REs in the simulation of[30].Also,a radial diffusive loss of REs can occur due to magnetic fluctuations in the kHz range,which has been reported in[28].The above researches all mean that the magnetic fluctuations possibly increase the RE radial transport and give a strong pitch-angle scattering for REs.
In figure 9,when a largeEsur/Ecritis applied,the backward HXR emission is enhanced in energy and quantity of discharges(i.e.large pitch-angle lost REs are accelerated and increased),which might be caused by the enhanced magnetic fluctuation.There is a probability that the large toroidal electric field enhances magnetic fluctuation in the kHz range,leading to the enhance of radial losses of REs and thereby causing the increase of the pitch angle of lost REs.Previous studies in DIII-D have given a proposed mechanism for RE loss,which is very similar to our inferences:the decay of the plasma current during the CQ induces loop voltage,loop voltage accelerates REs,high-energy REs drive kinetic instabilities,instabilities increase the loss of REs[24].
It is not clear why the small pitch-angle lost REs become less energetic(showing a decline in forward HXR emission)when a higher toroidal electric field is applied.The whistler wave instabilities described in[21]can prevent REs from acceleration to high energies.The low-frequency magnetic fluctuations mentioned in figure 11 might also slow down the small pitch-angle RE.But it still cannot explain why these magnetic fluctuations have different effects on REs of different pitch angles.Future experiments will attempt to obtain the precise pitch angle of RE by some new diagnostics and deeply analyze the impact of instabilities on REs.
6.Summary
The soft landing of RE currents by ohmic field has been performed in J-TEXT tokamak.Under the condition that the RE beam position has been well controlled,the toroidal electric field has been scanned from 1.6 to−0.3 V m−1during RE plateau phases,which is aimed to improve the understanding of RE generation.It is found that when the toroidal electric field is less than 7-12 times the theoretical critical electric field,the decay of REs may occur.When the surface toroidal electric field is less than about0.6 V m−1in J-TEXT,a significant ramp down of RE current can be achieved.The maximum RE current dissipation rate by the ohmic field is about3 MA s−1in J-TEXT.An anomalous REs dissipation rate of about−30/s always exists compared with the avalanche theory.Because of this anomalous dissipation rate of REs,the HXR bremsstrahlung spectra have been analyzed:when the higher toroidal electric field is applied,the enhancement of backward HXR emission and the reduction of forward HXR emission are observed.When the lower toroidal electric field is applied,the enhancement of forward HXR emission and the reduction of backward HXR emission are observed.
In addition,some possible effects on the anomalous RE loss are observed in the experiments.The Ar II emission results suggest that the large toroidal electric field probably enhances the ionization of argon.Due to the impact of collisions with screened nuclei on the dynamics of REs[52,53],the presence of partially ionized argon impurities then enhances radiation loss rates and increases the critical electric field.Also,the enhanced magnetic fluctuations affected by the large toroidal electric field may result in the enhancement of the RE radial losses and change the RE loss characteristics.These results indicate that when the different toroidal electric fields are applied,the physical process of RE generation and loss may be different.
The experimental results in J-TEXT show that the soft landing of RE current by ohmic field has a good effect on the dissipation of RE currents.Due to the parameters of J-TEXT tokamak are much lower than ITER,further experiments are required to perform in other medium or large-sized devices.In addition,the control of density and toroidal electric field can be combined to optimize the dissipation effect on RE currents.Further work needs to be carried out to appropriately combine this soft-landing strategy and MGI/SPI in RE dissipation experiments of J-TEXT.
Acknowledgments
This work is supported by the National Key R&D Program of China(No.2017YFE0302000),the National Magnetic Confinement Fusion Science Program of China(Nos.2015GB111002,2015GB104000),National Natural Science Foundation of China(Nos.11775089,51821005,71762031,11575068 and 11905077)and the China Postdoctoral Science Foundation(2019M652615).
猜你喜欢
杂志排行

Plasma Science and Technology的其它文章
- Density limit disruption prediction using a long short-term memory network on EAST
- Research on the real-time signal conditioning method for dispersion interferometer in HL-2M
- Development and performance characterization of a compact plasma focus based portable fast neutron generator
- Dynamic heating and thermal destruction conditions of quartz particles in polydisperse plasma flow of RF-ICP torch system
- Numerical investigation on electron effects in the mass transfer of the plasma species in aqueous solution
- Design and characteristics of a triplecathode cascade plasma torch for spheroidization of metallic powders