Tumor necrosis factor alpha receptor 1 deficiency in hepatocytes does not protect from non-alcoholic steatohepatitis, but attenuates insulin resistance in mice
2020-10-29SenaBluemelYanhanWangSuhanLeeBerndSchnabl
Sena Bluemel, Yanhan Wang, Suhan Lee, Bernd Schnabl
Abstract
Key words: Tumor necrosis factor alpha receptor 1; Non-alcoholic steatohepatitis; Nonalcoholic fatty liver disease; Type 2 diabetes; Insulin resistance; Glucose intolerance
INTRODUCTION
Complications of the obesity epidemic are increasing globally. Over 70% of obese adults have non-alcoholic fatty liver disease (NAFLD)[1]. Disease progression to nonalcoholic steatohepatitis (NASH) and cirrhosis – often complicated by hepatocellular carcinoma (HCC) – worsens the prognosis. Therefore, NASH and its complications are becoming the second leading indication for liver transplantation[2,3]. Besides weight loss, only moderately effective therapies exist to reverse NASH[4]. Understanding the pathogenesis of NASH is therefore crucial for the development of novel treatment strategies.
The development of NAFLD and NASH is triggered by intestinal dysbiosis[5-13]. This is underlined by the transmission of the disease through co-housing experiments in mice and microbiota transplantation to germ-free mice[14,15]. Poor nutrition and dysbiosis can damage the intestinal epithelial barrier and facilitate endotoxemia[16]. Lipopolysaccharide (LPS), which is a component of the outer membrane of Gramnegative bacteria, acts as an endotoxin. LPS activates toll-like receptor 4 (TLR-4). TLR-4 expression is elevated in liver biopsies of patients with NASH compared with NAFLD[17]. Downstream signals of TLR activation, such as release of tumor necrosis factor alpha (TNF-α), contribute to liver inflammation and fibrosis[18-20].
TNF is a pro-inflammatory cytokine thought to be substantially involved in the progression of liver disease[18-20]. TNF signal transduction is mediated by TNF receptor 1 (TNFR1) and TNFR2. Whereas TNFR1 activation is thought to drive inflammation and metabolic alterations, TNFR2 regulates regeneration and immune response in a protective manner[21,22]. In obesity, adipocytes are a major systemic source of TNF, while in the liver TNF is mainly released from Kupffer cells[23,24]. Obese patients have higher serum levels of TNF, and patients with NASH have higher hepatic expression ofTNFcompared with NAFLD[25,26]. In a mouse model of NAFLD, TNF was suggested to be a driver of HCC development and tumor-associated inflammation[27,28]. Conversely, obese mice with whole-body knockout ofTnfr1have lower hepatic lipid accumulation, lower level of the pro-inflammatory cytokine IL-6, and lower hepatic accumulation of neutrophils and macrophages[27]. Moreover, inducers of hepatocellular endoplasmic reticulum (ER) stress, which promotes NASH progression, are lower inTnfr1-deficient mice[28,29]. This suggests that TNF signalingviaTNFR1 is important for the development of steatohepatitis. However, results are conflicting, with other studies showing more hepatic steatosis as well as fibrosis and higher inflammatory markers in mouse livers of high-fat diet-induced NAFLD and dysfunctional TNFR1[30]. Therefore, the role of TNF and TNFR1 signaling in NAFLD and NASH remains unclear. The abovementioned studies on TNFR1 involvement in hepatocellular ER stress suggest that TNFR1 signaling in hepatocytes is crucial for NASH progression (rather than TNFR1 activation in other liver-homed cells, such as Kupffer cells or stellate cells).
To address this question, we investigated the role of TNFR1 signaling in hepatocytes on hepatic steatosis and steatohepatitis in a mouse model of diet-induced NASH.
MATERIALS AND METHODS
Mice
Mice with loxP sites inserted in the tumor necrosis factor receptor 1 gene (Tnfr1flxneo/flxneo) were generated after receiving sperm from the European Mouse Mutant Archive[31]. These mice have exons 2 to 5 flanked with loxP sites and were crossed with albumin-Cre transgenic mice (The Jackson Laboratory, Sacramento, CA) to create mice with a deficiency ofTnfr1(Tnfrsf1a) specifically in hepatocytes (TNFR1ΔHEP). Albumin-Cre negativeTnfr1flxneo/flxneolittermates were used as controls (TNFR1fl/fl). All mice were on a C57BL/6 background, and were maintained on a 12:12-h light-dark cycle. After weaning, male mice were housed with littermates of the same genotype for experiments. At age 8 wk, mice were started on a fast food diet (FFD) consisting of irradiated western-style diet (AIN-76A; TestDiet, St. Louis, MO, United States) for 20 wk[32]. Drinking water was supplemented with 23.1 g/L fructose (F0127; Sigma Aldrich, St. Louis, MO, United States) and 18.9 g/L glucose (G8270; Sigma Aldrich) to mimic high-fructose corn syrup containing soft drinks[3]. Control mice (Ctrl) received autoclaved tap water and irradiated standard chow (5053 PicoLab Rodent Diet; LabDiet, St. Louis, MO, United States). Mice had free access to food and water.
A glucose tolerance test (GTT) was performed after 18 wk of feeding by injecting 1 µg glucose/g body weight intraperitoneally[32]. After 19 wk of feeding, an insulin tolerance test (ITT) was performed by intraperitoneal injection of 0.5 mU/g body weight insulin (Novolin N NPH; Novo Nordisk Inc, Princeton, NJ, United States). Prior to both tests, mice were fasted for 6 h. Blood glucose levels were assessed from tail vein blood before injection (t= 0 min) and att= 15, 30, 60, 90, and 120 min following injection.
All animal studies were reviewed and approved by the Institutional Animal Care and Use Committee of the University of California, San Diego.
Biochemical analyses
Biochemical analyses were done according to the manufacturers’ protocols. Alanine amino transferase (ALT) was measured from plasma obtained from inferior vena cava using a kinetic assay (TR71121; Thermo Fisher Scientific, Waltham, MA, United States). Triglyceride levels were measured with a colorimetric endpoint assay (T7532; Pointe Scientific, Canton, MI, United States) after tissue homogenization in phosphatebuffered saline, and precipitation of lipids using methanol and chloroform. Liver hydroxyproline was extracted from 150-250 mg of mixed liver specimens from the right and left liver lobes[32]. The tissue was homogenized in 6N HCl (3750-32; USABlueBook, Forest Park, GA, United States) using lysing matrix C tubes (MP116912; MP Biomedicals, Santa Ana, CA, United States) and a Mini-BeadBeater-96 (GlenMills, Clifton, NJ, United States)[32,33]. The homogenate was incubated at 110 °C for 18 h and subsequently filtered using Whatman®filter paper grade 595 1/2 (WHA10311644; Sigma Aldrich). The lysate was incubated with chloramine T- (C9887; Sigma Aldrich) as well as Ehrlich’s perchloric acid solution (AC168760250; Thermo Fisher Scientific). Triplicates were measured at 558 nm (SpectraMax 190 Microplate Reader; Molecular Devices LLC, Sunnyvale, CA, United States)[33,34].
Tissue staining
At harvesting, the median liver lobe including the gall bladder was fixed in 10% formalin (HT501128; Sigma Aldrich) for 24 to 48 h, and then transferred to 70% ethanol and embedded in paraffin[32]. Five µm paraffin sections were stained with hematoxylin and eosin (H&E) (38015 and 380161 SelecTech; Leica Biosystems Inc., Buffalo Grove, IL, United States) or 0.1% picro Sirius red (color index 35780, 365548; Sigma-Aldrich), respectively.
Gene expression analysis
Liver RNA was extracted using Ambion Trizol Reagent (15596; Thermo Fisher Scientific). RNA was treated with RQ1 RNase-Free DNase (M6101; Promega), and was reverse-transcribed using the Applied Biosystems High-Capacity cDNA Reverse Transcription Kit (43688; Thermo Fisher Scientific). Real-time qPCR was performed on the Applied Biosystems StepOnePlus Thermocycler (4376600; Thermo Fisher Scientific) using iTaq Universal SYBR Green Supermix (Bio-Rad, Hercules, CA, United States). Primer sequences were obtained from the Harvard PrimerBank[35,36]. The primer used for proving the absence ofTnfr1was generated using NCBI primer blast; the sequences were: ACCGTGACAATCCCCTGTAA (Fwd) and CTCTTTGACA GGCACGGGAT (Rev). These primer amplified mRNA from exon 3 to exon 7. Gene expression was normalized to mouse TATA-Box binding protein gene and expressed relative to Ctrl-fed TNFR1fl/flmice.
Statistical analyses
Numbers of biological replicates for each experiment are given in the respective figure legends. The area under the curve was used to compare blood glucose levels from ITT. The area over baseline (AOB) was calculated to compare blood glucose levels from GTT. Groups were compared by two-way analysis of variance with Tukey’s post hoc test. All results are expressed as mean + standard error of the mean. Analyses and data plots were done with GraphPad Prism 6.01 (GraphPad Software, Inc., La Jolla, CA, United States). Significant differences are marked with (a) ifP< 0.05.
RESULTS
TNFR1ΔHEPmice were fed for 20 wk with a western-style diet (FFD) to evaluate, if the absence of TNFR1 in hepatocytes is protective against diet-induced NASH.
Mice with a deficiency of TNFR1 in hepatocytes are not protected from obesity
LowerTnfr1expression in liver samples from mice with a deficiency of TNFR1 in hepatocytes is shown in Figure 1A. Food intake is given in Figure 1B. FFD led to an increase in body weight and adipose tissue (Figure 1C-F). However, FFD-fed TNFR1ΔHEPmice did not differ from their TNFR1fl/fllittermates in terms of body weight, epididymal fat weight and brown fat weight (Figure 1C-E). Taken together, westernstyle diet-fed TNFR1ΔHEPmice develop similar features of obesity compared with their TNFR1fl/fllittermates.
Mice with a deficiency of TNFR1 in hepatocytes are not protected from diet-induced steatohepatitis
To determine the significance of TNFR1 in hepatocytes for the development of NASH, parameters of liver injury, steatosis and fibrosis were investigated. Hepatic injury, expressed as plasma ALT, was not significantly different between FFD-fed TNFR1ΔHEPmice and their TNFR1fl/fllittermates (Figure 2A and B). Similarly, hepatic steatosis, expressed as total liver triglycerides and relative liver weight, did not differ between FFD-fed TNFR1ΔHEPmice and their TNFR1fl/fllittermates (Figure 2C and D). Representative liver sections are given in Figure 2B. Fibrosis, expressed as total liver hydroxyproline, was higher in FFD-fed mice, but not significantly different from control-fed mice in TNFR1ΔHEPas well as TNFR1fl/flmice (Figure 2E and F). Liver inflammation, assessed by gene expression forIl1β,Tnf, andCcl2, did not differ between FFD-fed TNFR1ΔHEPmice and TNFR1fl/fllittermates (Figure 2G). Taken together, western-style diet-fed TNFR1ΔHEPmice develop similar signs of liver inflammation and fibrosis compared with TNFR1fl/fllittermates.
Mice with a deficiency of TNFR1 in hepatocytes are partially protected from glucose intolerance
To assess the metabolic phenotype, TNFR1ΔHEPmice and their TNFR1fl/fllittermates were subjected to a glucose and an insulin tolerance test. The FFD-fed TNFR1ΔHEPmice did not develop glucose intolerance compared to their Ctrl-fed littermates (Figure 3A). The result was confirmed with the insulin tolerance test that showed a higher drop of blood glucose levels after insulin injections in FFD-fed TNFR1ΔHEPmice compared with TNFR1fl/fllittermates (Figure 3B). Taken together, although western-style diet equally induced obesity in TNFR1ΔHEPand TNFR1fl/fllittermate mice, interestingly, TNFR1ΔHEPmice were resistant to the development of diet-induced glucose intolerance and insulin resistance.
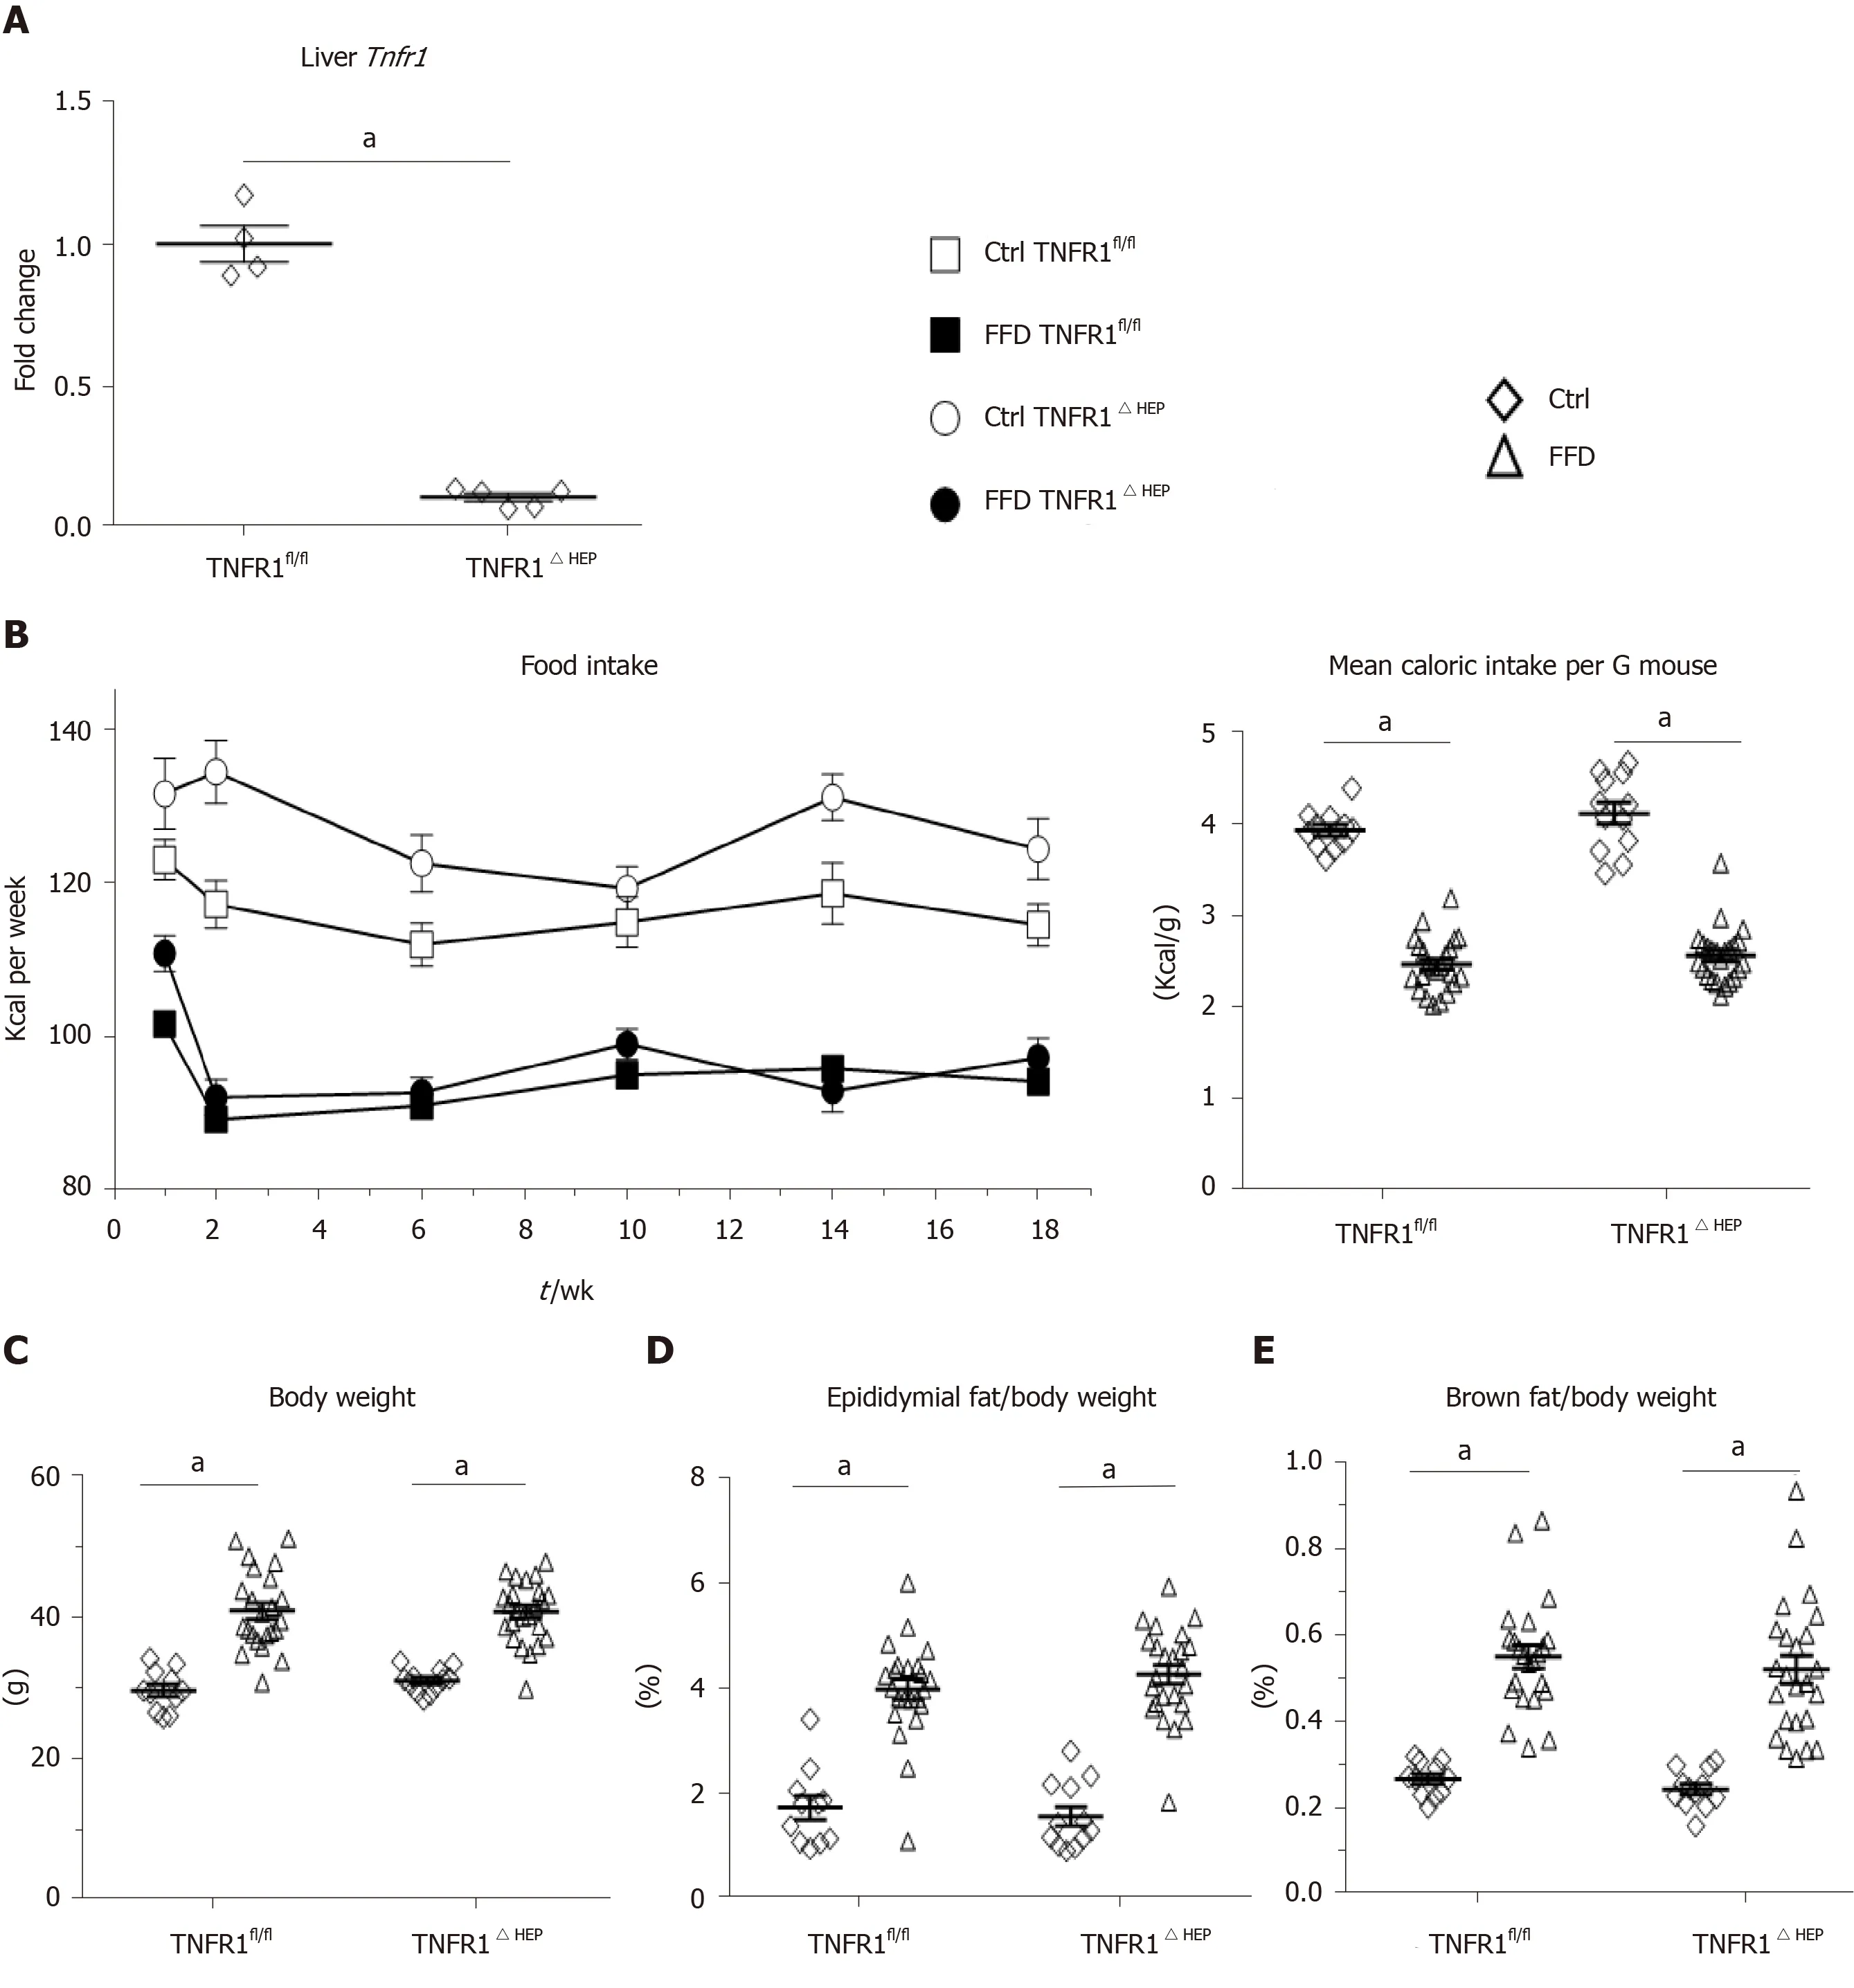
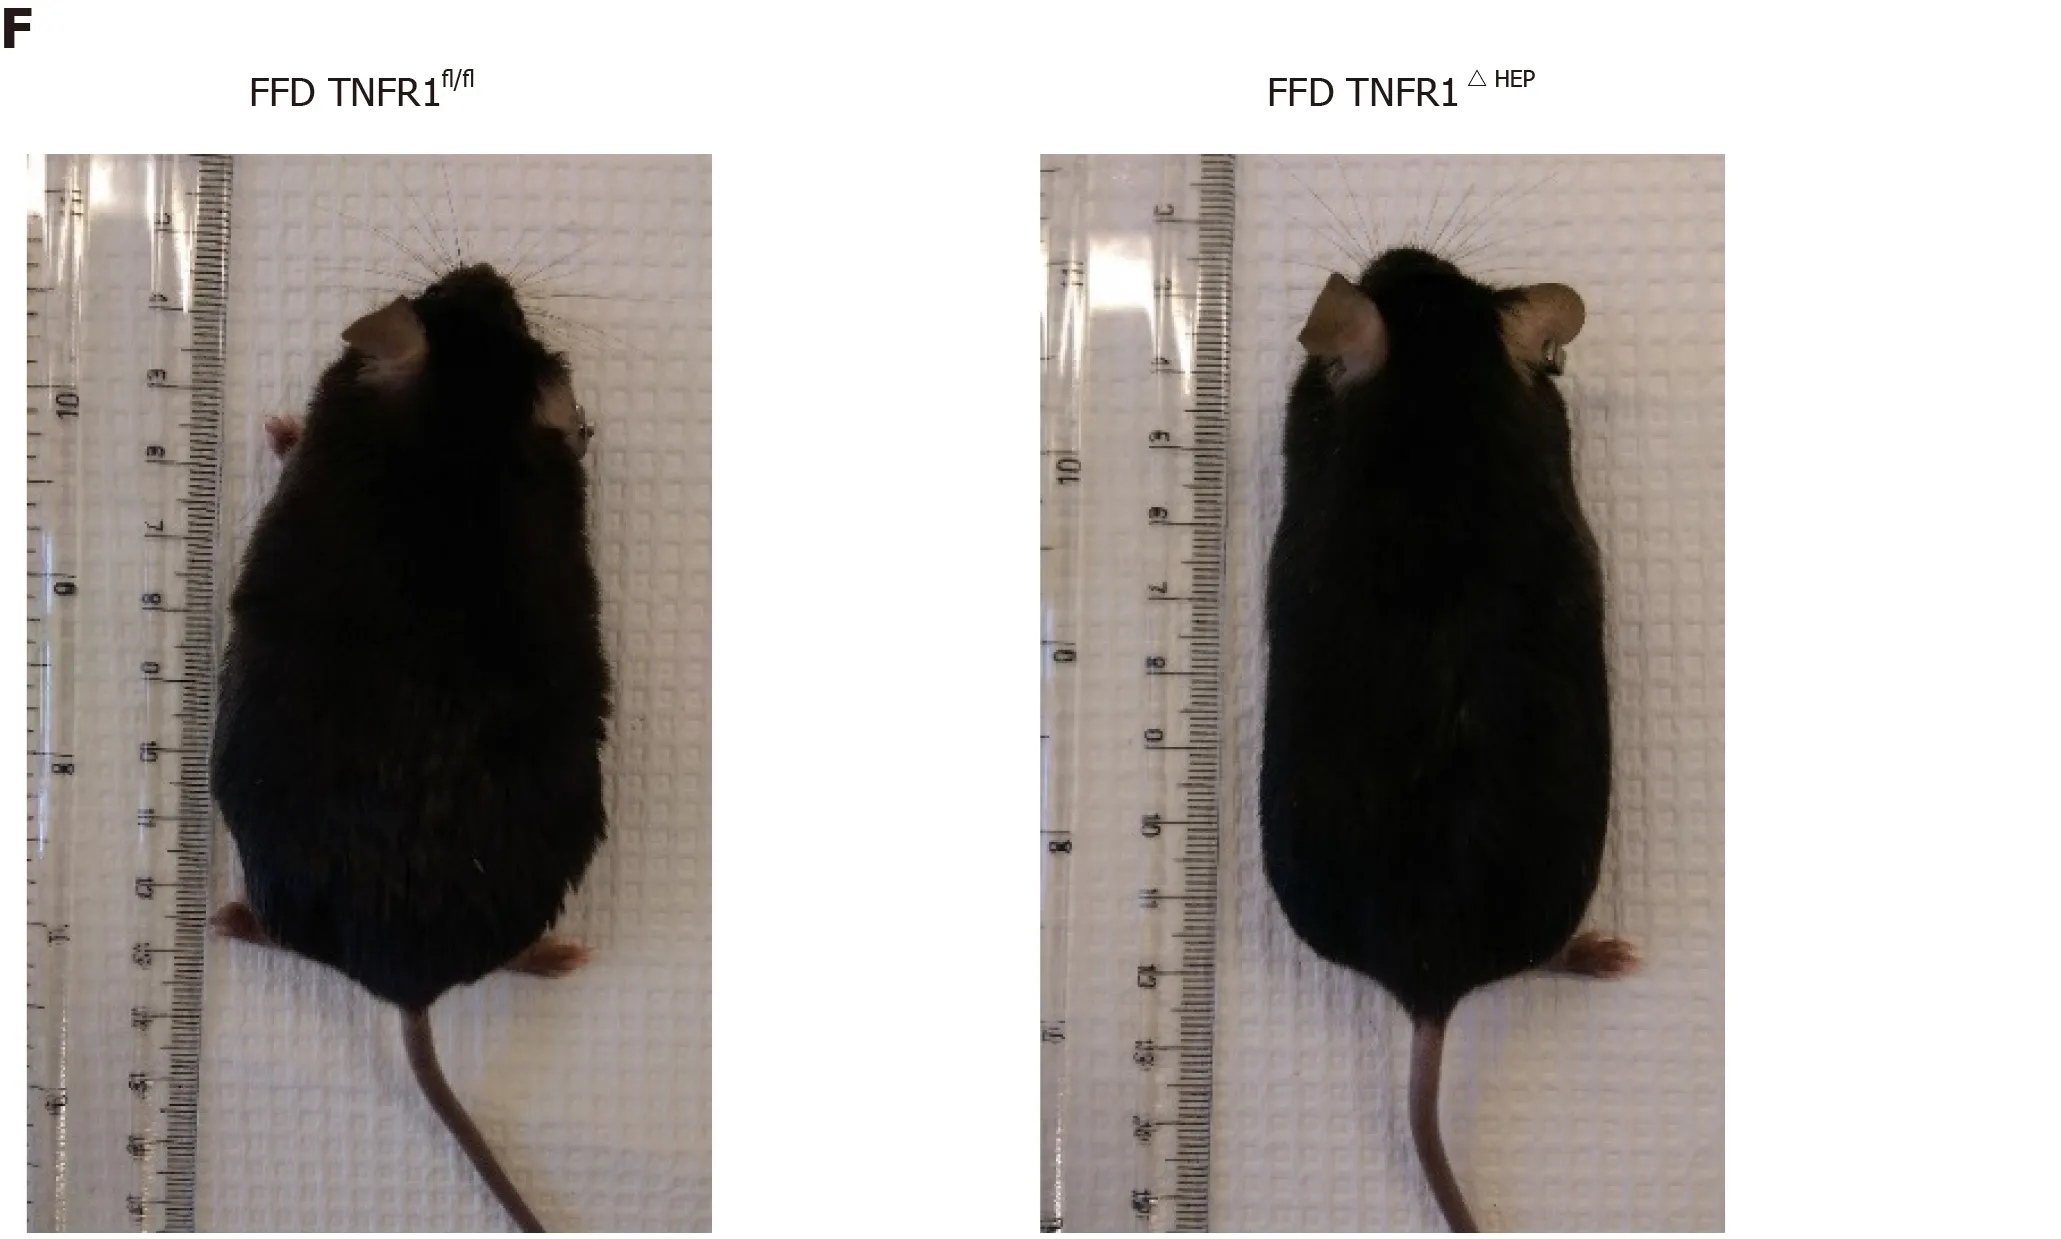
Figure 1 Effect of tumor necrosis factor alpha receptor 1 deficiency in hepatocytes on body weight. A: Tumor necrosis factor alpha receptor 1 (Tnfr1) expression in liver samples (n = 4-5); B: Food intake per group over the course of the experiment, given in kilocalories (Kcal) and normalized to the mouse weight; C: Body weight and relative weights of epididymal (D) and brown fat tissues (E) after 20 wk of feeding; F: Example appearance of mice with a knockout of TNFR1 in hepatocytes (TNFR1ΔHEP) and their TNFR1-expressing littermates (TNFR1fl/fl) after 20 wk of fast food diet (FFD). Numbers of biological replicates: Ctrl/TNFR1fl/fl n = 11; FFD/TNFR1fl/fl n = 23; Ctrl/TNFR1ΔHEP n = 12; FFD/TNFR1ΔHEP n = 24. Line shows mean + standard error of the mean. Significant differences are marked with (a) if P < 0.05. Ctrl: Standard chow.
DISCUSSION
The role of the TNF receptor 1 in hepatocytes for diet-induced NASH was investigated in mice with a hepatocyte-specific deficiency of TNFR1 (TNFR1ΔHEP). Obese mice with deficiency of TNFR1 in hepatocytes did not develop less liver disease than their TNFR1fl/fllittermates. However, TNFR1ΔHEPmice were protected from glucose intolerance and insulin resistance.
Previous studies, usingTnfr1whole-body knockout animals, concluded that TNFR1 signaling is a driver for NASH. Constitutional activation of TNFR1 in mice promoted the progression of NASH, but protected from insulin resistance[37], in contrast to our findings and studies showing the importance of TNFR1 signaling in diabetes development[38-40](discussed in more detail below). On the other hand, deficiency ofTnfr1was used to prove the contribution of TNFR1 signaling for downstream activation of STAT3 or the induction of ER stress both to promote NASH progression and HCC development[27,28]. In contrast to these studies, in our studyTnfr1was deleted in hepatocytes only. Kupffer cells are the primary source of hepatic TNF release[24]. Moreover, TNF acts on Kupffer cells in an autocrine manner[41]. Therefore, it can be speculated that the expected protective effect of hepatocyte-specific TNFR1 deficiency was reduced by increased TNFR1 signaling in Kupffer cells or recruited immune cells. These immune cells might have caused the release of different inflammation mediators, such as IL-1β or IL-6, which in turn resulted in activation of inflammatory pathways in hepatocytes that are independent from TNFR1 activation. This hypothesis is supported by a study that used mice with a whole-body knock out ofTnfr1and also found increased NASH features[30]. In this study by Lambertucciet al[30],Tnfr1deficiency resulted in increased numbers of both resident (i.e.Kupffer cells) and recruited macrophages into the liver, as well as up-regulation of IL-1β and IL-6 in the liver along with increased release into the plasma. IL-1β promotes alcoholic and nonalcoholic liver disease[42,43]. In the present study, we did not detect differences in IL-1β expression between obese mice with a hepatocyte-specific TNFR1 deficiency and their wild-type littermates.
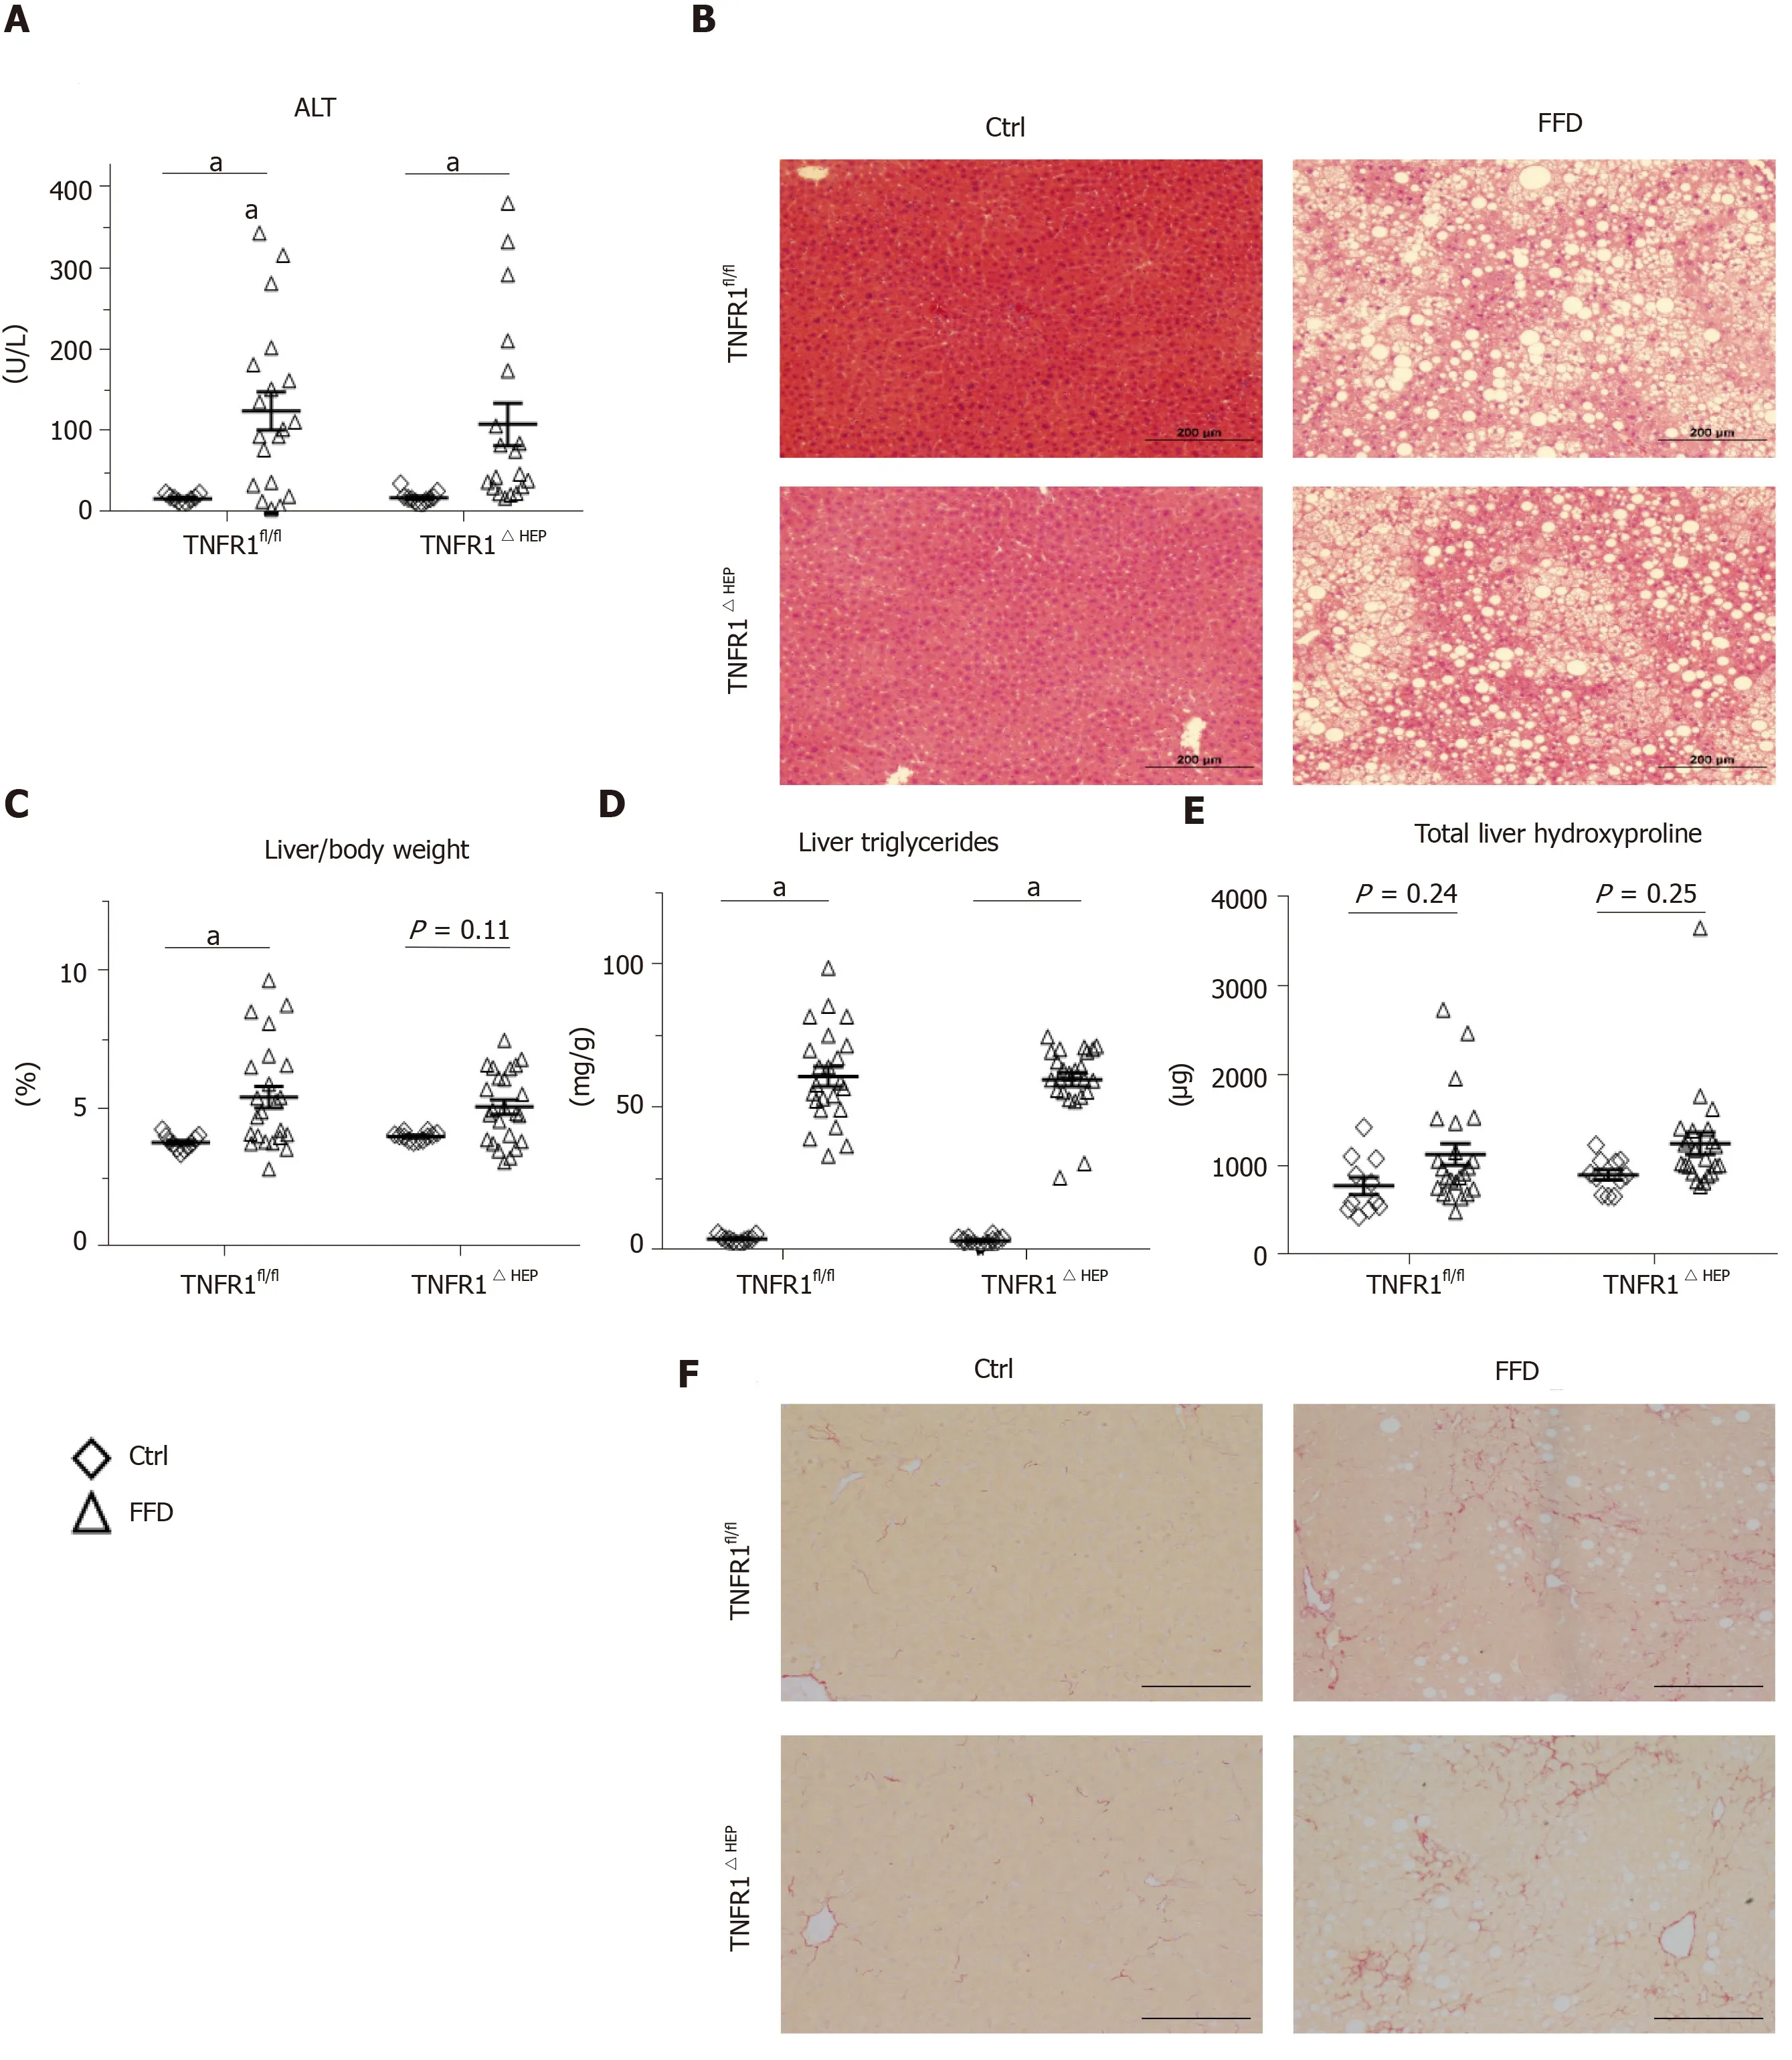
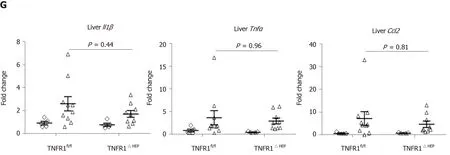
Figure 2 Effect of tumor necrosis factor alpha receptor 1 deficiency in hepatocytes on liver phenotype. A: Plasma levels of alanine amino transferase (ALT); B: Representative hematoxylin and eosin-stained liver sections; C: Relative liver weight; D: Relative amount of triglycerides normalized to liver weight. E: Total amount of hydroxyproline per liver; F: Representative Sirius Red-stained liver sections; G: Expression of the inflammatory genes interleukin 1-β (Il1-β), tumor necrosis factor alpha (Tnfα), and C-C motif chemokine ligand 2 (Ccl2). Scale bars: 200 µm. Number of biological replicates: Ctrl/tumor necrosis factor alpha receptor 1-expressing littermates (TNFR1fl/fl) n = 9-11; fast food diet (FFD)/TNFR1fl/fl n = 19-23; Ctrl/TNFR1ΔHEP n = 11-12; FFD/TNFR1ΔHEP n = 19-24. Line shows mean + standard error of the mean. Significant differences are marked with (a) if P < 0.05. Ctrl: Standard chow.
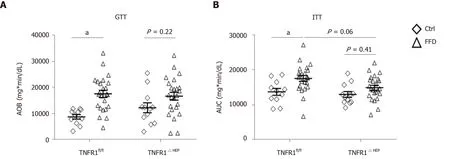
Figure 3 Effect of tumor necrosis factor alpha receptor 1 deficiency in hepatocytes on metabolic function. A: Glucose tolerance test performed after 18 wk of feeding; B: Insulin tolerance test performed after 19 wk of feeding. Numbers of biological replicates: Ctrl/tumor necrosis factor alpha receptor 1-expressing littermates (TNFR1fl/fl) n = 11; fast food diet (FFD)/TNFR1fl/fl n = 23-24; Ctrl/TNFR1ΔHEP n = 12; FFD/TNFR1ΔHEP n = 24. Line shows mean + standard error of the mean. Significant differences are marked with (a) if P < 0.05. Ctrl: Standard chow; GTT: Glucose tolerance test.
Another possible explanation for our finding might be an enhanced signal transductionviaTNFR2. TNFR2 is a mediator of systemic inflammation and enhances cytotoxicity of monocytes[44-46]. Reduced expression of adhesion molecules VCAM-1 and ICAM-1, which both facilitate leukocyte infiltration, was described in a doubleknockout model ofTnfr1andTnfr2, along with a reduction of hepatic steatosis and fibrosis[47]. However, a more prominent role of TNFR2 would have occurred in the whole-body knockout models as well. Higher serum level of soluble TNFR2 were detected in patients with HCC and hepatitis C[48]. The role of TNFR2 for NASH development is not conclusive, but it is thought to be protective[49].
The increase in hepatic triglyceride content in NAFLD is associated with hepatic insulin resistance[50]. This is mediated by the insulin receptor substrate IRS-2 and protein kinase-Cε. We did not detect a difference in hepatic triglycerides between obeseTnfr1deficient mice and theirTnfr1fl/fllittermates. However, compared to lean controls, onlyTnfr1fl/flmice had high blood glucose level after glucose and insulin challenge. Our observation that mice with a deficiency ofTnfr1in hepatocytes are protected from insulin resistance, strengthens previous findings ofTnfr1deficiency and improved insulin resistance[38,49]. TNF-mediated insulin resistance occursviaphosphorylation of the insulin receptor substrate IRS-1, which inhibits insulin-action in hepatocytes, and therefore promotes insulin resistance[39,40]. Phosphorylation of IRS-1 was reduced in mice with a whole-body deficiency ofTnfr1, thus enhancing insulinuptake into hepatocytes[38]. A similar mechanism occurs in brown adipose tissue and myocytes – alternative major sites of insulin action[51]. The effect seen in our study emphasizes the important role of hepatocytes for glucose homeostasis during obesity development.
Our findings were limited by the selective deficiency of TNFR1 in hepatocytes. As mentioned above, selective deficiency of TNFR1 in Kupffer cells might have clarified the cell type specific role for the pathogenesis of NASH. Another limitation was that we could only speculate about the compensating role of TNFR2. As TNFR2 signaling is expected to be protective, a selective manipulation of TNFR2 would be an interesting target for future studies. Furthermore, we could not investigate the mechanisms leading to insulin resistance in more details, because samples were not taken from starved animals, as usually done in metabolic studies.
In conclusion, our results do not indicate that loss of TNFR1 in hepatocytes can protect from diet-induced NASH. However, improved insulin resistance in this model confirms the important role of the liver for glucose homeostasis during obesity.
ARTICLE HIGHLIGHTS
杂志排行
World Journal of Gastroenterology的其它文章
- Resveratrol alleviates intestinal mucosal barrier dysfunction in dextran sulfate sodium-induced colitis mice by enhancing autophagy
- Acute liver failure and death predictors in patients with dengue-induced severe hepatitis
- Surveilling Russell body Helicobacter pylori-negative gastritis: A case report and review of literature
- Tumor microenvironment in primary liver tumors: A challenging role of natural killer cells
- Exploring the food-gut axis in immunotherapy response of cancer patients
- Liver fat accumulation measured by high-speed T2-corrected multi-echo magnetic resonance spectroscopy can predict risk of cholelithiasis
