Joint association analysis method to dissect complex genetic architecture of multiple genetically related traits
2020-10-21FengLinGuonQiTingXuXingyngLouYongoHongHimingXu
Feng Lin,Guon Qi,Ting Xu,Xingyng Lou,Yongo Hong*,Himing Xu,*
aInstitute of Crop Science,College of Agriculture and Biotechnology,Zhejiang University,Hangzhou 310058,Zhejiang,China
bDepartment of Mathematics,Zhejiang University,Hangzhou 310058,Zhejiang,China
cDepartment of Biostatistics,Colleges of PHHP and the College of Medicine,University of Florida,Gainesville,FL 32610,USA
dState Key Laboratory of Rice Biology and Zhejiang Key Laboratory of Super Rice Research,China National Rice Research Institute,Hangzhou 311401,Zhejiang,China
ABSTRACT
1.Introduction
Most complex syndromes,such as asthma,metabolic syndrome,coronary heart disease,type 2 diabetes,consists of a large number of highly related,rather than independent,clinical or molecular phenotypes[1].The prevalent viewpoint suggests that phenotypic correlation is ascribed to 3 resources:pleiotropy,linkage disequilibrium and shared environment.When one or several same genetic variants affect genetic variation of multiple related traits,the phenotypes of an individual will tend to be correlated,known as pleiotropy of gene effect.Similarly,linkage disequilibrium and shared environment effect also introduce some level of correlation between traits.Taking these correlations into account is essential to genetic dissection of complex traits.
Presently,the GWAS has been a routine way to explore complicate genetic architecture of quantitative traits;however,most GWAS to date have been conducted on each individual phenotype based on the single-locus additive association model.Less attention has been devoted to the fact that some surveyed phenotypes may be genetically correlated.Multiple studies have employed phenotypic data reduction methods to conduct association mapping;however,reduction methods will result in a considerable loss of power in detecting genetic variants[2–4].Joint analysis of multiple traits would increase power because intuitively,multiple trait measurements increase sample size relative to a single trait and exploit the covariances of other genetically related phenotypes;As a result,it will improve the ability to capture weak association signals which are most likely missed in separate analysis of trait.Hence,it is natural and imperative to develop new association analysis method for identifying genetic variants involved in genetic variation of multiple traits.
Given the importance of joint analysis of multiple traits,there is a long history of multi-trait models in quantitative genetics.MultiPhen[5]uses ordinal regression to regress SNP genotypes on a group of phenotypes,and applies one omnibus statistic to test whether all regression weights in the model are together significantly different from zero.Unlike other methods,TATES[6]uncovers not only the genetic variants shared with multiple phenotypes as well as phenotype specific variants.Multivariate linear mixed models(mvLMMs)are considered powerful tools for testing associations between SNPs and multiple correlated phenotypes.Korte et.al[7]extended the linear mixed-model approach to carry out GWAS of correlated phenotypes,deriving a fully parameterized multi-trait mixed model(MTMM)that considers both the within-trait and between-trait variance components simultaneously for multiple traits.Zhou and Stephens[8]proposed an efficient algorithm in the genomewide efficient mixed model association(GEMMA)software for fitting mvLMMs,which improve computing speed,power and P-value calibration compared with existing methods.GEEGMDR[9]is an effective multivariate method to detecting gene-gene(epistasis)and gene-environment(GE)interactions underlying multiple complex traits.
Moreover,all above mentioned multivariate methods achieve maximal power only in special circumstances and are based on simple additive model.It has been well documented that genetic variation of a quantitative trait is mostly controlled by a set of genes,which may function individually or jointly with additive or non-additive genetic effects[10,11].Non-additivity refers to interaction between alleles at same locus(dominance)or at different loci(epistasis),which has long been recognized fundamentally important to understand the structure and function of genetic pathways and the evolutionary dynamics of complex genetic system.Moreover,in contrast to Mendelian traits controlled by several major genes,the phenotypic variation of quantitative traits,also known as complex traits,depends not only on major genes but also many minor-effect alleles whose effects are sensitive to genetic,sexual,parent and environmental exposure[12].Thus,unravelling the causality of genetic variation and understanding the biological mechanism requires an analysis that jointly considers the genegene and gene-environment interactions.
In this study,we developed a joint association analysis method for mapping common or phenotype-specific genetic causal variants for multiple related traits.Our mapping model,incorporates epistasis and GE interactions,can better reflect underlying biological processes.The effectiveness of the method was simulated,and demonstrated by the analysis of four correlated blood lipid traits in Multi-Ethnic Study of Atherosclerosis(MESA)Cohort[13]and two yield-related traits in a rice immortalized F2dataset[14].Finally,a fast parallelization computing software package for the proposed method,QTXNetwork-MT,was developed by combining computation of GPU(graphics processing unit,a type of hardware implementation of parallel computation adapted in many scientific computations)with CPU(central processing unit)[15],which can be downloaded from http://ibi.zju.edu.cn/software.
2.Methods and materials
2.1.Statistical model
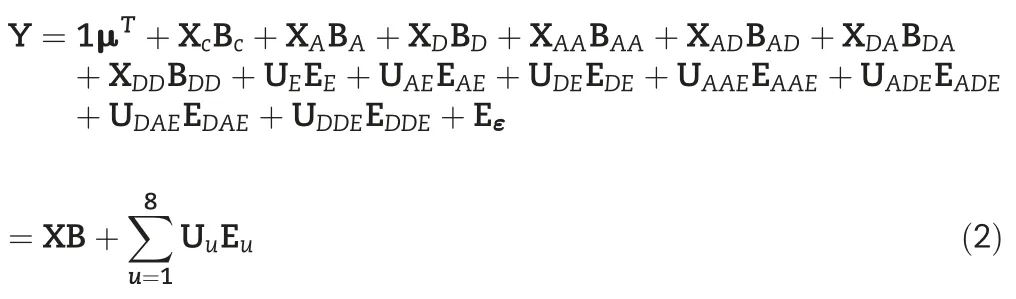
Considering a natural population consists of n individuals and the phenotypic performance of m correlated quantitative traits are measured in p different environments,the genetic variation of the traits are jointly controlled by s quantitative trait SNPs(QTSs)in which t pairs of QTSs are involved in epistatic interactions.A mixed linear model(MLM)for multiple traits association mapping can be established by extending the standard MLM for single trait as follows:
For all individuals,the model can be expressed in vectormatrix format as follows:

2.2.Mapping strategy
Since all QTSs associated with the surveyed traits are unknown,we first used one/two-dimensional genome-wide screening to detect the QTS with significant individual effects or epistatic effects,then all detected QTS were used to construct the QTS full model for estimation of genetic effects of all QTS.
One Dimensional Scanning:we conduct one dimensional whole genome scanning to search the significant loci using the following model

where,ailkand dilkare the additive and dominance effects of the tested SNP in the k-th environment,respectively,μikis the mean of the i-th trait in the k-th environment;all other parameters have the same definitions as those in the Eq.(1).
We also can express the above model in matrix and vector for all phenotypes as follows:

Two-dimensional Scanning:In order to search for all possible candidate epistasis,we do two-dimensional scanning.In the scanning procedure,we include the detected significant SNPs in the model as cofactors.The mapping strategy is the same as one dimensional scanning.If we detected s significant SNPs in one-dimensional scanning,we can use the following model to test the significance of epistasis for each pair of SNPs:
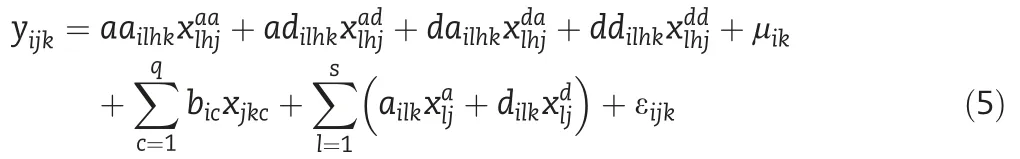
where,aailhk,adilhk,dailhk,and ddilhkare four epistatic effects(additive-additive,additive-dominance,dominance-additive and dominance-dominance effects)of the paired testing SNPs in the k-th environment for the i-th trait,respectively;all other parameters have same definitions as those in the model(1)and(3).The model(5)can also be expressed in matrixvector format for all phenotypes as the Eq.(4).Twodimensional scanning is conducted and the permutation testing is employed to determine the empirical threshold value of the Lambda statistic(Λ).All significant paired epistatic SNPs are distinguished.In order to remove the false positive QTSs,stepwise regression on all distinguished QTSs is performed,as a result,a QTS full model could be established based on all significant SNPs.
2.3.Genetic effect estimation
After obtaining the QTSs,the QTS full model could be constructed and then used to estimate all the parameters in the model(1).All the parameters in the model(1),as well as their standard errors and p-values of significance,were estimated based on the samples generated by the method of Markov chain Monte Carlo(MCMC)employing a conservative burn-in period of 20,000 cycles,a chain length of 200,000 and a thinning interval of 10 cycles and same prior distributions described by Yang et al.[16].We first generated a set of initial estimates of parameters including variances of random effects by the minimum norm quadric unbiased estimation(MINQUE)[17],the fixed effects by the ordinary least square estimation(OLSE)and the random effects by the adjusted unbiased prediction(AUP).And then these estimates are used as the prior values of parameters in the MCMC procedure for the mixed linear model implemented with Gibbs sampling.Parameter estimation and statistical inference are conducted based on the Gibbs samples[16,18,19].
2.4.Analysis of human data and rice data
2.4.1.Human data
A set of real data in Multi-Ethnic Study of Atherosclerosis(MESA)was downloaded from the dbGaP of NCBI and exemplified the method.MESA is a prospective populationbased study focusing on investigating the prevalence,correlations,and progression of subclinical cardiovascular diseases(CVD),which consists of 6814 men and women aged 45–84 years[13]from four ethnic groups,38% of the cohort are European-American,28% African-American,22%Hispanic-American,and 12% Asian,predominantly of Chinese descent.The phenotype and genotype data are available on the database of Genotypes and Phenotypes(dbGaP)through dbGaP accession number phs000209.v13.p3.
Single nucleotide polymorphisms(SNPs)were filtered according to the following criteria implemented by software PLINK[20]:(1)SNP call rate>95%;(2)subject call rate>95%;(3)Hardy Weinberg equilibrium P-value>1e-6;(4)polymorphic at least in one ethnic group(i.e.,no monomorphic SNP).After filtered,5018 individuals with 20,697 SNPs on the candidate genes of cardiovascular heart diseases were used to perform multi-trait association analysis.
2.4.2.Rice data
A rice immortalized F2(IF2)public dataset was downloaded from the website https://figshare.com/s/0773080c122d11e58b6306ec4bbcf141,which consists of 1619 markers and 278 samples[14].The traits were measured in two consecutive years.Here,the yield(Yield)and grain number per plant(Grain)traits were analyzed to illustrate our method.
3.Results
3.1.Simulation scenarios
To investigate the efficiency and accuracy of the proposed method,we performed a Monte Carlo simulation study on the unbiasedness and robustness of our model.One natural population consisting of 500 subjects was simulated in two environments.100 equi-frequent biallelic SNPs were evenly distributed on 5 chromosomes,7 of which were randomly selected as simulated genetic variants(hereafter named by QTS)for two traits,wherein,5 QTSs were shared with both traits and 2 is trait-specific.The correlated phenotypes of two traits were generated by adding genetic effects to the 7 QTS.The heritability of each trait which could be accounted for the QTSs was set to 15%and 20%,respectively.The true values of the QTS position and genetic effects were presented in Tables 1 and 2.Allowing for variation in the phenotypic correlation,we also set the residual correlation to 0.40 between two traits.In order to compare the joint analysis and separate analysis of two traits,we also performed the single trait association analysis with the same simulated data.Each simulation was repeated 1000 times.The power(%)for a QTS was calculated as the percentage of this true locus correctly detected in the total number of simulations.
3.2.Type one error rate and statistical power of detecting QTS
Simulation results are summarized in Tables 1,2,and Figs.1–3.Fig.1 presents the Quantile-quantile plot of significance level versus Type I error rate drawn from the 1000 simulations in assumption of no gene-gene interaction and no residual correlation.All empirical Type I error rates were close to the nominal level.The simulation results indicate that this new method had the correct Type I error rates for multiple traits,supporting the validity of the new approach under the null model.Fig.2 presents the power of each QTS and paired epistatic QTSs detected by the joint analysis method and/or the separate analysis method,respectively.In general,the new approach had a marked advantage in improving power over the separate analyses.Fig.3 shows that the pleiotropic QTSs(Q3,Q4,Q5,and EQ1)could be detected with higher power at any significant level by the joint analysis than by the separate analyses of individual traits;especially for Q5,which contributed opposite genetic component effects to two traits,the power was substantially increased when the joint analysis was employed(Table 1 and Fig.3).In contrast with Q5,the pleiotropic Q4 had the same direction of component effects in additive,dominance and their interaction with environment on the two traits,and its power was also increased to over 95%in the joint analysis,but only 62.6%and 81.4%in two separate analyses.For Q3 and EQ1(Q6–Q7),although they had the component effects on the trait 1 and 2 in the same and the different directions,respectively(Table 1),they could be detected consistently with higher power by the joint analysis;the power were 99.9% at the significance level of 0.01 for Q3 and 94.5% at the significance level of 1×10⁻¹⁰for EQ1 in the joint analysis,but the counterparts were only 75.1%and 92.1%for Q3 and 74% and 85.8% for EQ1 in the individual analyses,respectively(Fig.3).On the other hand,for the trait-specific QTSs(Q1,Q2),although the separate analyses performed more efficiently than the joint analysis since the relatively simple model was employed in the analysis of individual trait,the loss of power in detecting trait-specific QTSs was minor when the joint analysis was applied and totally acceptable if the multiple testing issue in individual analyses was considered(Fig.3).These results suggested the proposed new method based on the joint analysis of multiple traits could effectively improve the detection of pleiotropic genes but might have an ignorable loss in power when the traits surveyed are genetically independent.
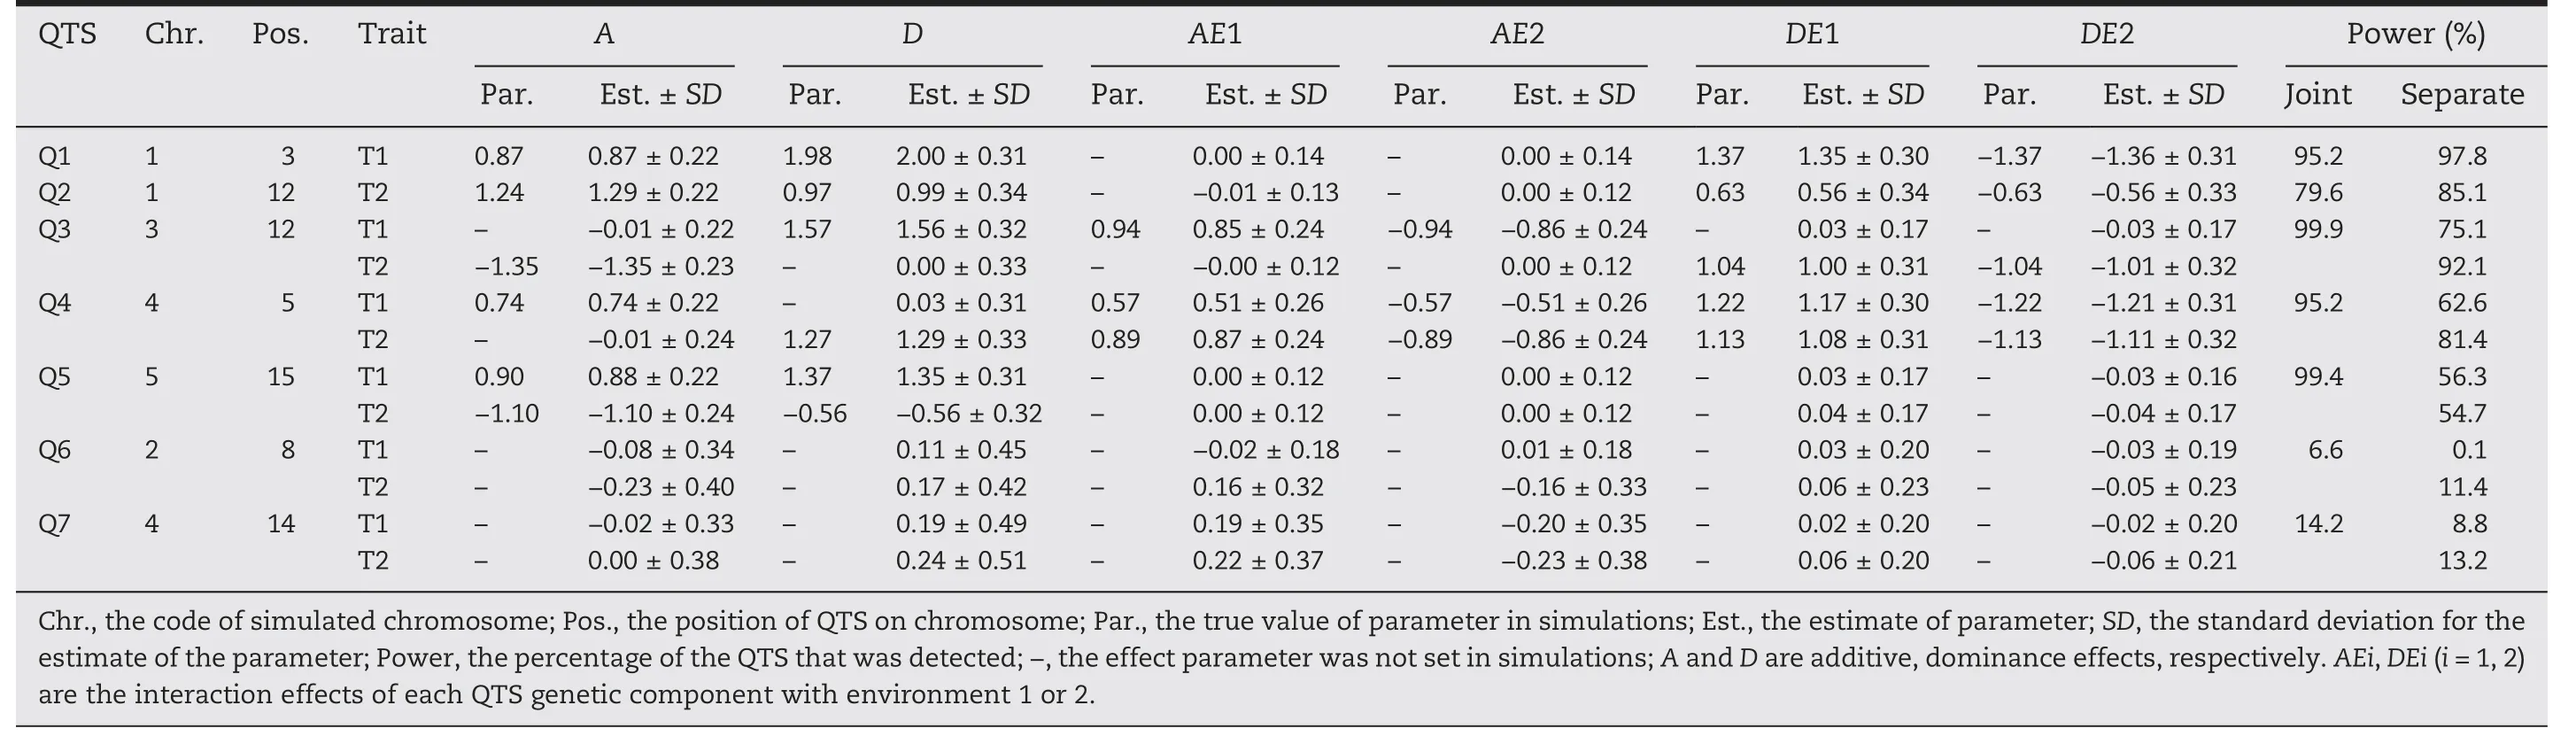
Table 1–Mapping powers and estim ates of QTS m ain effects and their interaction effects with environments for two simulated traits(T1 and T2).
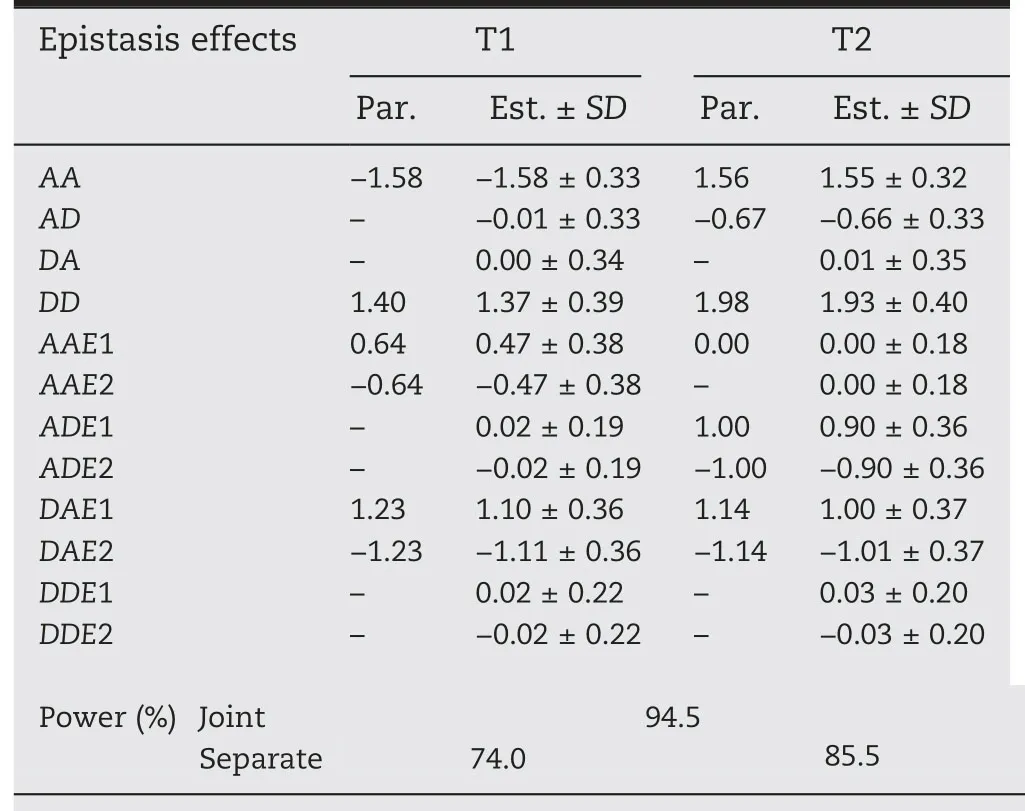
Table 2–Mapping powers and estimates of epistasis QTS(EQ1)main effects and their interaction effects with environments for two simulated traits(T1 and T2).
3.3.Estimation of QTS effects
Tables 1 and 2 showed that both types of QTS,main effectonly QTSs(Q1,Q2,Q3,Q4,Q5)and epistatic QTSs EQ1(Q6-Q7)had bias(the difference between the estimated and the true value of parameter)of less than 5%of the true value for each of genetic main effects(A,D,AA,AD,DA,and DD),indicating that the genetic main effects could be unbiasedly estimated by our method.As for the components effects of gene by environment interaction,a small but acceptable bias would occasionally occur for some QTSs,such as Q2 with estimates of 0.56/-0.56 for the true DE effect of 0.63/-0.63,Q3 with estimates of 0.85/-0.86 for true AE of 0.94/-0.94,and Q4 with estimates of 0.51/-0.51 for true AE of 0.57/-0.57(Table 1),respectively;compared with the additive/dominance by environment interaction,relatively lager bias could be observed on the estimates of epistasis-environment interaction effects,such as the AAE,ADE and DAE of EQ1(Table 2).In general,the QTS effects could be unbiasedly or well estimated by our mixed linear model-based method.
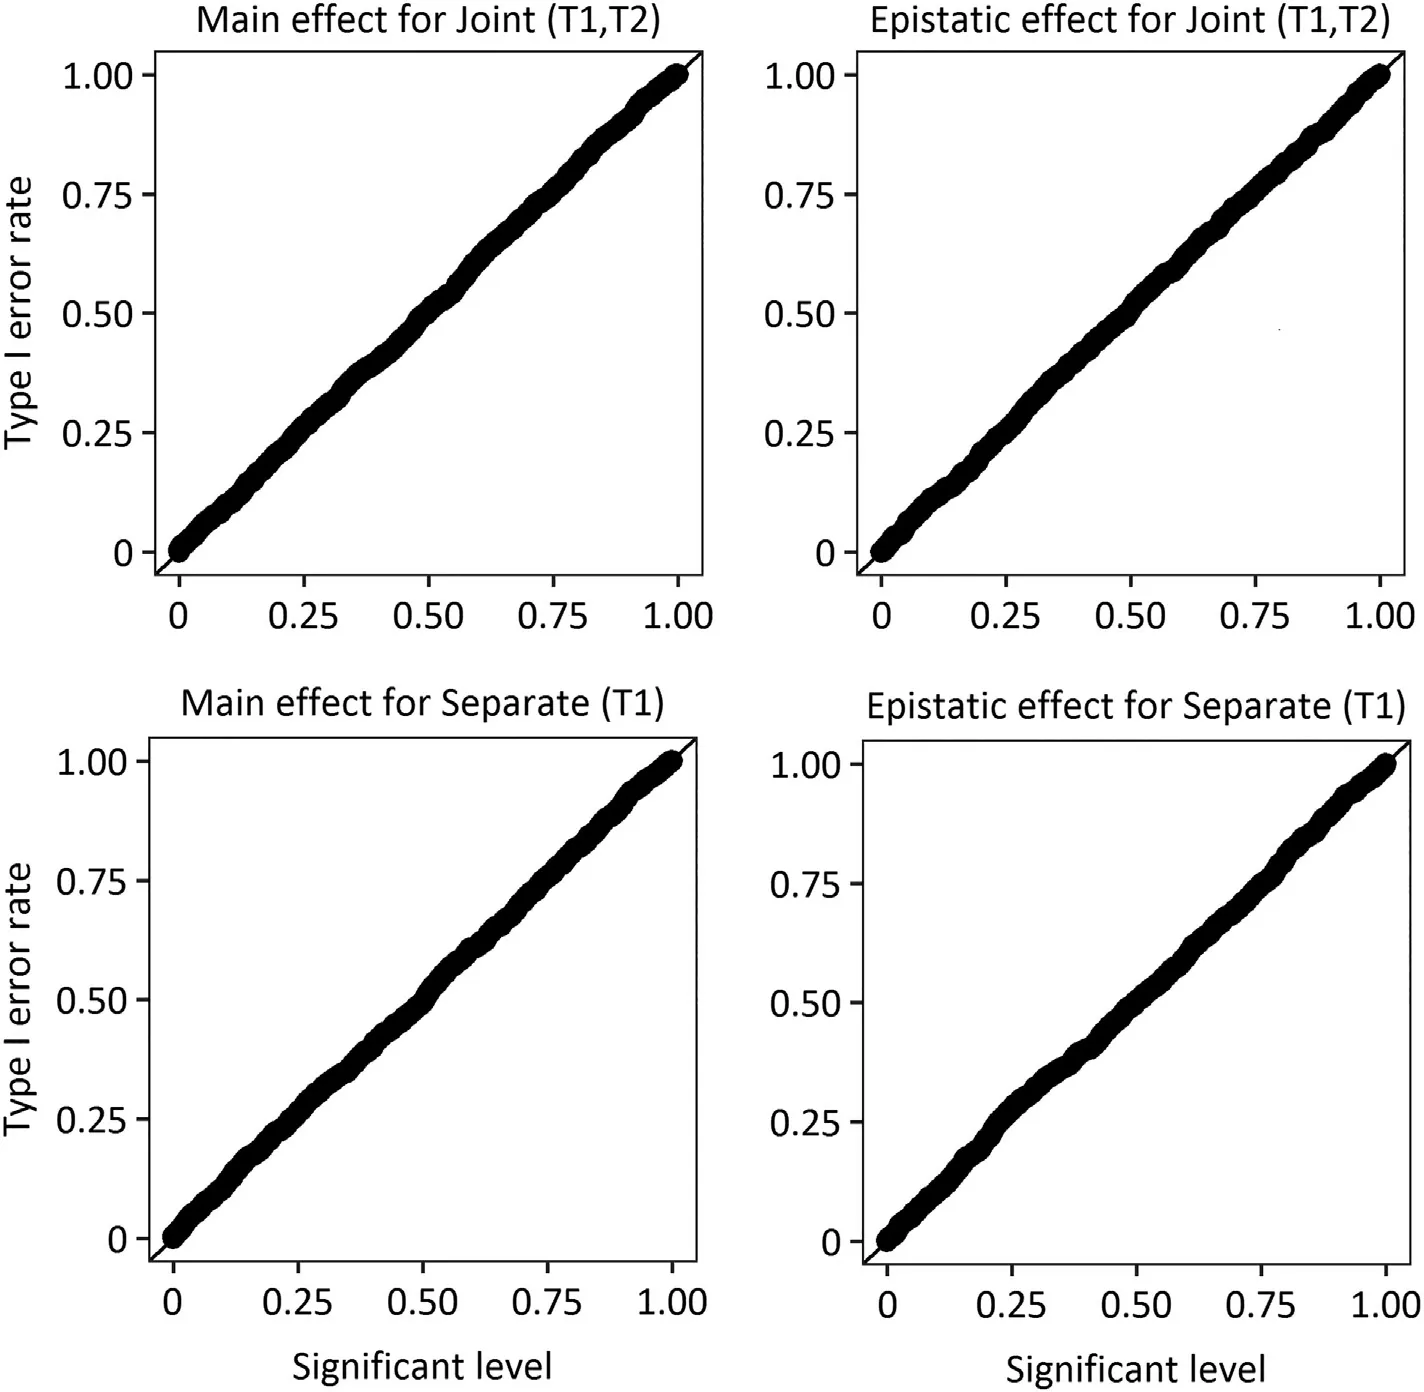
Fig.1–Quantile-quantile plot of significance level and type I error rate for joint and separate analysis.The type I error rate for main effect and epistatic effect is evaluated by Joint(T1,T2)and Separate(T1)in assumption of no gene-gene interaction and no residual correlation.Joint(T1,T2),the joint analysis of trait 1 and trait 2;Separate(T1),the separate analysis of trait.
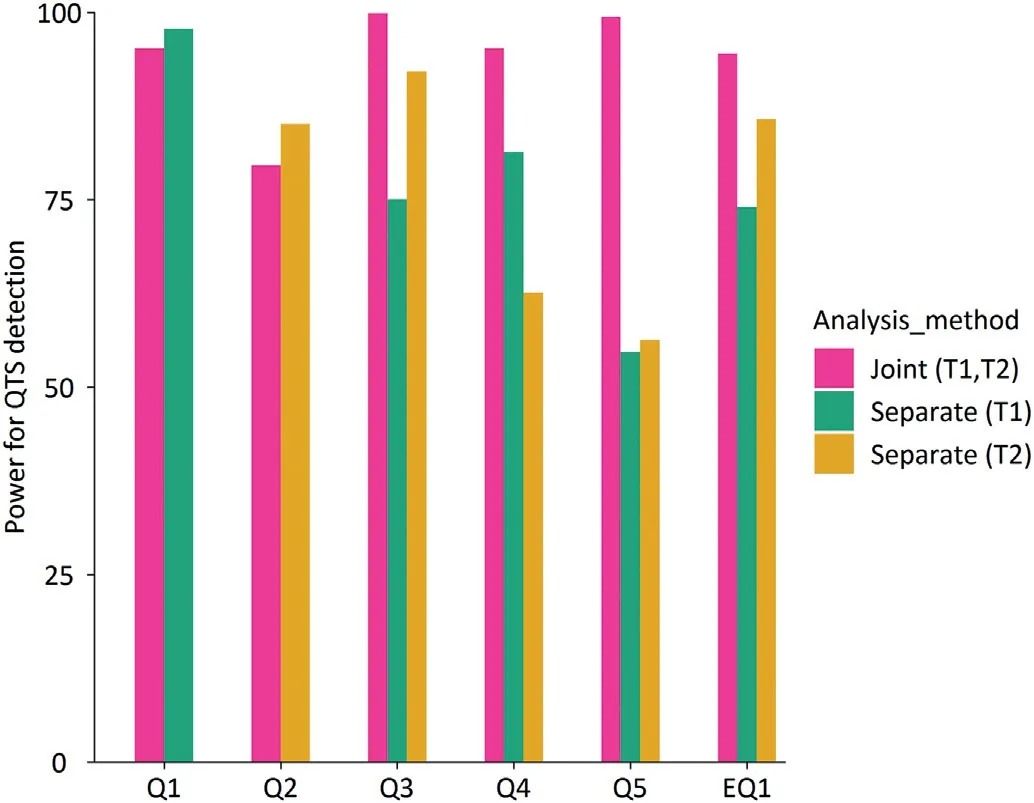
Fig.2–Statistical power at the significance level of 0.05.Separate(T1)and Separate(T2),the separate analysis of trait 1 and trait 2,respectively;Joint(T1,T2),the joint analysis of trait 1 and trait 2;Q1 and Q2,trait-specific QTSs,Q1 for trait 1,Q2 for trait 2;Q3,Q4,and Q5,pleiotropic main effect-only QTSs for trait 1 and trait 2;and EQ1 pleiotropic epistatic QTSs(Q6 and Q7)for trait 1 and trait 2.
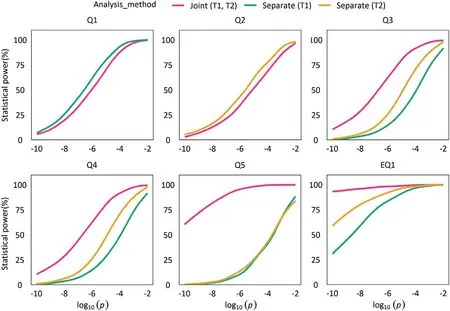
Fig.3–Statistical powers for all the simulated main effect-only QTSs and epistatic QTSs at various significance levels.Separate(T1)and Separate(T2),the separate analysis of trait 1 and trait 2,respectively;Joint(T1,T2),the joint analysis of trait 1 and trait 2;Q1 and Q2,trait-specific QTS,Q1 for trait 1,Q2 for trait 2;Q3,Q4,and Q5,pleiotropic main effect-only QTSs for trait 1 and trait 2;EQ1 pleiotropic epistatic QTSs(Q6 and Q7)for trait 1 and trait 2.
3.4.Application to two genetic studies
3.4.1.Human data
To validate the effectiveness of the joint association mapping of multiple traits in dissection of complicated genetic architecture of complex traits,the new method was used to analyze four blood metabolites-related traits which are crucial clinic phenotypes of human cardiovascular heart disease[21],namely triglyceride(TG),low density protein(LDL),high density protein(HDL),and total cholesterol(TC).The genotype and phenotype data were collected from the Multi-Ethnic Study of Atherosclerosis(MESA)Cohort(see Methods for details)and downloaded from the dbGaP of NCBI.Covariance analysis was performed based on a mixed linear model with race as covariate,the results clearly showed there were significant genetic correlations between the four traits(Table 3).TC had a strong positive genetic correlation with other three traits,and the genetic correlation with HDL was the highest with a correlation coefficient of 0.90.HDL had a significant middle negative genetic correlation with TG(-0.40)and a significant but relatively small negative correlation with LDL(-0.05).
We applied our methods to conduct the joint and the separate association analyses of four traits,respectively,the results are shown in Tables 4 and 5.Four main effect-only QTSs(rs3740767,rs10750097,rs1800588,and rs4775041)and one pair of epistatic QTSs(rs3799481–rs13254175)were detected to have significant association with the traits only by our new method but not by the separate analysis of individual traits(Table 4 and Fig.4A).Interestingly,rs3740767 is a variant which has been reported in the previous study on peripheral arterial disease[22];rs596985,rs2494283,rs301,rs5072,rs12679834,rs12287066,and rs3799481 were detected only by the single trait analysis,wherein,the first five QTSs were all associated with TG and the last two QTSs associated with HDL;rs12740374,rs13702,rs2266788,rs3764261 and rs7499892 were detected by both the joint or the separate analysis of four traits;generally,the joint analysis could identify more significant loci than the separate analysis,for example,the separate analysis method detected only 5,1,1,and 6 QTSs for HDL,LDL,TC,and TG,respectively,but accordingly,8,5,6,and 7 QTSs by the joint analysis(Fig.4C–F).Compared with the single-trait association analysis in ability to explore a complicated genetic architecture of complex traits,the multi-traits association analysis could provide more insights into gene pleiotropy and molecular mechanism of genetic dependency of related traits;forexample,the joint analysis revealed that rs3740767,rs3764261 and the paired epistatic QTSs rs3799481–rs13254175 are pleiotropic variants,they contributed genetic effects to all the four phenotypes of human peripheral arterial disease(Tables 4 and 5;Fig.4B),of which rs3764261 mainly took additive genetic effect on four traits,while rs3740767 mainly affected the traits via additive,dominance and additive-race interaction effects,and rs3799481–rs13254175 had epistatic effects and their interaction with races,but no genetic effects of individual locus.
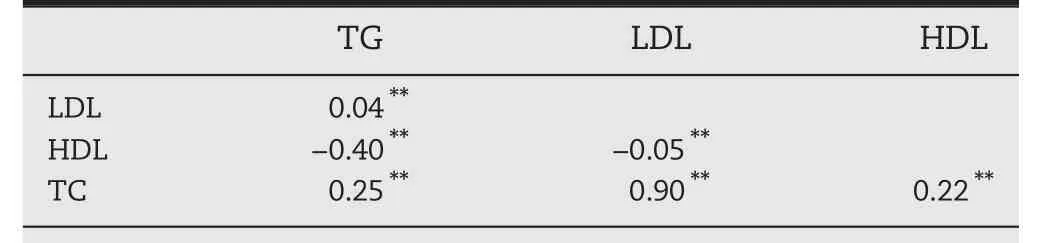
Table 3–Genetic correlations between four CVD_related traits.
To understand regulation patterns and intensity of the detected significant QTSs for the four traits,we also estimated the main effects,gene-by-race interaction effects as well as epistatic effects(Tables 4 and 5).Overall,16 QTSs mostly had additive effects and interaction effects with races,and one pair of epistatic QTSs were detected by the joint analysis and separate analysis.It is noteworthy that rs12740374 on chromosome 1 was detected both in the joint and the separate analyses of TC and LDL,which compared with the other detected QTSs accounted for the largest phenotypic variation for TC and LDL,2.50% and 4.15% in the joint analysis and 3.11% and 5.38% in the separate analysis,respectively.Some QTSs(rs12740374,rs3740767)exhibited additive,dominance effects combined with additive,dominance by races interaction effects,while some QTSs(rs13702)had genetic main effects regardless of races,which indicates the QTSs are not sensitive to races.For examples,rs13702 on chromosome 8,for TG and HDL,only contributed additive effects of 10.73 and-1.73,respectively.In addition,some QTSs only took effects through interaction with race,which implies that theirexpression is affected by race,like rs7499892 on chromosome 16 for LDL,TC in the joint analysis expressed only in Hispanic with race-specific dominance effects of-2.75 and-3.06 respectively.Hence,we should pay attention on the difference of gene expression across races.Moreover,the joint analysis also detected one pair of epistatic QTSs rs3799481–rs13254175 on chromosomes 6 and 8,respectively,accounting for a relatively larger proportion(3.44% and 4.10%)of phenotypic variation for TG and HDL,respectively;notably,the epistasis took opposite effects on TG and HDL in the detected genetic components.rs13702 and rs2266788 had additive effects of 10.73,-19.49 on TG and of-1.73 and 1.00 on HDL respectively,which was in accordance with their negative correlation of-0.40(Table 3).
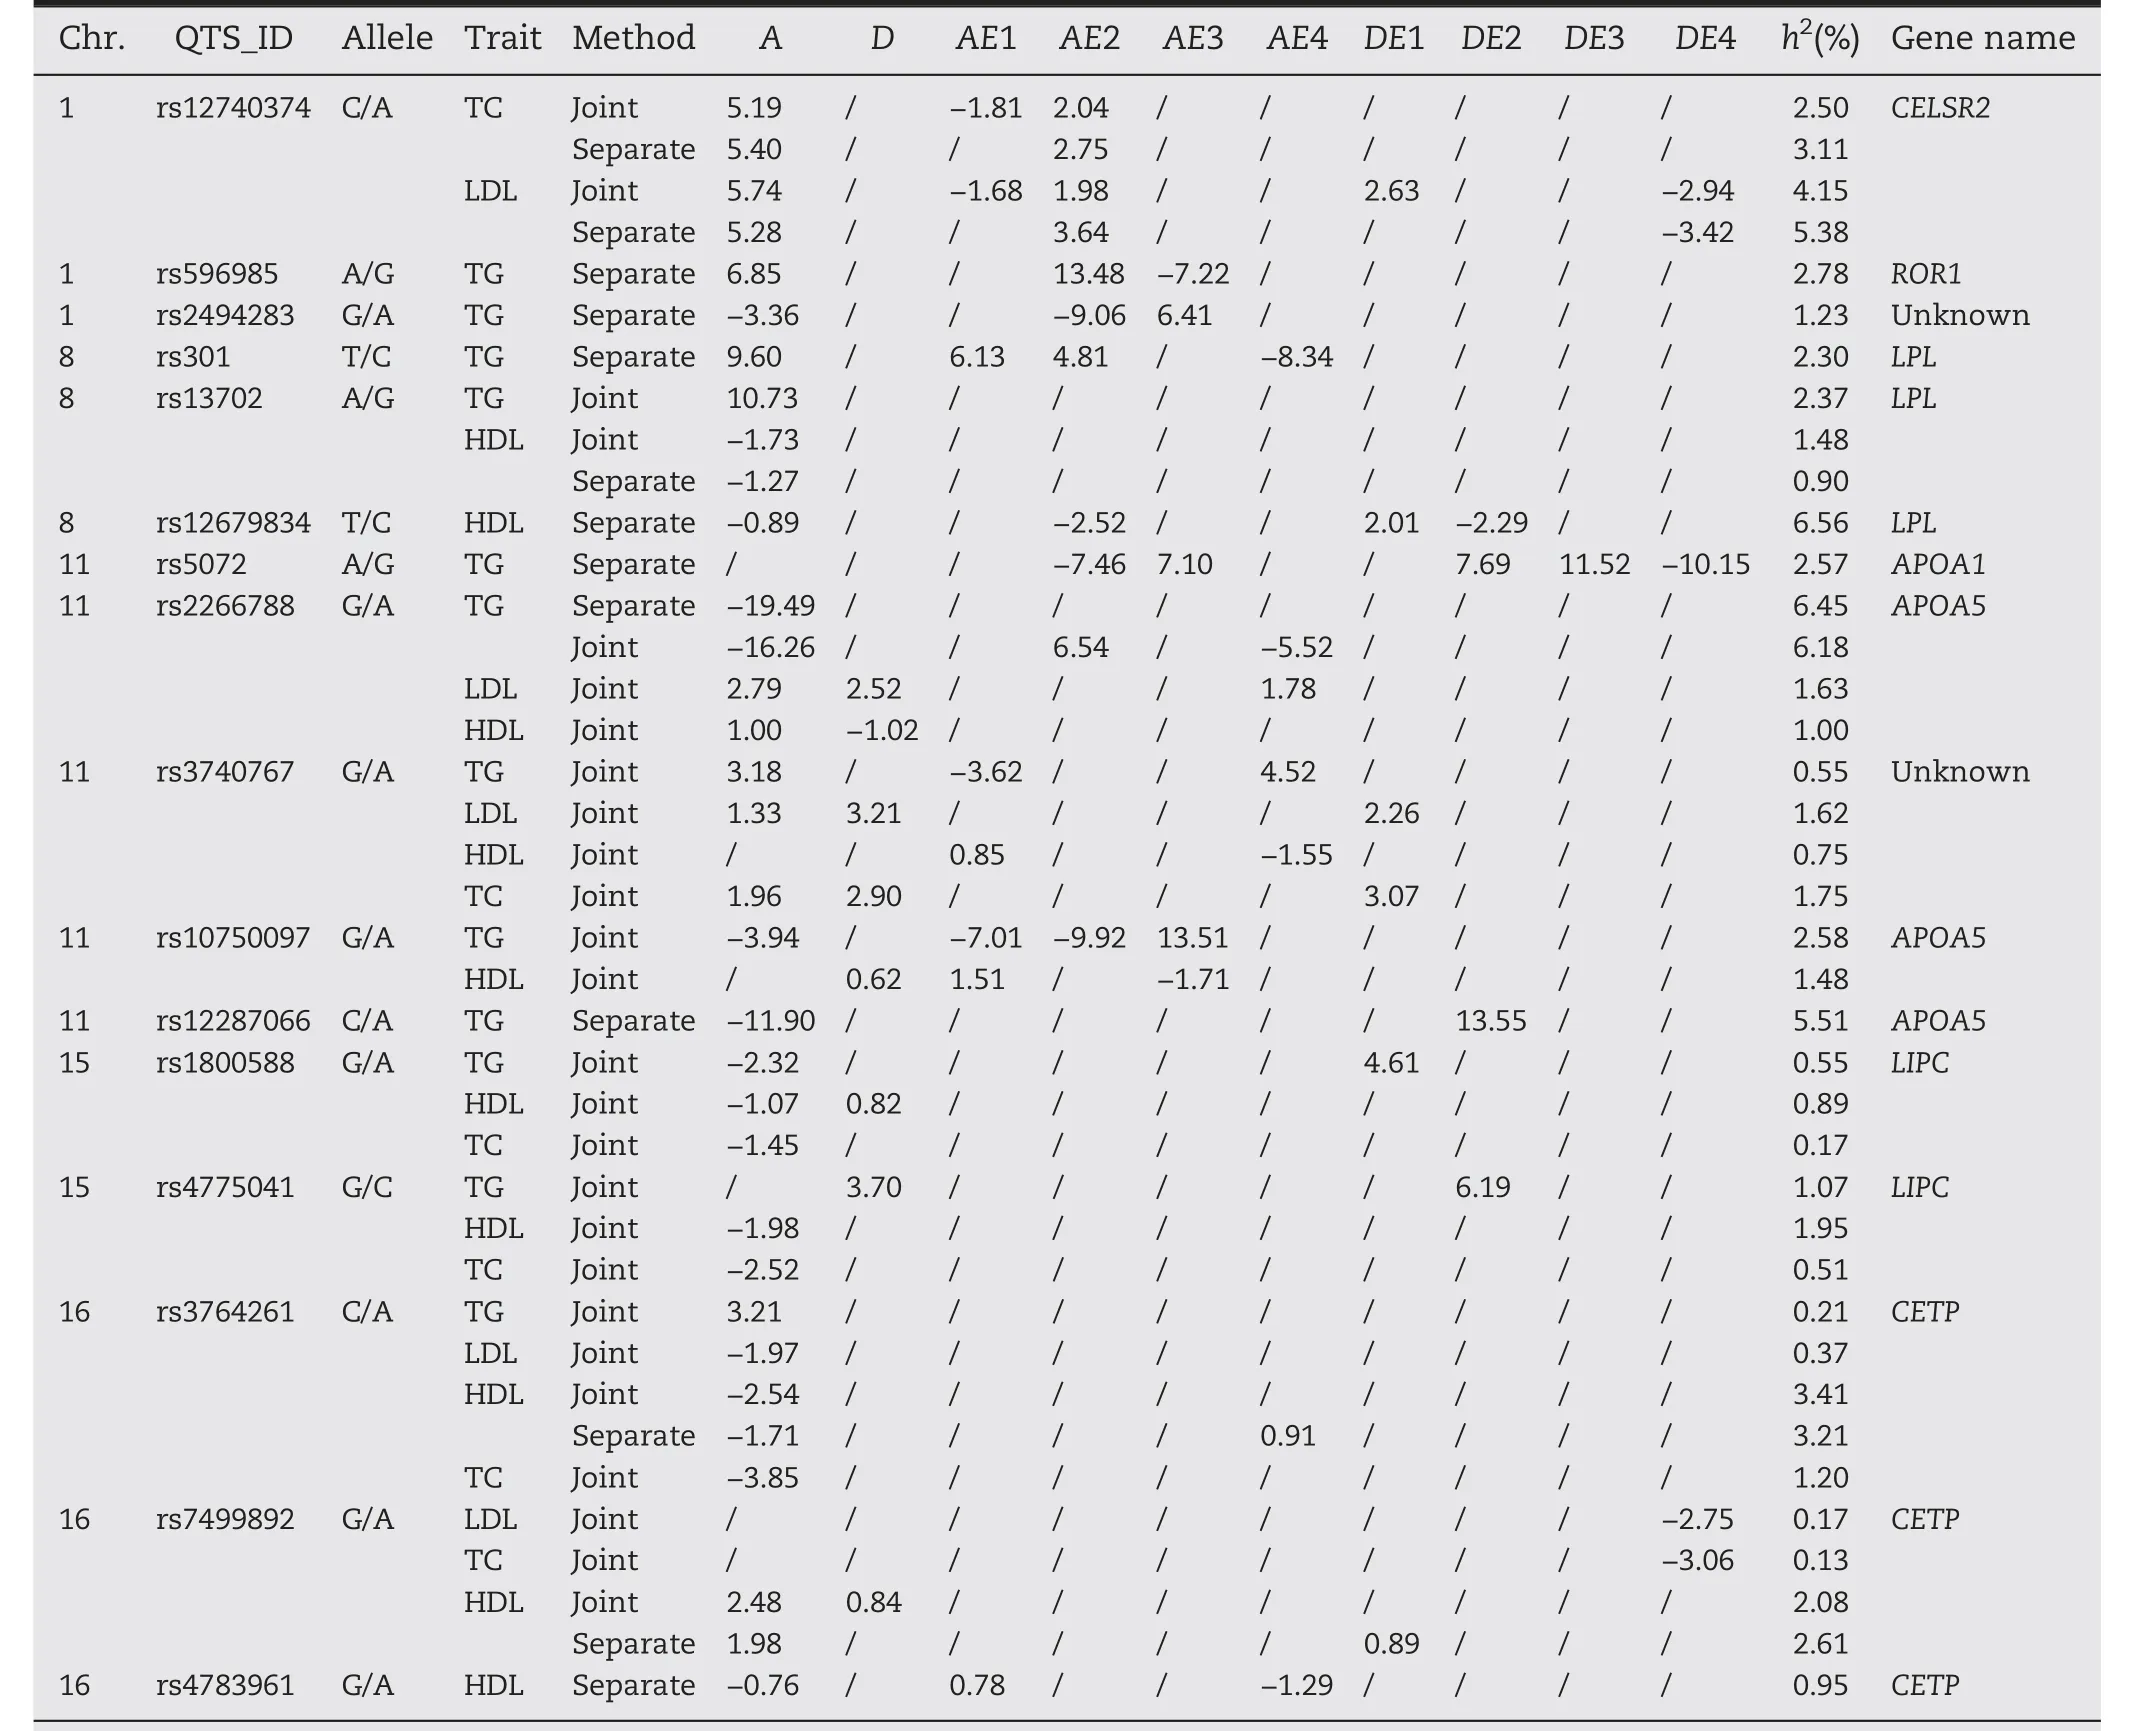
Table 4–The detected significant QTSs and their effects by joint and separate analysis of four coronary heart disease related traits.
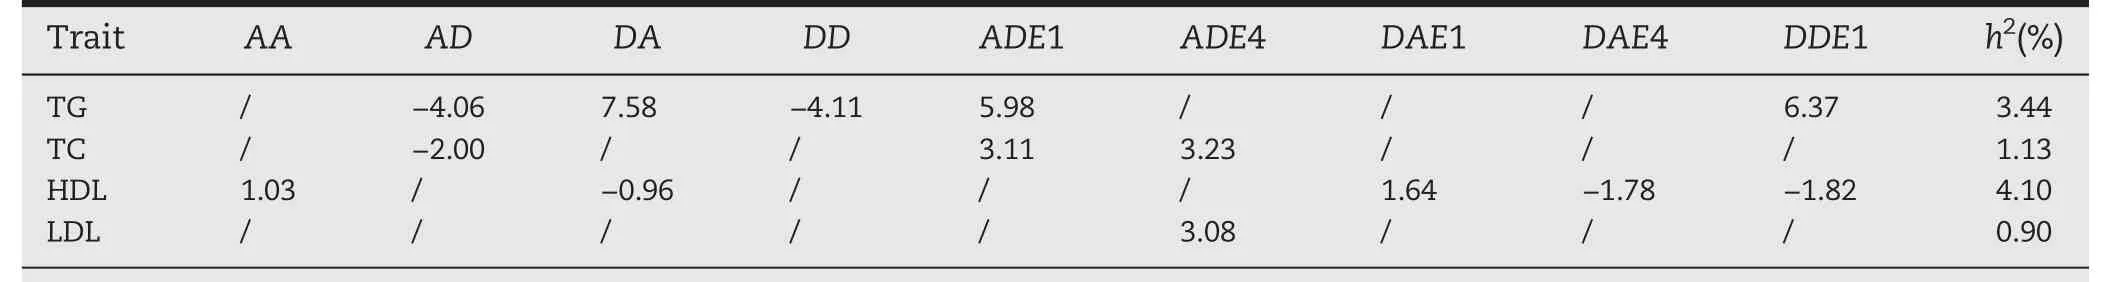
Table 5–The detected paired QTSs with significant epistasis and the estimated effects by joint analyses of four coronary heart disease related traits.

Fig.4–Venn diagram for the detected significant QTSs from joint analysis and separate analysis of four CVD traits.TG,triglyceride;TC,total cholesterol;LDL,low density lipoprotein;HDL,high density lipoprotein;TC+TG+LDL+HDL(Joint),TC(Joint),TG(Joint),HDL(Joint),LDL(Joint)indicate joint analysis of four traits;TC,TG,LDL,HDL indicate separate analysis of each trait;the number in non-overlapping area is the number of QTSs which could only be detected by one analysis method,in contrast,the number in overlapping area is the number of QTSs which could be detected by multiple analysis methods.
Almost all of the detected QTSs are located in the annotated genes related with CVD traits,which demonstrates the effectiveness of our method.Totally,16 QTSs were identified in the regions of the nine annotated genes,which are CELSR2,ROR1,LPL,APOA1,APOA5,LIPC,CETP,PEX7,MSRA,respectively.QTS rs12740374 on chromosome 1 is located in noncoding region of gene CELSR2,as the causal gene at the 1p13 locus for LDL[23].rs301,rs13702,rs12679834 are located in the lipoprotein lipase(LPL)locus on chromosome 8 which encodes a crucial enzyme in lipoprotein metabolism whose function partially determines concentrations of circulating TG and HDL.Moreover,the LPL 30 UTR rs13702 has been identified to induce an allele-specific interaction with miR-410,a regulator of LPL in human[24].APOA1 encodes apolipoprotein A-I,which is the major protein component of high density lipoprotein(HDL)in plasma[25].The gene APOA5 encodes an apolipoprotein,a component of HDL that plays an important role in regulating TG,a major risk factor for coronary artery disease[26].The gene LIPC was not detected in the separate analysis,but showed highly significant association in joint analysis.The LIPC located on chromosome 15q22,has both triglyceride lipase and phospholipase activities and is involved in different processes of lipoprotein metabolism[27].CETP is a hydro-phobic glycoprotein which plays a major role in RCT(Reverse Cholesterol Transport)from tissues to the liver.By enabling transfer of cholesteryl esters from HDL to LDL,CETP enables remodeling of plasma lipoprotein[28].Generally,almost all of the identified genes are directly or indirectly involved in regulating the CVD traits.These findings provide greater insights into the genetic regulation and gene interactions in metabolic pathways of CVD traits.
3.4.2.Rice data
We applied our method to conduct the joint and the separate association analyses of Yield and Grain traits,respectively,the results were summarized in Tables S1 and S2.Two QTSs(BIN3,BIN1098)and one pair of epistatic QTSs(BIN189–BIN278)were detected to take significant genetic main effects on the traits only by the joint analysis not by the separate analysis of two traits.Almost all QTSs and epistatic QTSs of Yield or Grain which were detected by the separate analysis could also be detected by the joint analysis.Furthermore,the joint analysis revealed that BIN50,BIN436,BIN875,BIN1004,BIN1057,BIN1098 and the paired epistatic QTSs BIN189–BIN278 are pleiotropic variants,of which BIN875,BIN1004,BIN1057 were also found to be pleiotropic by the separate analysis.
In terms of genetic effects,the detected QTSs except BIN1004 and BIN1057 took only genetic main effects in additive or dominance on two traits.In total,only two pairs of epistatic QTS(BIN189–BIN278,Bin594–Bin1468)were detected and contribute only epistasis main effects to Yield or Grain,wherein,the pair of BIN189 and BIN278 effect both on Yield and Grain,but the pair of Bin594 and Bin1468 only on Grain.Two QTSs(BIN1004,BIN1057)exhibited additive-year interaction effects,which indicates their expressions are sensitive to the environment,for example,BIN1004 could increase additive effect of 1.21 in the first environment but reduce 1.22 in the second year on the Yield according to the joint analyses.The pleiotropic epistatic QTSs BIN189–BIN278 accounted for a relatively larger proportion(19.05% and 10.05%)of phenotypic variation for Yield and Grain,respectively.
4.Discussion
Most human diseases such as diabetes,hypertension and obesity,are usually measured by several clinic traits between which there are some certain genetic correlation;on the other hand,same human disease symptom may arise from several pathogenesis etiology connected with different causal phenotypes.Further,ever-growing evidence has pointed to the view that gene by environment interactions are also important genetic buffer of phenotypic variations[29–31].Evidently,it is very imperative to take into account of these complicate genetic features in GWAS of multiple traits.This study proposed a new genome-wide association analysis method for joint analysis of multiple quantitative traits,which is built on a multivariate mixed linear model with inclusion of each genetic component effects of all QTSs,paired interacting QTSs and their interaction with environment,and the covariance information between traits is exploited in testing effect of QTS.Extensive simulation showed that the new method outperforms the separate analysis of individual traits not only in identifying more minor-effect genes as well as in revealing pleiotropic genes and molecular mechanism of complicate genetic correlation of traits.In addition,the new method can provide unbiased estimates of almost all kinds of genetic component effects of single gene and paired epistatic genes,although the simulation study observed a little bit over or lower estimates for very fewer interaction components effects of single or paired epistatic genes with environments.Thus,the proposed multi-traits GWAS method provides an effective solution to dissect complicate genetic architecture of a group of genetically correlated phenotypes.

The application of the proposed approach to the MEAS data revealed that the seven detected pleiotropic genes CELSR2,LPL,APOA5,LIPC,CETP,PEX7,MSRA take different effects on the four human blood metabolites-related traits,most of which have been reported in the previous GWAS studies involved in human blood metabolites-related traits except for PEX7 and MSRA.PEX7 has been reported involved in many metabolic processes such as fatty acid oxidation,biosynthesis of ether lipids and free radical detoxification,and the function of MSRA is to repair oxidative damage to proteins by enzymatic reduction of methionine sulfoxide,associated with waist circumference.Hence,the paired epistatic genes PEX7 and MSRA may be involved in a same fatty acid metabolic pathway to regulate the four human blood metabolites-related traits,thus controlling the obesity[33].The QTS rs3740767,a pleiotropy locus of all the four traits,was only reported to be associated with peripheral arterial disease which is caused by the disorders of the blood lipid traits.Thus,it is biologically plausible for variant rs3740767 to be involved in regulating the blood lipid traits and thereby involved in peripheral arterial disease.Compared with the separate analysis of each trait,the multi-traits analysis detected more minor heritability QTSs,like rs1800588,the heritabilities for TG,HDL,and TC were respectively 0.55,0.89,and 0.17,which may make a contribution to unveiling the problem of“missing heritability”.
Our method provides a new approach of association analysis for dissecting complex genetic architecture of a group of correlated traits.However,what is the best strategy to analyze a set of data with multiple traits depends on the molecular mechanism of genetic correlation of surveyed traits.If a variant is of trait-specific,then the separate analysis on the trait will generally be more powerful to detect.On the other hand,if a variant affects multiple traits,then the joint analysis of all traits will be more powerful.Hence,the joint and the separate association analysis of multiple traits are not exclusive but complementary to each other in GWAS.In addition,it should be noted that the Wilks’Lambda statistic in our method is designed to test the significance of effects on all surveyed traits for one individual or pair of QTSs,not on one specific trait,only in the step of parameter estimation of QTS via Gibbs sampling based on the final QTS full model,each component effect of QTS on each trait will be tested by t-statistic and then the trait-specific or pleiotropic effects of QTS is inferred.Different from the proposed method based on multivariate mixed linear model,the univariate conditional model of one trait on another or several other correlated traits can also be used to dissect genetic architecture of a group of related traits.If a QTS could be detected and similar strength of effect was estimated by both unconditional model and conditional model of one trait,we could conclude that the QTS is trait-specific and only take effect on the trait;on the contrary,if a QTS could be detected by unconditional model but not by conditional model,then no trait-specific effect of the QTS on the trait could be concluded;third,the power of pleiotropic QTS will be reduced when conditional model was applied since partial effects of the QTS has been removed by the conditional trait in the model.
Onto implement the proposed method,we developed a software in C++programming language which is able to analyze multiple correlated traits,which can detect dominance,epistasis and GE interactions,and estimate the corresponding variance component and genetic effects.In addition,to deal with tremendous matrix computation and speed up the analysis of real data,especially for detecting epistasis for whole genome sequence data,a hybrid parallel computing technology of CPU and GPU was employed in the software QTXNetwork-MT,which can improve the computation efficiency substantially,so that the new method could be applied in association analysis of big data.Finally,the QTXNetwork-MT has been available at the website http://ibi.zju.edu.cn/software.
5.Conclusions
We proposed a multi-trait association analysis method based on multivariate mixed linear model including additive,dominance,epistasis effects of QTS and their interaction effects with environments.Wilks statistic is employed to detect the QTSs with significant individual or di-genic interaction effects.Based on all detected QTSs,a QTS full model is built and used to estimate the genetic component effects of QTSs.Simulation study and real data analysis illustrated that the new method could achieve higher statistical power in detecting middle-to minor-effect QTS compared with the conventional separate analysis of each trait,and be more effective to identify pleiotropic genes in correlated phenotypes,which may be involved simultaneously in several related biological pathways.
Declaration of competing interest
The authors declare that there are no conflicts of interest.
Acknowledgments
The study was supported by the National Key Research and Development Program of China(2016YFC1303300),National Natural Science Foundation of China(31671570,31871707),National Science Foundation(DMS2002865)and the 111 Project(BP2018021).The funders had no role in study design and data analysis.The authors thank the investigators,the staff,and the participants of the MESA(The Multi-Ethnic Study of Atherosclerosis)for their valuable contributions.A full list of participating MESA investigators and institutions can be found at http://www.mesa-nhlbi.org.
CRediT authorship contribution statement
Feng Lin conducted simulation,program development and wrote the manuscript.Guoan Qi checked the program codes.Ting Xu took part in the design of the software QTXNetowk-MT.Xiangyang Lou checked the method and improved the manuscript.Yongbo Hong analyzed the example data and took part in the writing of the manuscript.Haiming Xu developed the model and analysis method,and improved the manuscript.
Appendix A. Supplementary data
Supplementary data for this article can be found online at https://doi.org/10.1016/j.cj.2020.06.007.
杂志排行
The Crop Journal的其它文章
- Quantitative genetic studies with applications in plant breeding in the omics era
- Brief Guide for Authors
- Use of family structure information in interaction with environments for leveraging genomic prediction models
- META-R:A software to analyze data from multi-environment plant breeding trials
- Modeling and simulation of recurrent phenotypic and genomic selections in plant breeding under the presence of epistasis
- A sulfotransferase gene BnSOT-like1 has a minor genetic effect on seed glucosinolate content in Brassica napus