Interannual Variability of Shelf and Slope Circulations in the Northern South China Sea
2020-09-27LIUNaGENGBingxuXUEHuijieXIUPengWANGQiangandWANGDongxiao
LIU Na, GENG Bingxu, 2), 3), *, XUE Huijie, 4), XIU Peng, 2), 3), WANG Qiang, and WANG Dongxiao
Interannual Variability of Shelf and Slope Circulations in the Northern South China Sea
LIU Na1), GENG Bingxu1), 2), 3), *, XUE Huijie1), 4), XIU Peng1), 2), 3), WANG Qiang1), and WANG Dongxiao1)
1) State Key Laboratory of Tropical Oceanography, South China Sea Institute of Oceanology, Chinese Academy of Sciences, Guangzhou 510301, China 2) Southern Marine Science and Engineering Guangdong Laboratory (Guangzhou), Guangzhou 511458, China 3) Innovation Academy of South China Sea Ecology and Environmental Engineering, Chinese Academy of Sciences, Guangzhou 510301, China 4) School of Marine Sciences, University of Maine, Orono, ME 04469-5706, USA
The northern South China Sea (NSCS) is a dynamically complex region whose shelf and slope currents are driven by different mechanisms. In this study, we used field measurements to identify clear interannual variations in the circulation related to the El Niño-Southern Oscillation cycle. To investigate the modulation mechanisms, we used a high-resolution numerical model that covers the shelf and slope regions of the NSCS. The results indicate that the stronger southwestward slope current during La Niña and stronger northeastward shelf current during El Niño in summer and winter are largely related to changes in wind forcing. The Kuroshio intrusion into the NSCS does not appear to significantly affect the circulation in the southwestern shelf region.
shelf and slope circulation; ENSO cycle; ADCP measurements; numerical simulation
1 Introduction
The South China Sea (SCS) is the largest semi-enclosed marginal sea of the northwestern Pacific. Its upper-layer circulation is driven mainly by monsoon winds. In winter, a basin-wide cyclonic gyre is established, and in summer the circulation splits into a weakened cyclonic gyre north of approximately 12˚N and a strong anticyclonic gyre to the south (Qu, 2000; Su, 2004). The SCS is also influenced by external fluxes from the adjacent open ocean. The SCS is connected with the East China Sea through the Taiwan Strait, with the Pacific Ocean through the Luzon Strait, and with the Java Sea through the Karimata Strait. The continental shelves are wide in the northern and southwestern SCS, but extremely narrow in the east and west. The continental shelf in the northern SCS is about 150–250km wide, with the Dongsha Islands located about 200km offshore on a plateau over the upper continental slope.
There are generally three major band-like currents in the northern SCS (NSCS), namely the Guangdong coastal current, the South China Sea Warm Current (SCSWC), and the slope current (Fig.1; Huang, 1992; Guan, 1998; Su, 2004; Shu, 2018). The Guangdong coastal current has two branches. The branch to the west of the Pearl River Estuary is relatively stable and flows westward year-round (Zhong, 1990; Wu, 1990; Bao, 2005; Xie, 2012). The branch to the east of the Pearl River Estuary is seasonal, reversing from a southwestward flow in winter to a northeastward flow in summer in response to monsoon wind (Guan and Chen, 1964; Fang, 1998). The SCSWC appears as an intermittent northeastward current year-round along the shelf break of the northern SCS, spanning from southeast of Hainan Island to southwest of Taiwan. Its year-round persistence over the edge of the continental shelf suggests that the SCSWC is insensitive to local wind-stress forcing. Several mechanisms have been suggested regarding the formation of the SCS- WC, such as wind relaxation (Chao, 1995), bottom topography (Guan and Chen, 1964), and the joint effect of baroclinity and relief (Wang, 2010). Xue(2004) suggested that the SCSWC is mainly balanced by the cross-shore pressure gradient established by wind-driven Ekman transport. The slope current is often known as the SCS branch of the Kuroshio (SCSBK) due to its Kuroshio origin, and flows southwest year-round (Shaw and Chao, 1994; Farris and Wimbush, 1996; Metzger and Hurlbert, 1996; Xue, 2004; Gan, 2006; Quan, 2016).
Although many previous studies have focused on the seasonality and generation processes of these shelf and slope currents, investigations on their interannual variability and underlying mechanisms are limited due to the paucity ofobservations. On the other hand, there have been a number of studies on the interannual variability of the basin-scale general circulation in the SCS (, Zu, 2019, 2020). Wu(1999) concluded that the basin-scale wind-stress curl anomaly plays a dominant role in driving the interannual variability of the upper SCS circulation. Based on a global reanalysis dataset, Qu(2004) found that the El Niño-Southern Oscillation (ENSO) can affect the SCS by modulating the Kuroshio intrusion through the Luzon Strait. Wang(2006) simulated the SCS circulation and reported that the interannual variability of the basin-scale current was dominated by ENSO through both oceanic and atmospheric processes. Shu(2016) usedobservations to determine that the western boundary current anomalies during 2010 and 2011 were mainly induced by basin-scale wind anomalies associated with ENSO. Zhao and Zhu (2016) also reported that the strong El Niño event during 2015–2016 caused a significant change in the volume transport of the SCS western boundary current. Thus, we might also expect the shelf and slope currents in the NSCS to be affected by ENSO at the interannual timescale, but the underlying mechanism remains unexplored.
In this study, we usedmeasurements along with a high-resolution model to study the interannual variability of the shelf and slope currents in the NSCS. The remainder of this paper is arranged as follows. In Section 2, we describe the model configurations andmeasurements. In Section 3, we present our field observed data and model results, and in Section 4, we discuss and summarize our findings.

Fig.1 Topography of the NSCS. The grid shows the domain of the ROMS model; the model grid was plotted at 6-point intervals.
2 Model and Data
2.1 Numerical Model
Based on the Regional Ocean Modeling System (ROMS), we constructed a circulation model that covers the shelf and slope regions of the NSCS, the domain of which is shown in Fig.1. This domain extends from the Qiongzhou Strait to the Taiwan Strait in the southwest-northeast direction, and from the coastline to the 1000-m isobaths in the offshore direction. We used a curvilinear orthogonal horizontal grid with the coordinates oriented in the northeast-southwest () and northwest-southeast () directions. The horizontal resolution of the model is about 3km and it has 31 levels in the vertical direction.
The bottom bathymetry was obtained by merging SRTM30 data (with horizontal resolution of 1/30˚) obtained from the National Geophysical Data Center (NGDC, USA) with digitized coastal water depth data obtained from navigation charts published by the Maritime Safety Administration of China. The model was initialized with climatological winter-mean temperature and salinity data from the World Ocean Atlas 2013 (WOA13). The model was forced at the lateral open boundaries by the hourly tidal elevation, as prescribed by the results from the Oregon State University global tidal inverse model (Egbert, 1994; Egbert and Erofeeva, 2002) and daily temperature, salinity, and current data from the HYCOM reanalysis GLBu0.08 with a spatial resolution of 1/12˚. Eight tidal constituents (M2, S2, N2, K2, K1, O1, P1, and Q1) were used to calculate the hourly tidal elevations. Six-hourly surface winds were obtained from the CCMP wind dataset with a resolution of 0.5˚ (Milliff, 2004). The surface-heat-flux boundary conditions were calculated using the COARE3.0 bulk formula and the CCMP wind and 6-hourly NCEP/NCAR meteorological parameters. The daily discharge of the Pearl River was obtained from the Pearl River Resources Commission.
The model was spun-up for 5 years with climatological monthly forcing and then run in hindcast mode using the lateral and surface forcings from January 01, 2004 to July 01, 2016. In addition to the control run, we conducted two case runs (Table 1). In Case 1, the surface forcing was replaced by climatological fields, and in Case 2, the boundary forcing was replaced by climatological values. Based on these three runs, we were able to elucidate the forcing mechanisms that control the interannual variability of the circulation.

Table 1 Model settings
2.2 Measurements
The measurements used in this study were obtained from NSCS open cruises conducted from 2004 to 2010 (Zeng, 2015). Current velocities between 33m and 977m were recorded by a shipboard acoustic Doppler current profiler (ADCP) at a frequency of 38kHz and at ver-tical intervals of 16m (Table 2).
The multivariate ENSO index (MEI) was used to identify different ENSO phases. The merged sea-level anomaly (SLA) field covering the NSCS was obtained from the Archiving, Validation and Interpretation of Satellite Data in Oceanography (AVISO) website, which is a daily dataset based on a 0.25˚×0.25˚ grid.

Table 2 List of cruises
3 Results and Discussion
3.1 Observed Variations in the NSCS Currents
The NSCS open cruises covered both the shelf and slope regions (Fig.2), and all were conducted either at the end of August or in September. Based on the ADCP measurements, significant variability of the currents is evident (Fig.2). In 2004, currents in the central and southern domains were generally southwestward in both the shelf and slope regions, whereas in the northern domain the currents moved to the northeast. This reversal pattern along the coast to the west and east of the Pearl River Estuary, respectively, demonstrates the typical characteristics of the Guangdong coastal current (Guan and Chen, 1964; Fang, 1998; Zhong, 1990; Wu, 1990). On the slope in the central and southern domains, the southwestward current is consistent with the SCS slope current, which flows to the southwest year-round (Shaw and Chao, 1994; Metzger and Hurlbert, 1996; Xue, 2004). In the northern domain, the slope current can be affected by the Kuroshio loop current and mesoscale eddies, which generate a different circulation pattern (Xue, 2004; Nan, 2011). In 2005, currents on the northern shelf changed their direction to southwestward. In other years,, 2008 and 2010, currents in the central domain moved southwestward on the slope and northeastward on the shelf, a phenomenon that could be temporarily induced by strong southwestern wind, as reported by Yang(2003) and Chen(2006).
3.2 Model Validation
First, we compared the annual variability of the SLA as obtained from the model outputs and the altimetry data (Fig.3). The model can produce the general spatial pattern of the change in the sea-surface height observed in the altimetry data, whereby strong variability occurs in the coastal region and the western domain, and low variability occurs on the shelf and slope. Over the model domain, there is a robust correlation of the SLA between the modeland altimetry data (=0.95) and a relatively low root mean square error (=0.01m).
We examined cross sections of the central domain to compare the measured currents with the model outputs (Fig.4). Here a positive value indicates northeastward flow and a negative value southwestward flow. In 2004, the model captured the southwestward flow (−0.4ms−1) on the upper slope and northeastward flow (0.07ms−1) on the lower slope, but it missed the southwestward flow on the inner shelf. In 2005, the modeled currents were consistent with the observations, with northeastward flow on the shelf (0.08ms−1at the surface in the model, 0.11ms−1at the surface in the ADCP data), southwestward flow on the upper slope (maximum of −0.33ms−1in the model and −0.35ms−1in the ADCP data), and northeastward flow on the lower slope (maximum of 0.01ms−1in the model and 0.09ms−1in the ADCP data). In 2006, the model reproduced the southwestward flow on the shelf and the strong northeastward flow on the slope (0.2ms−1in the model and 0.11ms−1in the ADCP data). In 2007 and 2008, the observed northeastward flow on the inner shelf (approximately 0.2ms−1in both the model and ADCP data) and the southwestward flow on the outer shelf (approximately −0.34ms−1in the model and −0.4ms−1in the ADCP data) were reasonably simulated. In 2009, the model captured the southwestward flow on the inner shelf (approximately −0.33ms−1both in the model and ADCP data), but missed the southwestward flow at the surface on the outer shelf. In 2010, the simulated currents on the shelf were generally northeastward (approximately 0.2ms−1), in accordance with the observations. Overall, the model was able to reasonably simulate the observed spatial and temporal variabilities of the currents, given that observations are typically accompanied by small-scale perturbations that are difficult to capture, which are likely due either to inadequate model resolutions or parameterizations. In 2006, the observed southwestward current on the slope was not well reproduced by the model. The SLA obtained from the altimetry data revealed a mesoscale eddy located close to the slope region at the time the ADCP measurements were collected. Although the model simulated an eddy during that period, the eddy’s location differed from that obtained by the altimetry data, which likely introduced the discrepancy between the modeled and ADCP currents. In 2007, the inner shelf was stratified by a two-layer structure, but this pattern was not evident in the model. This discrepancy was probably induced by the underestimated strength of the Pearl River plume simulated by the model that covered the inner shelf during the observation period.

Fig.2 ADCP measured currents (ms−1) at 33m in the NSCS from 2004 to 2010. The red lines in the figures indicate the sections used for the model-data comparison.

Fig.3 Comparison of standard deviations of the SLA (m) for the AVISO altimetry data (a) and the model (b). The green line in (b) indicates the location of the cross section C1. (c) Data density plot of the model and AVISO data over the model domain to show a grid-by-grid comparison, with warm color indicating a high density of data points.

Fig.4 Model (left panels)-data (right panels) comparison of currents (ms−1) along the cross sections shown in Fig.2 (red lines).
3.3 Current Variability Related to El Niño and La Niña
From both the observations and model outputs, two distinct variations in the current were revealed: 1) a spatial change from the shelf to the slope and 2) a temporal change from year to year. To further examine these variations, we analyzed the model outputs along a cross section, C1 (shown in Fig.3), which shows the depth-averaged current velocity normal to the cross section, with positive values indicating northeastward flows. In general, this cross section showed a southwestward current on the slope, northeastward current on the shelf, and southwestward current near the coast (Fig.5). Strong interannual variations were evident for these currents. For C1, in winter 2012 during La Niña, a strong slope current occurred with a magnitude greater than 0.3ms−1. Relatively low values occurred during El Niño conditions in the summer of 2007 and the winter of 2010. On the shelf, the strongest northeastward current was present in the summer of 2010. In 2010, a current anomaly also occurred in the coastal region where currents generally flow in the southwestward direction. When integrated over the whole section, including both the shelf and slope regions, there is a significant correlation between the interannual signal of the currents and the MEI (=0.35), with the MEI leading by 5−6 months. This suggests that the interannual variability of circulations on the shelf and slope were related to the ENSO variability. Using a 15-month running mean to remove high-frequency signals, we calculated the correlation coefficient between the averaged current along C1 and the MEI index.
Then, we composited the modeled outputs into typical El Niño and La Niña periods according to the MEI index (MEI>0.5 and <-0.5 for the El Niño and La Niña periods, respectively) by considering the time lag. We also separated the summer and winter seasons (Fig.6). Distinct differences between the El Niño and La Niña periods can be seen in the cross section. During El Niño, there were weak southwestward currents on the slope and strong northeastward currents on the shelf in summer (Fig.6a). During La Niña, the slope current was enhanced and the shelf current became weaker (Fig.6b). In winter, the currents generally flowed in the southwestward direction both on the shelf and slope. The significant difference between the two periods was the weaker slope current during El Niño than La Niña (Figs.6c, 6d). Overall, the enhanced northeastward shelf current and the weakened southwestward slope current during El Niño were consistent with the above correlation.
3.4 Mechanisms of the Current Variability
To identify the dynamic processes that control the circulation variability, we examined the momentum balances. To perform this analysis, we used composited variables obtained during the El Niño and La Niña periods. The respective depth-dependent momentum equations are given in Eqs. (1) and (2):


Fig.5 Vertical averaged flow velocity (ms−1) along cross section C1 during 2004–2016 (a). Interannual variability of the current with the high-frequency (<15 month) signal removed (b). Monthly MEI index (c).
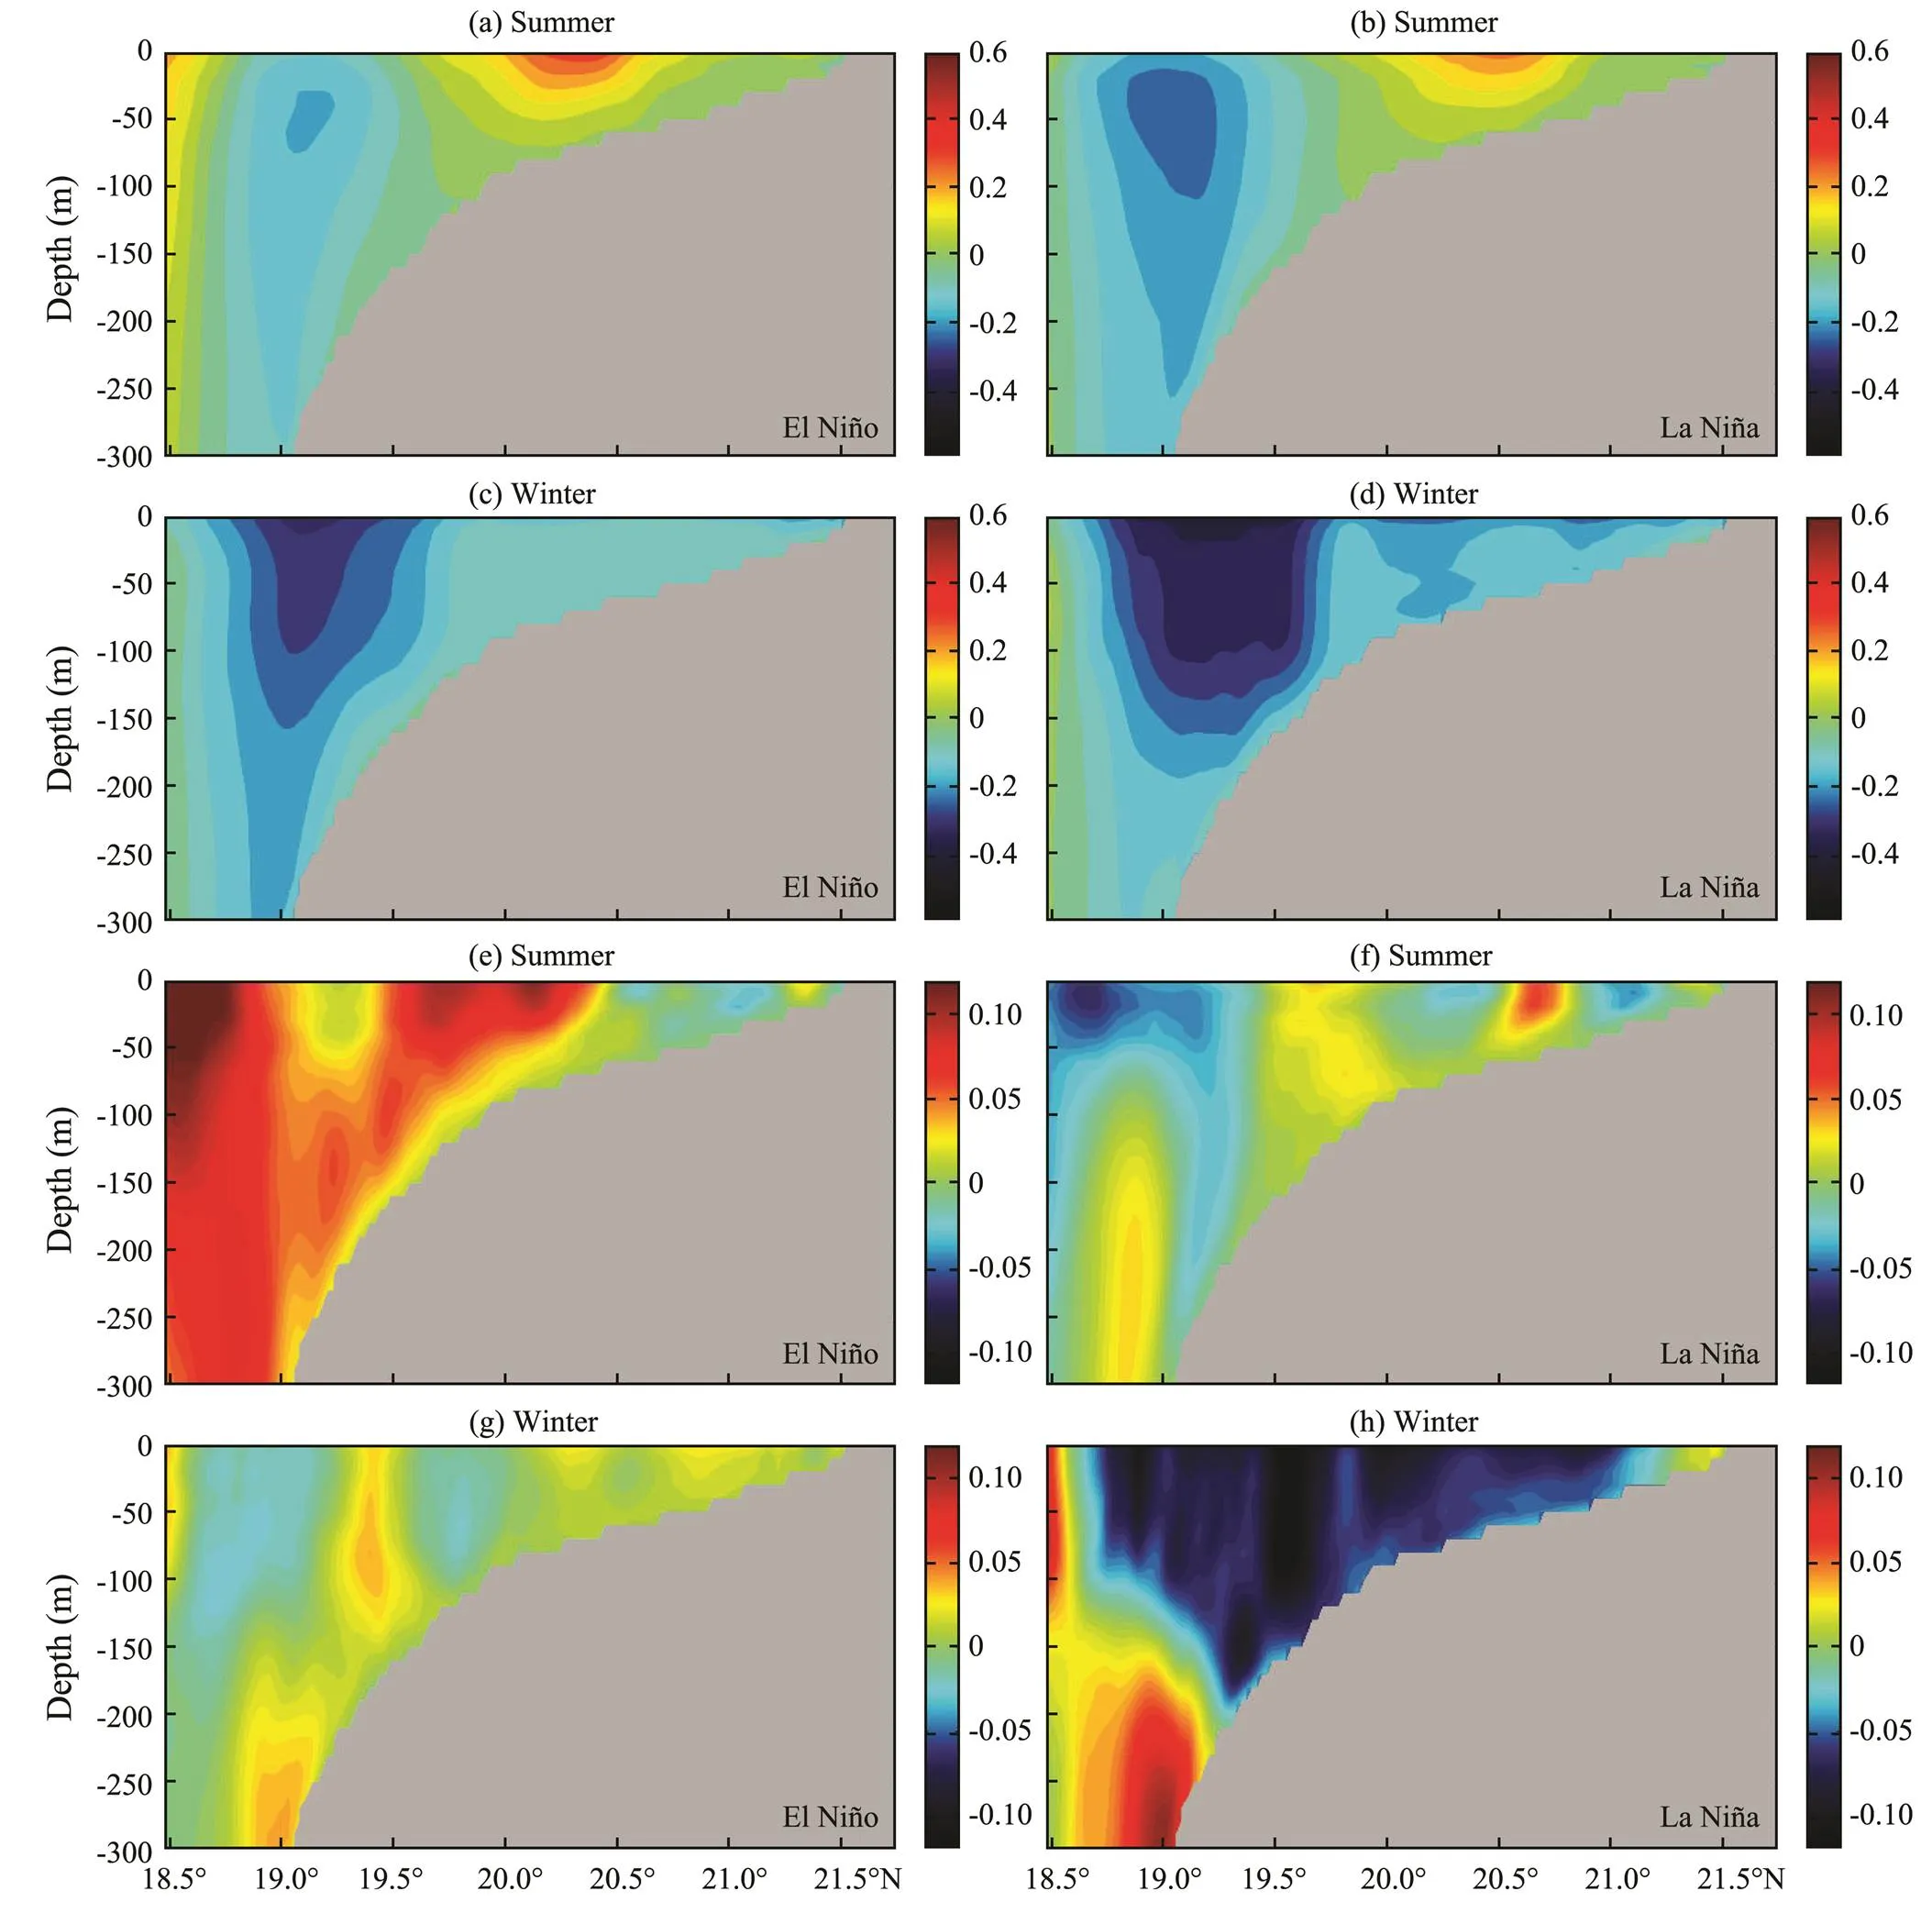
Fig.6 Composites of summer (a, b, e, f) and winter (c, d, g, h) currents (ms−1) perpendicular to cross section C1 during the El Niño (a, c, e, g) and La Niña (b, d, f, h) periods, respectively. (a)–(d) Distributions of the current velocity and (e)–(h) distributions of current differences relative to normal years.
where the terms in the equations from left to right are the acceleration (Acc), nonlinear advection (Adv), Coriolis acceleration (Cor), vertical diffusion (Vis), pressure gradient (Pre), and horizontal diffusion (Dif).
Figs.7 and 8 show the respective spatial distributions of the surface diagnostic terms, wherein the values are oriented in the alongshore direction. In winter, a large positive Cor is found over the shelf and slope regions, which is generally balanced by the Pre and Vis terms (Fig.7). The spatial distribution of the Vis term is uniform on the shelf and slope, whereas the Cor and Pre terms have large spatial variability. The negative Pre value in the slope and deep regions become stronger during La Niña as compared with El Niño. The negative Vis values on the slope and shelf also show larger magnitudes during the La Niña period. In summer, Cor, Pre, and Vis are the three dominant terms (Fig.8). If we compare the two ENSO phases, large changes are also evident in the Cor, Pre, and Visvalues. For section C1, the decreased Cor values in La Niña on both the shelf and slope tend to reduce the northeastward shelf current and increase the southwestward slope current.
To further investigate the forcing mechanisms causing the interannual variability, we examined the outputs from two model cases (Table 1). In Case 1, the model was forced with climatological surface forcing, so we can assume that most of the model’s interannual signal was from the lateral boundary. In Case 2, most of the interannual signal comes from the surface forcing. In summer, the shelf current along C1 is stronger during El Niño than during La Niña in Case 1 (Figs.9a, 9b), which is consistent with the pattern in the control run. The slope current in Case 1 is stronger during El Niño than La Niña, especially in the subsurface. In comparison, changes in the summer currents between the ENSO phases are more significant in Case 2 than in Case 1. In Case 2, there are stronger shelf currents and weaker slope currents during El Niño (Figs.9c, 9d), which accords with the control run. Similar results are also found in winter, where larger changes in the currents occur in Case 2 than in Case 1 (Fig.10), which implies the more important role of surface forcing than boundary forcing in driving the interannual variability.
In summer, surface winds in the SCS basin primarily blow to the north during El Niño and then change to the northeast during La Niña (Figs.11a, 11c). The northeastward wind may drive a stronger offshore Ekman transport on the slope and consequently result in the enhanced Cor term (negative values) in the southwestern shelf region during La Niña relative to El Niño. The wind curl is generally positive during La Niña and negative during El Niño in the central and northern domains, which likely leads to the change in the alongshelf gradient of the sea-surface height (Figs.11b, 11d)Ekman pumping and subsequent changes in the Preterm(Fig.8). In Case 1, the stronger slope current in El Niño than in La Niña could be related to the change in the Kuroshio intrusion at the model boundary. During El Niño years, the bifurcation of the North Equatorial Current takes place at higher latitudes, and the Kuroshio transport becomes weaker, which leads to a stronger Kuroshio intrusion into the NSCS (Qu and Lukas, 2003; Hu, 2015). However, Kuroshio intrusion does not seem to be the dominant mechanism affecting the slope current, because a stronger slope current occurs during La Niña in the control run.
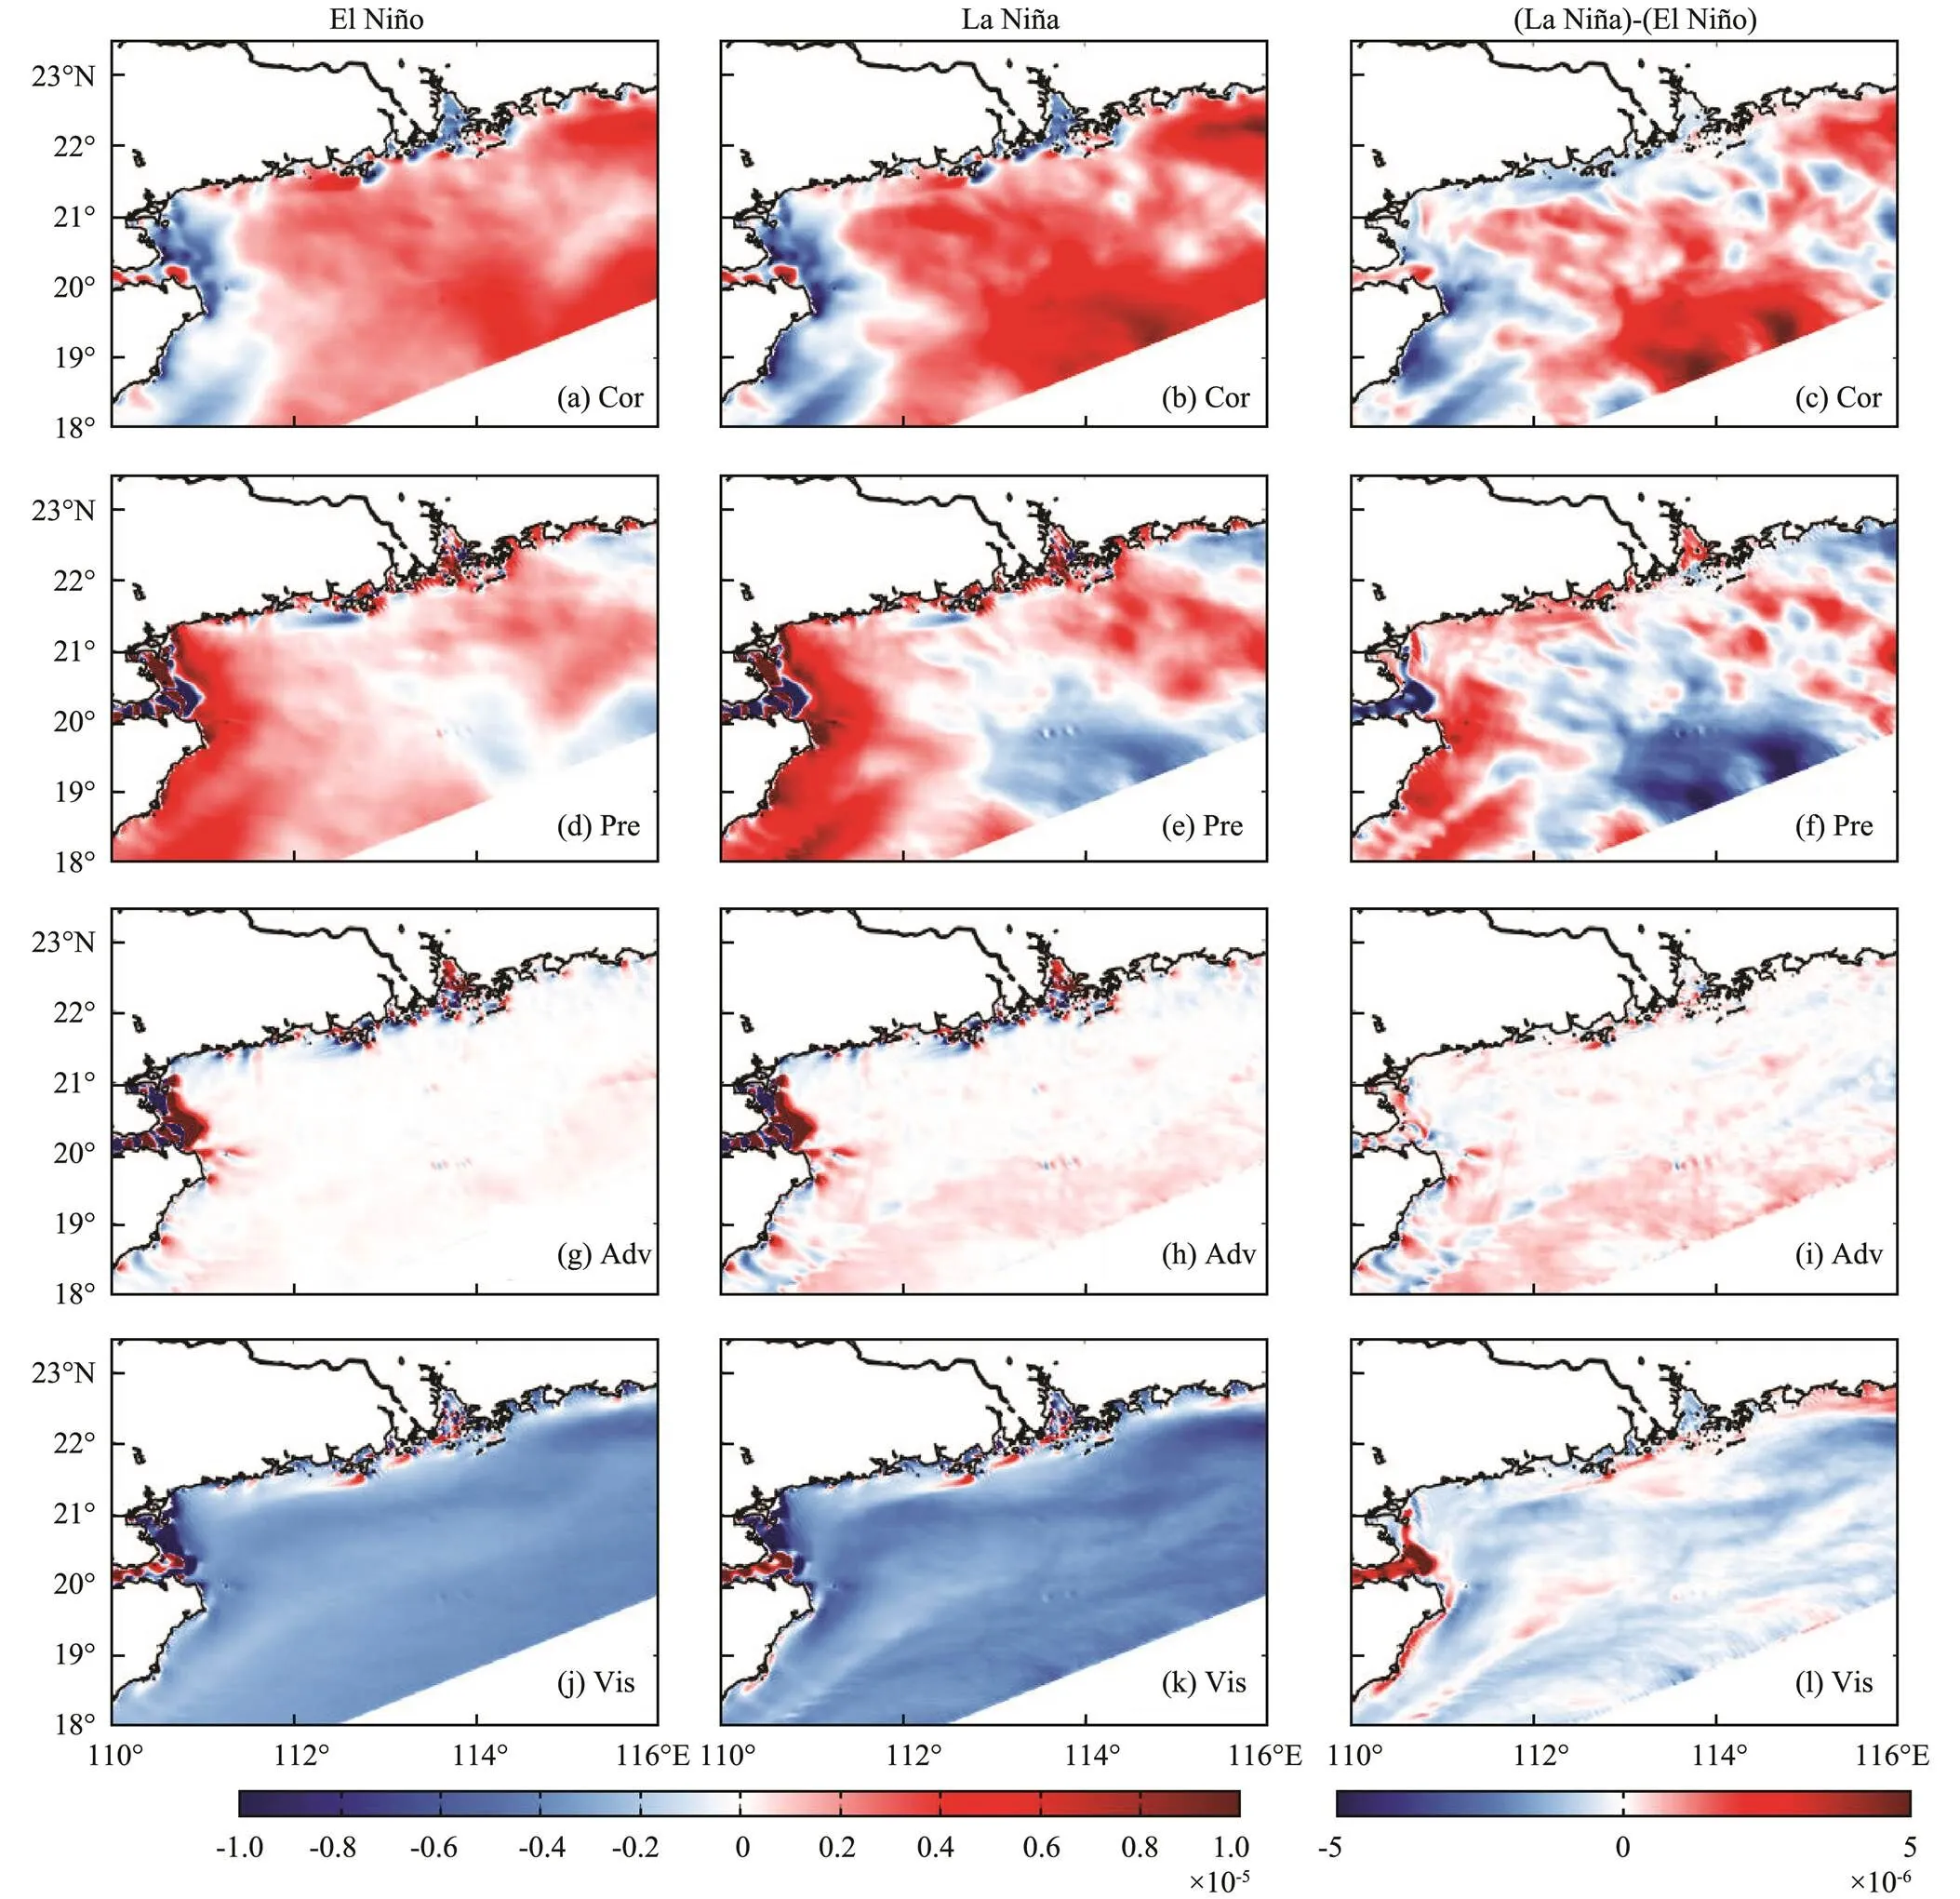
Fig.7 Surface-momentum diagnostic terms (ms−2) in the alongshore direction in winter during the El Niño and La Niña periods.
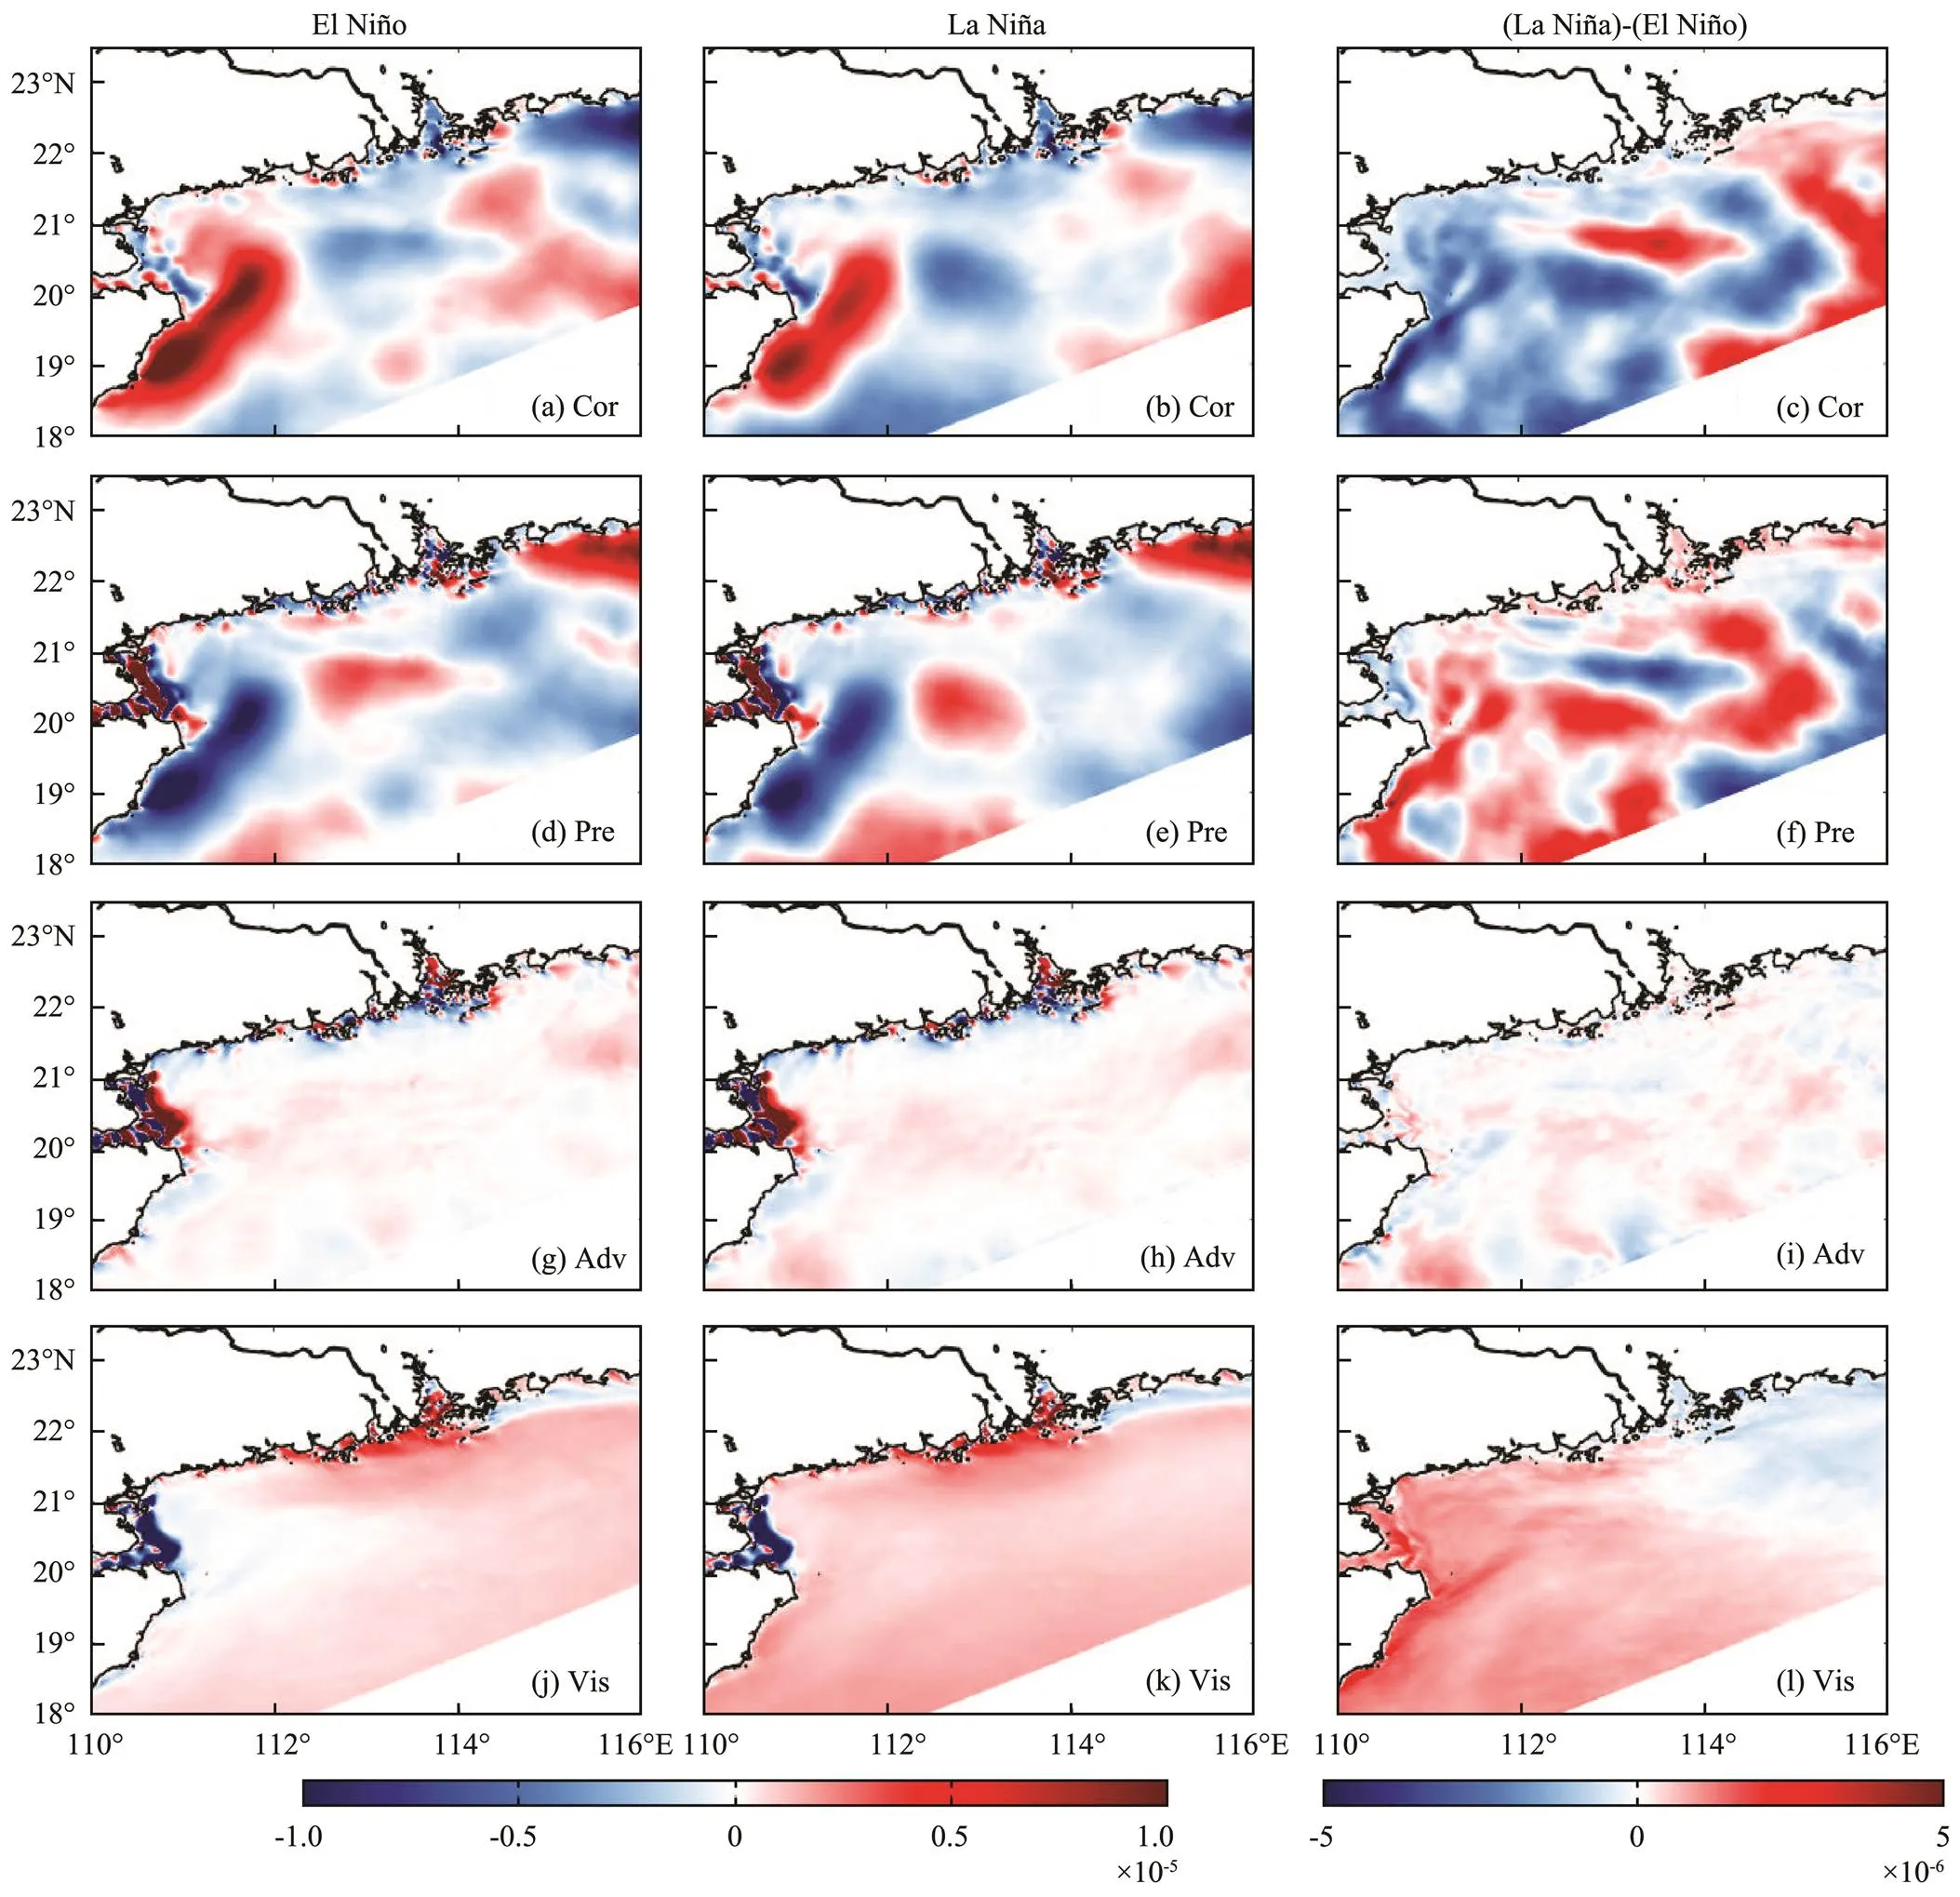
Fig.8 Surface-momentum diagnostic terms (ms−2) in the alongshore direction in summer during the El Niño and La Niña periods.
4 Concluding Remarks
In this study, we used ADCP measurements to identify the interannual variations of the shelf and slope circulations in the NSCS. The modulation mechanisms were investigated using a ROMS model that covers the shelf and slope regions of the NSCS. This model can reproduce the general circulation pattern in the NSCS, including the southwestward coastal current, northeastward shelf current, and southwestward slope current, in agreement with observational data. Based on the model outputs, we examined the currents during the El Niño and La Niña periods. We found the stronger southwestward slope current in La Niña and stronger northeastward shelf current during El Niño in summer and winter to be largely related to the change in the wind forcing. The Kuroshio intrusion into the NSCS does not significantly affect the circulation in the southwestern shelf region. In this work, we did not examine the influences of Rossby waves and mesoscale eddies on the interannual variation of the circulation, which we will address in future work.
Acknowledgements
This study is supported by the National Key Research and Development Program of China (No. 2016YFC1401604), the National Natural Science Foundation of China (No. 41806035), the Key Special Project for Introduced Talents Team of Southern Marine Science and Engineering Guangdong Laboratory (Guangzhou) (No. GML2019ZD0305), the National Natural Science Foundation of China (Nos. 41730536, 41890805), the Innovation Academy of South China Sea Ecology and Environmental En- gineering, Chinese Academy of Sciences (No. ISEE2019ZR02), the Guangdong Basic and Applied Basic Research Foundation (No. 2019A1515012108), and the Research Funds from the State Key Laboratory of Tropical Oceanography (No. LTOZZ1803).
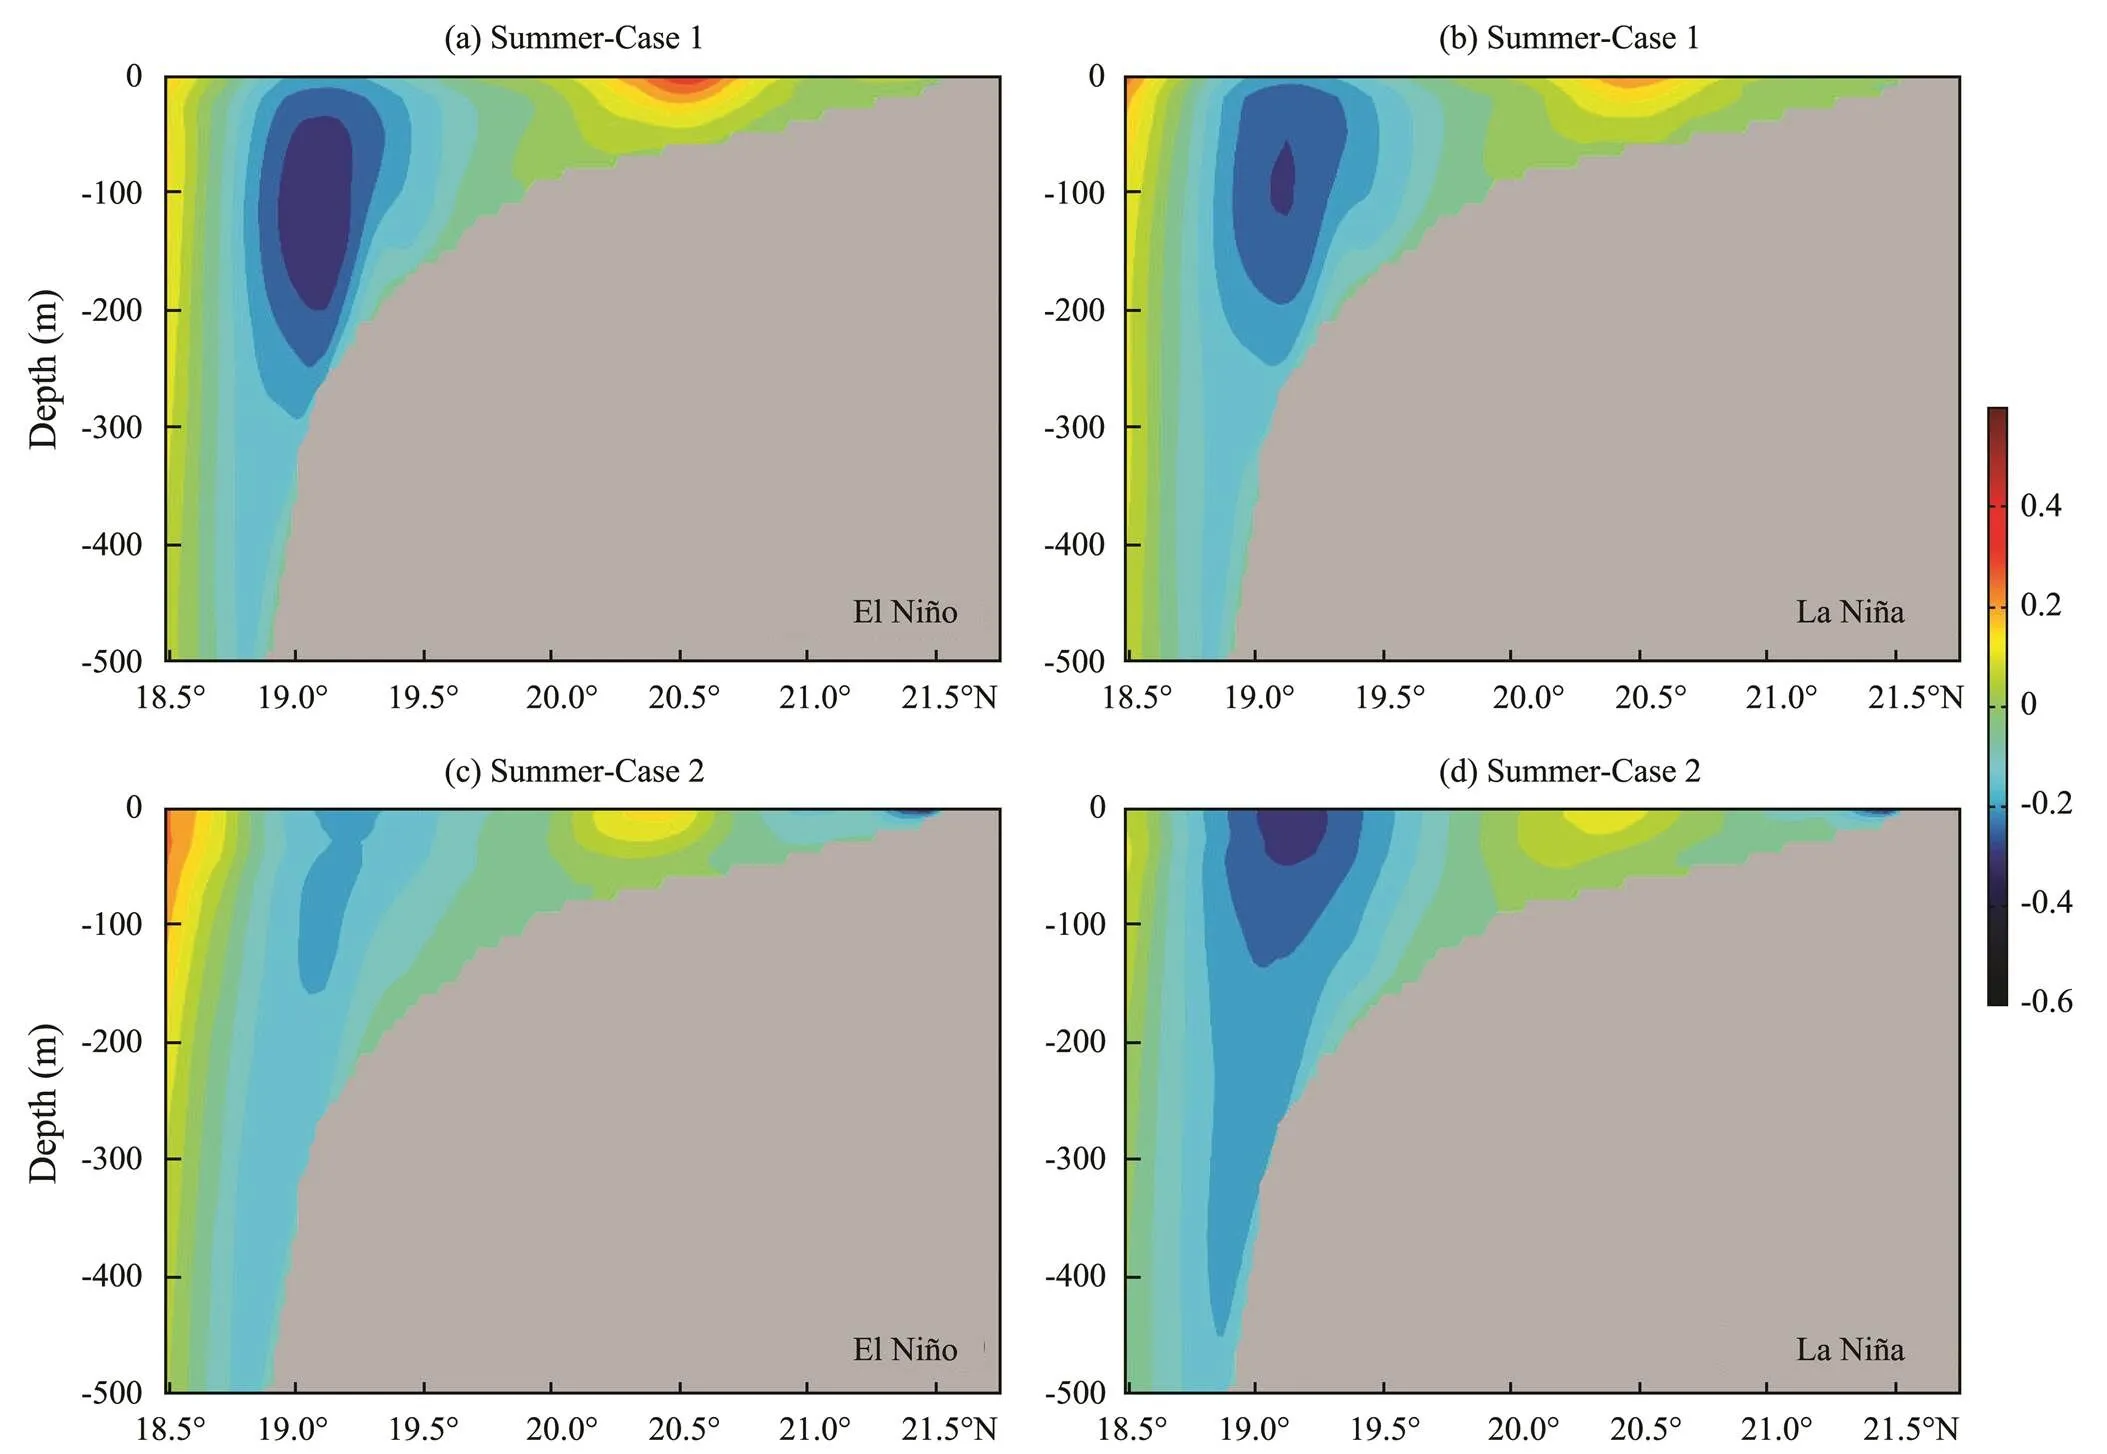
Fig.9 Composites of summer currents (ms−1) along C1 during the El Niño and La Niña periods for (a, b) Case 1 and (c, d) Case 2.
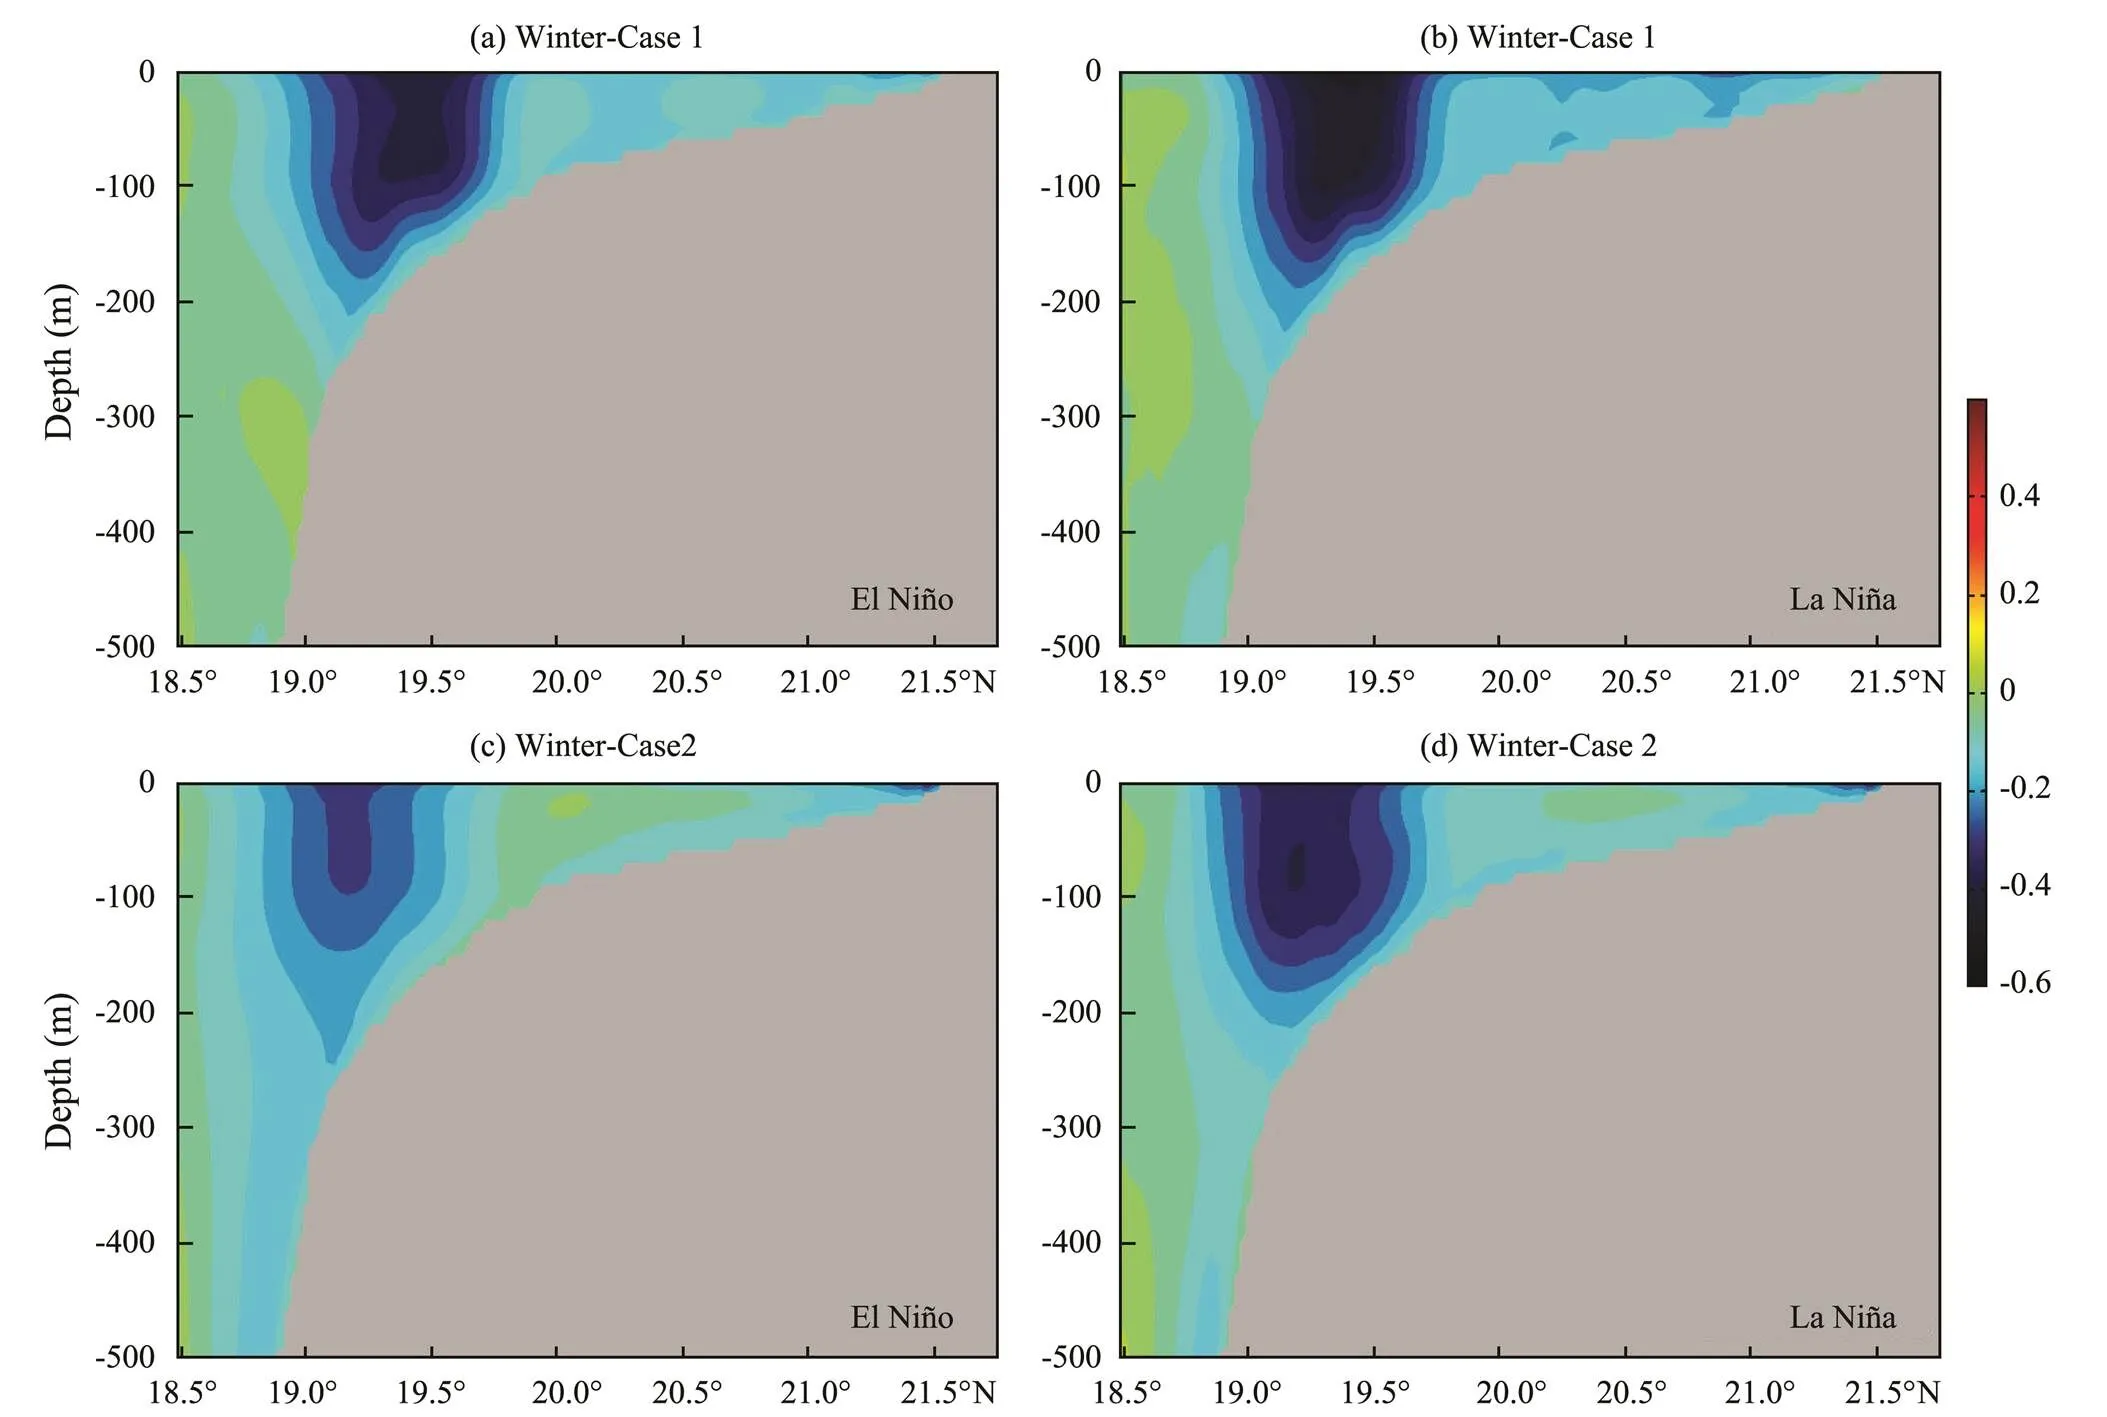
Fig.10 Composites of winter currents (ms−1) along C1 during the El Niño and La Niña periods for (a, b) Case 1 and (c, d) Case 2.

Fig.11 Mean summer wind (vectors; ms−1) and wind curl (color; s−1) during the El Niño (a) and La Niña (c) periods. (b) and (d) Wind curl and sea level (m) along the magenta line (in (a)) during the El Niño (b) and La Niña (d) periods.
Bao, X., Hou, Y., Chen, C., Chen, F., and Shi, M., 2005. Analysis of characteristics and mechanism of current system on the west coast of Guangdong of China in summer., 24: 1-9.
Chao, S. Y., Shaw, P. T., and Wang, J., 1995. Wind relaxation as a possible cause of the South China Sea Warm Current., 51: 111-132.
Chen, D., Chen, B., Yan, J., and Xu, H., 2006. The seasonal variation characteristics of residual currents in the Qiongzhou Strait., 2: 12-17 (in Chinese with English abstract).
Egbert, G. D., and Erofeeva, S. Y., 2002. Efficient inverse modeling of Barotropic Ocean tides., 19 (2): 183-204.
Egbert, G. D., Bennett, A. F., and Foreman, M. G. G., 1994. TOPEX/POSEIDON tides estimated using a global inverse model., 99 (C12): 24821-24852.
Fang, G., Fang, W., Fang, Y., and Wang, K., 1998. A survey of studies on the South China Sea upper ocean circulation., 37: 1-16.
Farris, A., and Wimbush, M., 1996. Wind-induced Kuroshio intrusion into the South China Sea., 52: 771-784.
Gan, J., Li, H., Curchitser, E. N., and Haidvogel, D. B., 2006. Modeling South China Sea circulation: Response to seasonal forcing regimes., 111 (C6): C06034.
Guan, B. X., 1998. A review of study on the South China Sea Warm Current., 29 (3): 322-329 (in Chinese with English abstract).
Guan, B. X., and Chen, S. J., 1964. The current systems in the near-sea area of China seas. Initial Report 5, Institute of Oceanology, Chinese Academy of Sciences, Qingdao, 1-85.
Hu, D., Wu, L., Cai, W., Gupta, A., Ganachaud, A., Qiu, B., Gordon, A., Lin, X., Chen, Z., Hu, S., Wang, G., Wang, Q., Sprintall, J., Qu, T., Kashino, Y., Wang, F., and Kessler, W., 2015. Pacific western boundary currents and their roles in climate., 522: 299-308.
Huang, Q., Wang, W., Li, Y. S., Li, C. W., and Mao, M., 1992. General situations of the current and eddy in the South China Sea., 7 (5): 1-9.
Mertzger, E. J., and Hurlburt, H. E., 1996. Coupled dynamics of the South China Sea, the Sulu Sea, and the Pacific Ocean., 101: 12331-12352.
Milliff, R. F., Morzel, J., Chelton, D. B., and Freilich, M. H., 2004. Wind stress curl and wind stress divergence biases from rain effects on QSCAT surface wind retrievals., 21: 1216-1231.
Nan, F., Xue, H., Chai, F., Shi, L., Shi, M., and Guo, P., 2011. Identification of different types of Kuroshio intrusion into the South China Sea., 61: 1291-1304.
Qu, T., 2000. Upper layer circulation in the South China Sea., 36: 1751-1762.
Qu, T., and Lukas, R., 2003. The bifurcation of the North Equatorial Current in the Pacific., 33: 5-18.
Qu, T., Kim, Y. Y., Yaremchuk, M., Tozuka, T., Ishida, A., and Yamagata, T., 2004. Can Luzon Strait transport play a role in conveying the impact of NESO to the South China Sea?, 17: 3644-3657.
Quan, Q., Xue, H., Qin, H., Zeng, X., and Peng, S., 2016. Features and variability of the South China Sea western boundary current from 1992 to 2011., 66: 795-810.
Shaw, P. T., and Chao, S. Y., 1994. Surface circulation in South China Sea., 40: 1663-1683.
Shu, Y., Wang, Q., and Zu, T., 2018. Progress on shelf and slope circulation in the northern South China Sea., 61: 560-571.
Shu, Y., Xue, H., Wang, D., Xie, Q., Chen, J., Li, J., Chen, R., He, Y., and Li, D., 2016. Observed evidence of the anomalous South China Sea western boundary current during the summers of 2010 and 2011., 121: 1145-1159, DOI: 10.1002/2015JC011434.
Su, J. L., 2004. Overview of the South China Sea circulation and its influence on the coastal physical oceanography outside the Pearl River Estuary., 24: 1745-1760.
Wang, D., Hong, B., Gan, J. P., and Xu, H. Z., 2010. Numerical investigation on propulsion of the counter-wind current in the northern South China Sea in winter., 57 (10): 1206-1221.
Wang, D., Liu, Q., Huang, R. X., Du, Y., and Qu, T., 2006. Interannual variability of the South China Sea through flow inferred from wind data and an ocean data assimilation product., 33: L14605, DOI: 10.1029/2006GL026316.
Wu, B., 1990. A study on the circulation in shelf waters west to Zhujiang River Mouth III., 9: 118-126 (in Chinese with English abstract).
Wu, C. R., Shaw, P. T., and Chao, S. Y., 1999. Assimilating altimetric data into a South China Sea model., 104: 29987-30005.
Xie, L., Cao, R., and Shang, Q., 2012. Progress of study on coastal circulation near the shore of western Guangdong., 32: 94-98 (in Chinese with English abstract).
Xue, H., Chai, F., Pettigrew, N., Xu, D., Shi, M., and Xu, J., 2004. Kuroshio intrusion and the circulation in the South China Sea., 109: C02017, DOI: 10.1029/2002JC001724.
Yang, S., Bao, X., Chen, C., and Chen, F., 2003. Analysis of characteristics and mechanism of current system in west coast of Guangdong Province in the summer., 25: 1-8 (in Chinese with English abstract).
Zeng, L., Wang, Q., Xie, Q., Shi, P., Yang, L., Shu, Y., Chen, J., Sui, D., He, Y., Chen, R., and Wang, D., 2015. Hydrographic field investigations in the northern South China Sea by open cruises during 2004–2013., 60 (6): 607-615.
Zhao, R., and Zhu, X. H., 2016. Weakest winter South China Sea western boundary current caused by the 2015–2016 El Niño event.,121: 7673-7682, DOI: 10.1002/2016JC012252.
Zhong, H., 1990.. Ocean Press, Beijing, 218-221 (in Chinese).
Zu, T., Wang, D., Wang, Q., Li, M., Wei, J., Geng, B., He, Y., and Chen, J., 2020. A revisit of the interannual variation of the South China Sea upper layer circulation in summer: Correlation between the eastward jet and northward branch., 54: 457-471.
Zu, T., Xue, H., Wang, D., Geng, B., Zeng, L., Liu, Q., Chen, J., and He, Y., 2019. Interannual variation of the South China Sea circulation during winter: Intensified in the southern basin., 52: 1917-1933.
. E-mail: gengbx@scsio.ac.cn
January 9, 2020;
April 12, 2020;
May 12, 2020
(Edited by Xie Jun)
杂志排行
Journal of Ocean University of China的其它文章
- Estimation and Prediction of Typhoons and Wave Overtopping in Qingdao, China
- Estimating Design Loads with Environmental Contour Approach Using Copulas for an Offshore Jacket Platform
- Geochemistry and Petrogenesis of Volcanic Rocks from the Continent-Ocean Transition Zone in Northern South China Sea and Their Tectonic Implications
- Study on the Geo-Environmental Evolution of the Laolonggou Lagoon Under the Impacts of the Caofeidian Reclamation Project in Hebei Province
- Operational Laboratory Methods for GDGTs Groups Separation
- Design of Full-Ocean-Depth Self-Floating Sampler and Analysis of Factors Affecting Core Penetration Depth
