Encoding methods matching the 16 × 16 pixel CZT detector of a coded aperture gamma camera
2020-09-24XiaoLeiShenPinGongXiaoBinTangRuiZhangJinChaoMa
Xiao-Lei Shen· Pin Gong · Xiao-Bin Tang,2 · Rui Zhang · Jin-Chao Ma
Abstract With the advancements in nuclear energy,methods that can accurately obtain the spatial information of radioactive sources have become essential for nuclear energy safety. Coded aperture imaging technology is widely used because it provides two-dimensional distribution information of radioactive sources.The coded array is a major component of a coded aperture gamma camera,and it affects the key performance parameters of the camera. Currently, commonly used coded arrays such as uniformly redundant arrays (URAs) and modified uniformly redundant arrays (MURAs) have prime numbers of rows or columns and may lead to wastage of detector pixels.A 16 × 16 coded array was designed on the basis of an existing 16 × 16 multi-pixel position-sensitive cadmium zinc telluride detector. The digital signal-to-noise(SNR)ratio of the point spread function at the center of the array is 25.67. Furthermore, Monte Carlo camera models and experimental devices based on rank-13 MURA and rank-16 URA have been constructed. With the same angular resolution, the field size of view under rank-16 URA is 1.53 times that of under rank-13 MURA. Simulations (Am-241, Co-57, Ir-192, Cs-137) and experiments(Co-57) are conducted to compare the imaging performance between rank-16 URA and rank-13 MURA. The contrast-to-noise ratio of the reconstructed image of the rank-16 array is great and only slightly lower than that of rank-13 MURA. However, as the photon energy increases,the gap becomes almost negligible.
Keywords Coded aperture imaging · CZT · Gamma camera · Uniformly redundant arrays
1 Introduction
Coded aperture gamma cameras are extensively used in several fields such as space exploration, environmental radioactivity monitoring, and nuclear emergency monitoring [1–5]. The cadmium zinc telluride (CZT) detector is commonly used in gamma-ray detection owing to its high stopping power and good energy resolution [6, 7], and the CZT detector module with 16 × 16 pixels is widely used[8, 9]. However, a mismatch occurs between the coded aperture mask and detector pixel array which will lead to wastage of detector pixels when the traditional prime number coded arrays are applied, such as MURA or URA[10,11].Hence,the coded aperture gamma camera will not reach its best performance in some aspects such as FOV or angular resolution.
In this study, rank-16 URA is used for optimally using all pixels of the 16 × 16 CZT detector. In addition, rank-13 MURA is used to compare the application prospects of rank-16 URA via Monte Carlo simulations and experiments.
2 Principle
2.1 Construction of rank-16 URA-based coded aperture
After the conception of coded aperture imaging, several aperture designs were proposed.An important advance was made in 1978 with the introduction of the URA [12], a design possessing both high throughput (50%) and a capability for reconstructing images whose noise terms are uniform regardless of the original source structure [13].
M-sequence, which is a type of pseudo-noise (PN)sequence [14, 15], can be used to construct an n1× n2array, where n1and n2are relatively primes. As the array produced by an M-sequence can be almost a square array[16, 17], a 16 × 16 square coded array can be constructed based on the M-sequence.
The process is as follows:
First, one-dimensional sequences aiwith length(2m- 1) are constructed through the shift register [12]:

For the aperture ratio to reach 50%, the extra element a2mmust be an opaque element (0). For the one-dimensional sequence to be folded into a two-dimensional array,m should be a multiple of 2.Thus,square coded arrays only exist in special cases with restrictions on the value of m. Correlation decoding has been used here for image reconstruction.The SNRs of the PSFs at the center point of all square arrays are calculated to determine the optimal array [18].
For the case of 16 × 16 coded array, 256 elements are required. When m = 8, a total of 16 × 255 coded arrays can be obtained.Then,the SNRs of 16 × 255 coded arrays are calculated and the optimal array is selected,as shown in Fig. 1.The blue area indicates closed cells,and the yellow area indicates open ones.The SNR of the PSF at the center of the optimal rank-16 array is 25.67. Compared to the MURA, such as rank-13 MURA, the PSF of the rank-16 URA array in Fig. 1 shows relatively larger fluctuation in the sidelobes. We will verify the application prospect of rank-16 URA through a simulation and an experiment.
An array of 32 × 32 coded aperture is conventionally built by a 2 × 2 arrangement of the optimal rank-16 URA[19]. There is the principle that in any 2 N × 2 N mosaic array,no continuous N × N array of the same arrangement can appear.Unfortunately,the 32 × 32 coded aperture has the same arrangements as 16 × 16 arrays, which could result in the same reconstructed images when the positions of the sources are different. To solve this problem, we remove the first row and the first column of the 32 × 32 mosaic array to obtain a 31 × 31 mosaic array,as shown in Fig. 2.
3 Methods
The pixelated CZT position detector used in later experimental research was purchased from Imdetek Co.,Ltd, and the specifications are shown in Table 1.
3.1 Monte Carlo model settings
We set the source–detector distance under different point radioactive sources(Am-241,Co-57,Ir-192,Cs-137)with an activity of 10.6 MBq to 2 m during the simulations. When the source–detector distance was set to 2 m,the aperture magnification factor is 1.04 and the reconstruction effect is good [20].
PHITS, a Monte Carlo simulation software, is used for simulation work [21, 22]. The final Monte Carlo model is shown in Fig. 3. In the simulation and experimental work,the mask element is set to a square aperture with a side length of 1.6 mm to obtain the best source positioning accuracy [23]. Ideally, a mask has no thickness so that the flux in all directions in the FOV does not change after passing through the aperture element. However, in the actual process, the rays from the edge of the FOV will be partially blocked owing to the thickness of the mask [24].This makes the image quality of the FOV edge poor. The best thickness of the mask will be obtained through simulation to avoid serious collimation effect [25].

Fig. 1 (Color online) Optimal rank-16 URA (a); PSF of rank-16 URA (b); PSF of rank-13 MURA (c)

Fig. 2 (Color online) The 32 × 32 mosaic array based on rank-16 URA (a) and the 31 × 31 mosaic array (b). The 32 × 32 mosaic array (a) causes wrong position reconstruction. The 32 × 32 mosaic array is stripped of one row and one column to obtain the 31 × 31 array (b). Red dots indicate correct reconstruction position
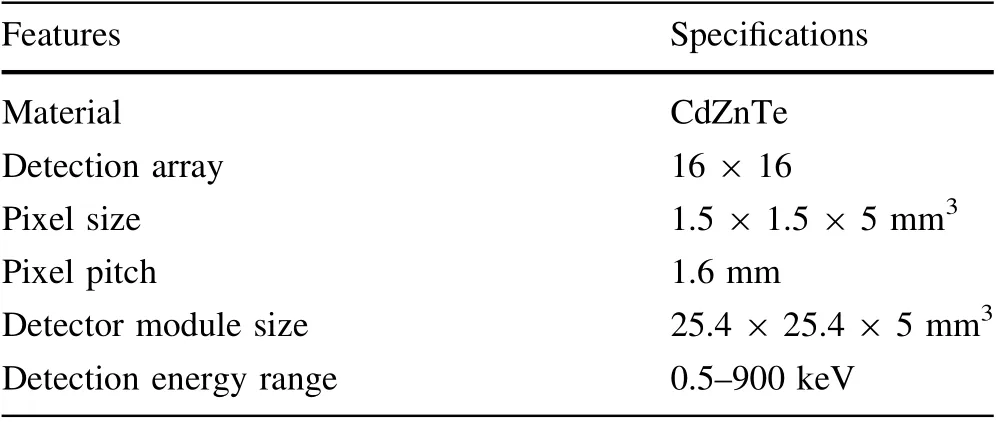
Table 1 Specifications of the detector
3.2 Experimental setup

Fig. 3 (Color online) Monte Carlo model geometry settings
In the experiment, we set the radioactive source Co-57 with an activity of 3.2 × 10⁶Bq, 1.1 m away from detector. In this case, the aperture magnification factor is 1.075, and the image quality deteriorates marginally compared to the simulation due to the effects of near-field effects [17, 26]. Blocks with a size of 1.6 × 1.6 × 2 mm3and purity of 99% tungsten are selected for stitching into the array.The thickness of the entire mask can be changed with a 2-mm gradient.The experimental platform is shown in Fig. 4.The geometric settings of the experiments herein are the same as the simulation settings.
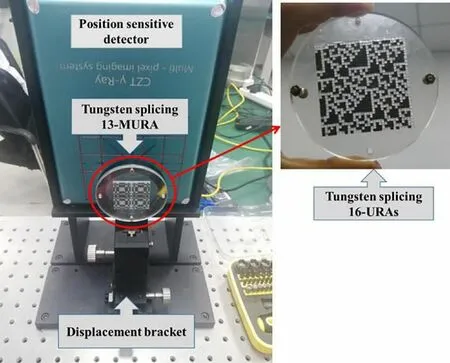
Fig. 4 (Color online) Coded aperture gamma camera experimental platform
4 Results and discussion
Contrast-to-noise ratio(CNR)is used to characterize the contrast between the region of interest of the reconstruction image and the background noise[27].In this study,CNR is used as the evaluation standard of image quality, and the region where the imaging target is located in the FOV is selected as the region of interest.We performed correlation decoding for the image reconstruction method in another study [12].
Figure 5 shows the CNR for different mask thicknesses on the imaging quality under rank-16 URA. The imaging time is 8 min.The reconstructed image is obtained by three repeated measurements. A thick MASK does not always improve the imaging quality under different energies.When mask is set to 4 mm, the imaging effect is good in the FOV. Thus, in the following simulation and experiment, the thickness of the mask is set to 4 mm. Simultaneously, the imaging quality under Cs-137 is not good;thus, a thick mask and long-time detection are inevitable conditions for imaging.
4.1 Camera parameters
The parameters of the rank-16 URA-based camera and the rank-13 MURA-based camera at the same angular resolution are obtained through theoretical calculations[28], as shown in Table 2. The FOV of the camera at a fixed distance is close to the square, as shown in Fig. 6.The full use of 16 × 16 pixels makes rank-16 URA-based cameras have a larger detectable area.
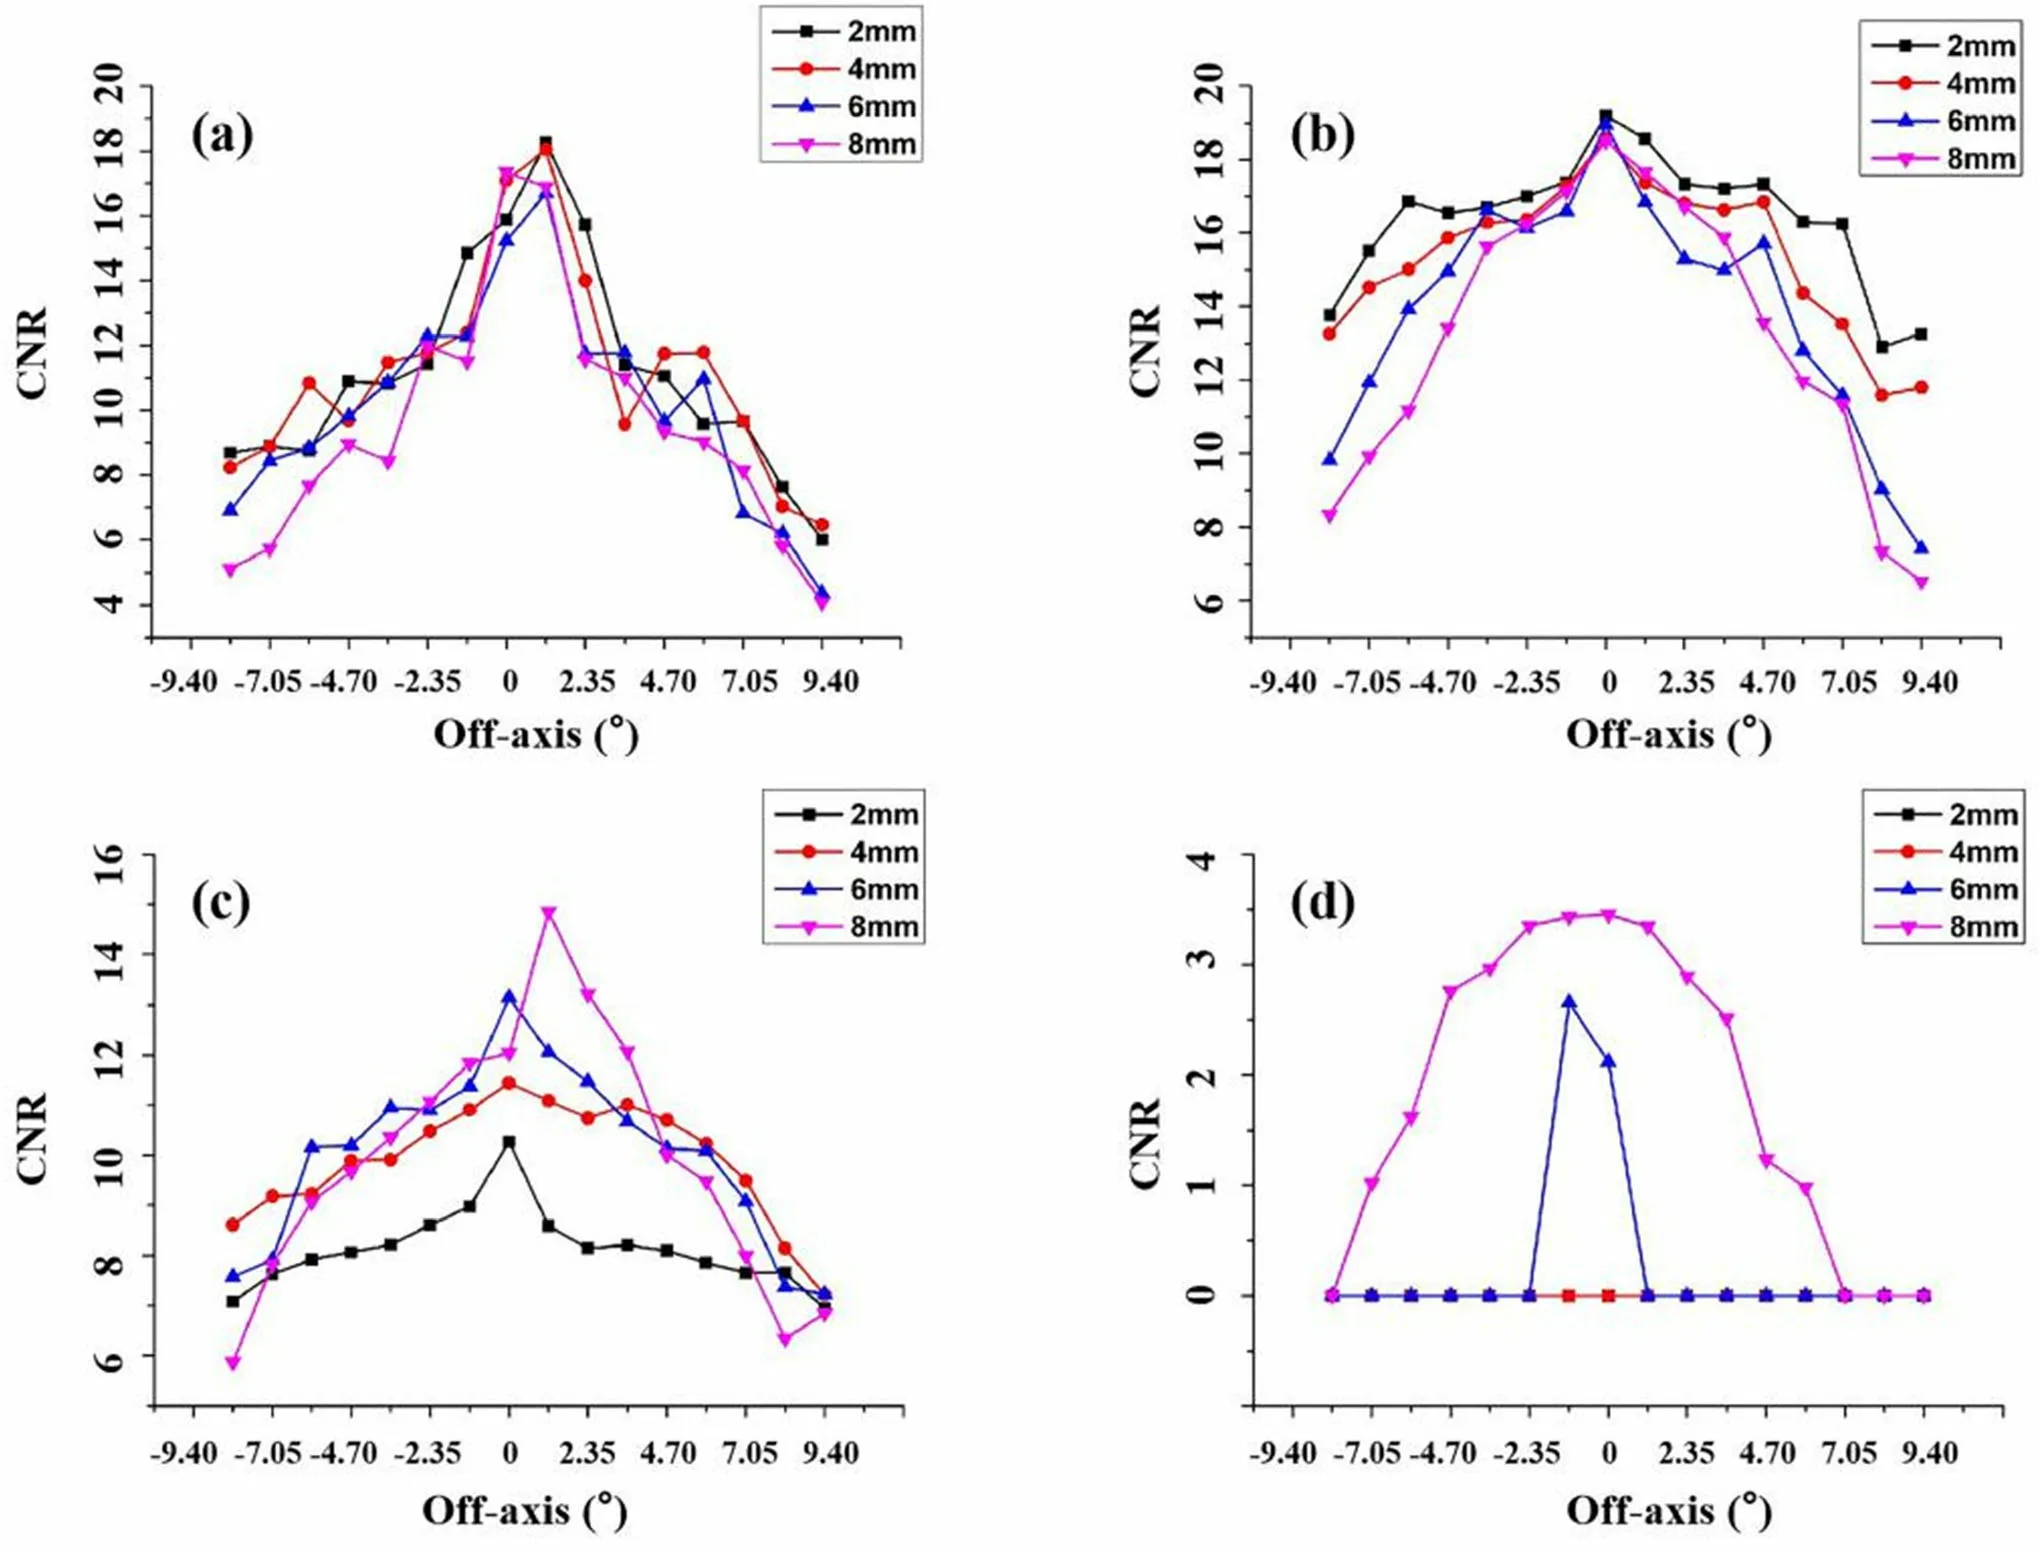
Fig. 5 (Color online)Effects of different mask thicknesses on imaging quality under different radioactive sources(simulation).Am-241(a);Co-57 (b); Ir-192 (c); Cs-137 (d)

Table 2 Theoretical parameters of cameras with different coded arrays

Fig. 6 (Color online) FOV of the rank-13 MURA-based camera and rank-16 URA-based camera under the same geometric setting
4.2 Analysis of imaging performance under Monte Carlo simulation
4.2.1 Influence of exposure time on imaging quality
The change trend of CNR over exposure time under different coded arrays is shown in Fig. 7. The abscissa plots the time and the number of photons emitted. The process of CNR value calculation at different exposure times in Fig. 7 is as follows. The source is placed at the center of the corresponding FOV of each pixel on the diagonal. We average the CNR of multiple imaging and repeat three measurements at different exposure times.
When the thickness of the mask is 4 mm,Cs-137 cannot be imaged in a short exposure time. The average CNR under rank-16 URA is 3.1 at 16 min. This is due to the weak shielding of the radiation emitted by Cs-137 by the mask and the low detection efficiency of the radiation by the detector.

Fig. 7 (Color online)Variation of imaging quality of different radioactive sources under different arrays over exposure time.Am-241(a);Co-57(b);Ir-192 (c)

Compared with the image quality, the accuracy of the reconstructed position is more worthy of attention.We call the case where the peak position of the reconstructed image does not match the theoretical position as an ‘‘erroneous reconstruction.’’On the basis of the above study,39 and 48 reconstructed images are obtained under rank-13 MURA and rank-16 URA at each exposure time,respectively.The ratio of the correctly reconstructed images to the total reconstructed images at different exposure times is calculated. The result is shown in Table 3.
4.3 Analysis of imaging performance under experimental platform
4.3.1 Measurement of the positioning accuracy of a single radioactive source
After repeated debugging, the center of the camera’s FOV in the plane is determined. The coordinate system is established by taking the plane of the source board as the coordinate plane and the line connecting the center of the detector to the center of the plane as the z-axis. The detector pixel divides the FOV at the source board into 256 rectangular areas. When the source is placed at the origin,the reconstructed image (8, 8) exhibits a peak, and the reconstructed image(8,8)can be calibrated as the center of the FOV, i.e., the spatial source position can be calculated by the reconstructed image.
Figure 8 shows the reconstruction image of different coded arrays under experimental conditions, wherein the thickness of the mask is 4 mm, and the source is placed at the center of the FOV. The imaging quality of rank-13 MURA is slightly better. In the actual application, a better image quality can be obtained through background subtraction [29].
4.3.2 Measurement of angular resolution
Angular resolution can be obtained by calculating full width at half maxima (FWHM). The radiation source ismoved from the origin to the positive direction of the x-axis at an interval of 2 mm on the plane,and each imaging is of 10 min. We record the data and calculate its azimuth and CNR. Simultaneously, we calculate the angular resolution by FWHM [30], as shown in Table 4. Experimental data show great angular resolution. The average of angular resolution is 1.29°under rank-13 MURA and 1.33°under rank-16 URA, and the difference in angular resolution between the two arrays is almost negligible.
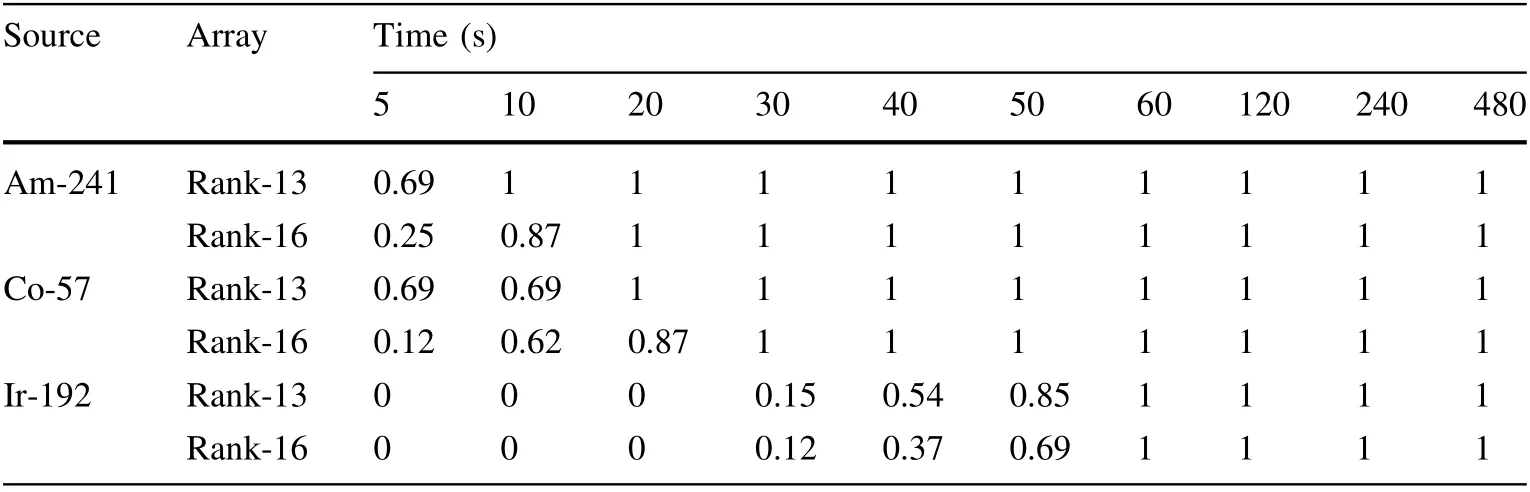
Table 3 Accuracy of imaging at different imaging exposure times
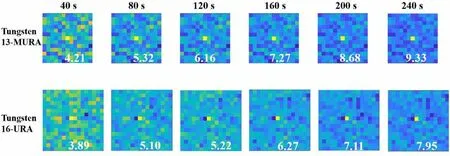
Fig. 8 (Color online) Imaging performance under different coded arrays.The red text in the picture is the CNR of the reconstructed image
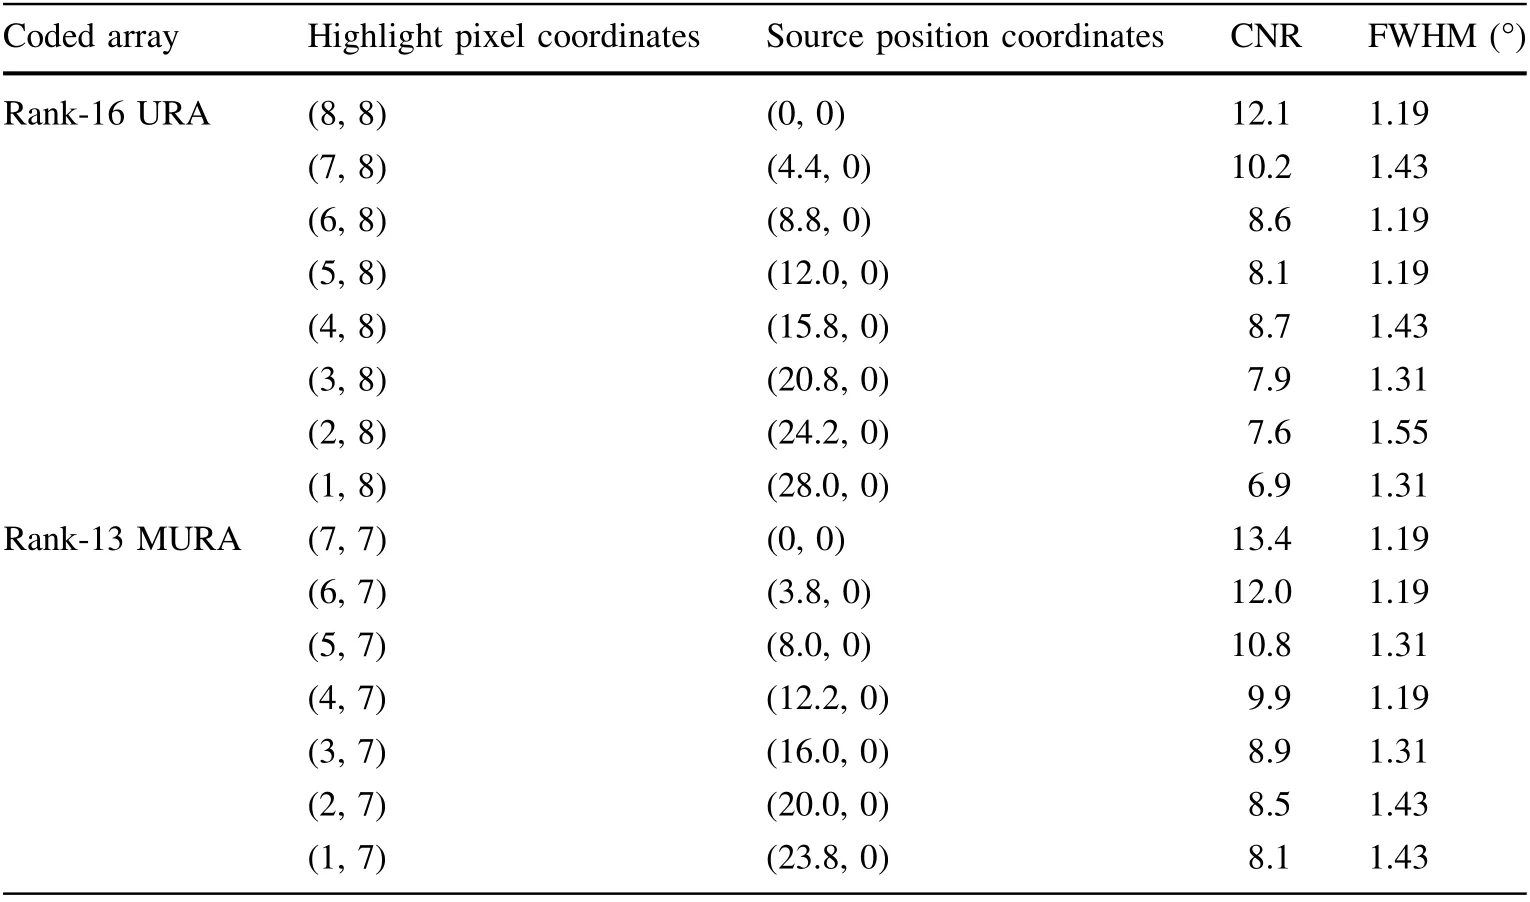
Table 4 Angular resolution measurement
5 Conclusion
In this paper,a rank-16 array was designed to maximize the use of detector pixels based on the 16 × 16 multi-pixel CZT position-sensitive detector. The same construction method can build a square array with 2n(n >1)rows and columns.Simulation and experimental data show that the imaging performance of rank-13 MURA was slightly better than that of rank-16 URA. As photon energy increased, the imaging difference gradually decreased and could even be ignored.In summary,within the acceptable range of reconstructed image quality differences,compared with the rank-13 MURA-based camera,the rank-16 URA-based camera had bigger FOV and better angular resolution, allowing rank-16 URA to have a wide range of application prospects.
杂志排行

Nuclear Science and Techniques的其它文章
- Digitalization of inverting filter shaping circuit for nuclear pulse signals
- Development of a low-loss magnetic-coupling pickup for 166.6-MHz quarter-wave beta = 1 superconducting cavities
- Scheme for generating 1 nm X-ray beams carrying orbital angular momentum at the SXFEL
- Investigating the effect of entrance channel mass asymmetry on fusion reactions using the Skyrme energy density formalism
- High-precision and wide-range real-time neutron flux monitor system through multipoint linear calibration
- Correction to: Theoretical prediction of radiation-enhanced diffusion behavior in nickel under self-ion irradiation