Assessing spatial and temporal variability in water consumption and the maintainability oasis maximum area in an oasis region of Northwestern China
2020-09-24XueXiangChangWenZhiZhaoXueLiChangBingLiuJunDu
XueXiang Chang,WenZhi Zhao,XueLi Chang,Bing Liu,Jun Du
1.Northwest Institute of Eco-Environment and Resources,Chinese Academy of Sciences,Linze Inland River Basin Research Station,Key Laboratory of Ecohydrology of Inland River Basin,CAS,Lanzhou,Gansu 730000,China
2.School of Natural Resources and Environmental Engineering,Ludong University,Yantai,Shandong 264025,China
ABSTRACT
Keywords:meta-analysis;water consumption;land-use;spatial and temporal distribution;runoff;Northwestern China
1 Introduction
Competition for water resources is increasing due to risks of severe water shortages because of climate change, rapid increases in population, and economic and social development.Interest in improving agricultural water management,especially in arid and semiarid regions, is growing among many governments, scientists, and the public (Oki and Kanae, 2006; Chenet al., 2011).In arid and semiarid regions, water resources are scarce, and water demand is higher than elsewhere (Linget al., 2013).Meanwhile, the economy in arid and semi-arid regions relies mainly on agriculture,which depends completely on irrigation.
Irrigated agriculture consumes substantial amounts of available water.Management of irrigated agriculture is under considerable pressure to reduce wateruse while maintaining high yields (Allen, 2000).The increase in demand from irrigated agriculture, combined with increasing demand from other competing and expanding sectors of the economy, necessitates highly effective agricultural water management (Toureiroet al., 2017).Under effective water management conditions, it is necessary to carefully assess longterm water utilization and requirements of agroecosystems in arid regions, improve the efficiency and sustainability of water management techniques for arable regions, and protect and maintain oases.Recently, researchers have concentrated on crop water requirements in these regions (Allen, 2000; Zhaoet al.,2010; Velpuriet al., 2013; Changet al., 2015b; Camposet al.,2017).In fact,accurate estimation of evapotranspiration at catchment and regional scales play an important role in determining irrigation measures for those regions(Tanget al.,2009).
Remote sensing combined with meteorological data is recognized as the most suitable means of mapping spatial distribution of evapotranspiration (Velpuriet al.,2013;Camposet al.,2017).However,several studies examined only relatively short time-series(e.g.,Tanget al.,2009;Liet al.,2017).However, the estimation of consumptive use of water in agriculture is important for better assessment of long-term irrigation water requirements which is imperative for efficient management of irrigation water (Hafeez and Khan,2005).
A major drawback of methods combining remote sensing with meteorological data is that availability of meteorological data is often limited, especially in near-real time and across wide areas (Cruz-Blancoet al., 2014).Furthermore, crop characteristics, irrigation type, and topographic and/or soil variability have not been considered; however, crop water use depends not only on surface atmospheric conditions, but also on crop characteristics, the type of irrigation, and topographic and/or soil variation in the region of interest(Ko and Piccinn,2009).
Arid and semi-arid regions generally exhibit basic landscape configurations, with deserts as the landscape matrix and oases as the landscape mosaic(Chenget al., 2014).Therefore, most oases are located in a large-scale desert matrix background (Figure 1)with climate conditions of drought and lack of rain.If there is water,it is an oasis,and if there is no water,it is a desert.Oases are the basis of human life and economic development, supporting more than 95% of the population in arid regions of China although they cover less than 5% of the total area of arid regions (Han,1999;Jiaet al.,2001;Liet al.,2016).The Heihe River, originating in the Qilian Mountains, is the second largest inland rive in China.The Heihe River Basin is a typical basin in the arid region of northwest China,with less than 200 mm annual precipitation in the middle and lower reaches of the basin.The basin contains the Zhangye, Jinta and Ejina oases.The economy of these oases is entirely dependent on irrigated agriculture, which accounts for 70%-86% of total water use(Zhaoet al., 2010).In these oases and elsewhere in the northwest of China,because of a lack of coordination regarding water use in the oasis agroecosystem and the natural oasis ecosystem,high water demand is accelerated.This increases the pressure on the shortage of water resources.Since 1980s,with the rapid development of economy and society in the middle reaches of Heihe River,the demand for water resources has increased sharply,and the discharge of Zhengyi Gorge in the middle reaches has decreased significantly, resulting in the degradation of natural oases and the disappearance of lakes in the lower reaches.With increasing pressure on water resources, water shortages have highlighted the importance of water resources for agricultural production in arid regions (Payeroet al.,2008).In order to curb the trend of ecological degradation in the lower reaches of Heihe River, in 2000,the Heihe River basin administration implemented the Heihe River water diversion scheme by carrying out unified water quantity dispatching.The core of the water scheme is as follows: when the annual average inflow of Yingluo Gorge reaches 1.58 billion m3, the outflow of Zhengyi Gorge reaches 950 million m3;when the water inflow from Yingluo Gorge reached 1.71 billion m3at the 25% guarantee rate, 1.09 billion m3was discharged from Zhengyi Gorge.When the 75%guarantee rate of Yingluo Gorge reaches 1.42 billion m3,the amount of water discharged from Zhengyi Gorge is 760 million m3.When the 90% guarantee rate of Yingluo Gorge reaches 1.29 billion m3, 630 million m3of water is discharged from Zhengyi Gorge.When the water comes in from other guarantee rates, the quantity of discharge from Zhengyi Gorge should be calculated by linear interpolation according to the above guarantee rates.It is expected that through this water diversion scheme, reasonable allocation of water resources in the middle and lower reaches will restore the oasis to the level of the mid-1980s.Under these conditions, it is necessary to carefully determine water use and requirements of these oases.Additionally, meteorological observatories are scarce in this region, and the amount of existing meterorologicla data is not sufficeint for the demand of the method, which the remote sensing combined with meteorological data.Meta-analysis provides a new chance.In meta-analysis, results of each independent experiment are usually represented as an index of effect, and then influence estimates are combined into different studies to obtain a summary of the study results (Hedgeset al., 1999; Baiet al., 2013).Thus, we used the meta-analysis method to analyze evapotranspiration of the Zhangye Oasis of arid NorthwesternChina.The meta-analysis results were used to build the response ratio of evapotranspiration, and finally evapotranspiration was simulated for the Zhangye Oasis in arid Northwestern China(Zhaoet al.,2018).
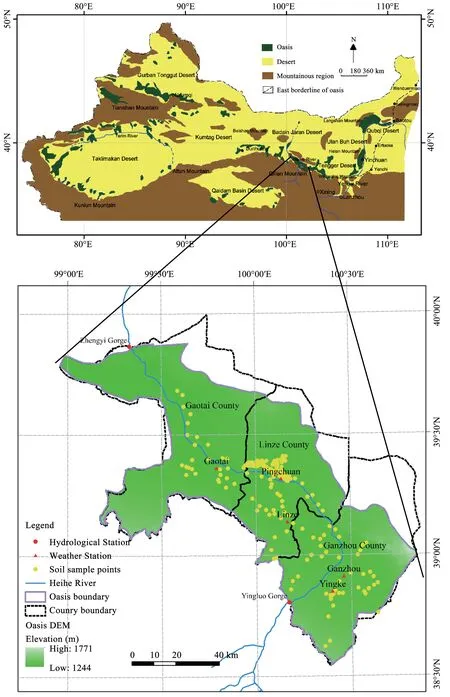
Figure 1 Map of Zhangye Oasis and its location in the arid and semi-arid region of Northwest China
The objectives of this study were: (a) analyze the spatial and temporal distribution of land-use in the Zhangye Oasis region during 2000 to 2016 growing-seasons, (b) to fill the gap in long-term spatial and temporal variability trends of growing-season water consumption.Specifically, we used a 17-year MODIS image time-series for 2000-2016 to characterize both spatial and temporal trends in water consumption in farmland and oasis protection systems in the arid zone of Northwestern China.(c) to determine and maintain the maximum Zhangye Oasis area according to Heihe River runoff.We also explored the suitable management method of water resources in Zhangye Oasis.We hypothesize that the level of water consumption in farmland and the protection zone of Zhangye Oasis is attributable to soil and crop characteristics, but that soil properties changed little during the 17 years and can be ignored in this study.
2 Methods
2.1 Study area
Figure 1 shows the location of the study sites in the Zhangye Oasis in the middle Heihe River Basin,Northwest China(38°32'-39°59'N,98°57'-100°52'E).This study was conducted during the 2000-2016 growing seasons and the study region contains a total area of 8,617.8 km2.The administrative division of Zhangye Oasis belongs to Zhangye City, Gansu Province, and includes Gantai, Linze, and Ganzhou counties, which account for nearly 80% of the Zhangye City area.In this study region, from 1970 to 2010,the mean annual air temperature was 7.6°C,and the maximum and minimum temperatures were 39.1 °C and -27.3 °C, respectively.Mean precipitation was 120.0 mm, and about 65% of the total rainfall falls between July and September, and the average of pan evaporation was 2,390.0 mm.The zonal soils are mainly Ari-Sandic Primosols, Ustic Cambosols, Siltigi-Otrthic Anthrsols and Calci-Orthic Aridosols.Irrigation agriculture forms the backbone of this region's economy.The Heihe River is the only river in Zhangye Oasis.From Yingluo Gorge, the Heihe River flows into the middle reaches, flows through Zhangye Oasis, then passes through Zhengyi Gorge, enters the lower reaches, and finally enters Juyan Sea of Ejina Banner of Inner Mongolia.i.e.,Yingluo Gorge and Zhengyi Gorge serve as the boundary of the upper, middle and lower reaches of the Heihe River Basin.
2.2 Methodology
2.2.1 Land Uses
In this study,land type use are divided into five categories, namely, maize, wheat, vegetables and fruit,shelterbelts, and shrubwood.Vegetation types are distinguished according to the difference of NDVI across crop growth season and different growth stages (Zhaoet al., 2018).NDVI data is derived from the 16-day MODIS NDVI products (MOD13Q1), which were downloaded from USGS (http://e4ftl01.cr.usgs.gov/MOLT/MOD13Q1.005) for the period from April 23rdto September 30th, 2000-2016 for a 250 m MODIS pixel.
Data for forest land were obtained from HiWATER: land cover map of the Heihe River Basin (Cold and Arid Region Science Data Center (http://westdc.westgis.ac.cn)).
2.2.2 Water-consumption
Water consumption (W) consists of evapotranspiration(ET)and infiltration(I)in a pixel:

For many years, research on evapotranspiration mainly focused on the evapotranspiration of maize because the area of maize planting was the largest of crops grown in Zhangye Oasis.Therefore,evapotranspiration was defined based on the model used by Zhaoet al.(2018):

whereETkjvis evapotranspiration injgrid during theu-growth period,krepresented vegetation type.ETmmis the standard evapotranspiration of maize.f(x) is the root-water-uptake reduction function (dimensionless).NDVIis the value of Normalized Difference Vegetation Index in a grid during a vegetation growth period.uis year (2000, 2001, …, 2016),iis MODIS imagenduring theu-growth period,i=1,2,3,…,n,andjis all grid number about a kind of vegetation within oasis during theu-growth period,j=1,2,3,…,m.
In this study area, in order to maximize economic benefits, farmland is irrigated as much as possible to maintain soil moisture to ensure crop growth, and to make soil moisture far exceed crop needs.Through frequent irrigation, soil moisture is always kept above field capacity.Considering that the crop growth is not limited when the soil moisture is maintained at a 70%of field holding water (Suet al., 2002),f(x) is defined as following:
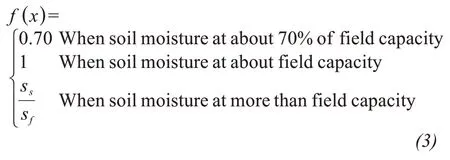
wheressandsfare saturation moisture capacity and field capacity,respectively.
ETmmwas obtained by meta-analysis method based on all published literature data about this region in the ISI Web of Science.When searching the published literature data in the ISI Web of Science for meta-analysis, any new relevant literature was not found.Thus,ETmmwas used from published research results of Zhaoet al.(2018)which is 655.91 mm,with 20.53 mm standard deviation, which was significantly >0 (n=23,t=1.71,α=0.05)(Zhaoet al.,2018).
As with evapotranspiration, considering watering frequency and infiltration different for different crops during the growing period to obtain infiltration records about different plants,Iwas determined based on the model used by Zhaoet al.(2018):

whereIkjuis the infiltration ofkkind of vegetation injgrid during theu-growth period,ICmis the irrigation infiltration constant for maize based on four years of continuous observations at the Linze Inland River Basin Research Station, with a mean of 184.9 mm (unpublished data).ETmwis evapotranspiration of maize in the nearestwgrid.Scj,Scm,Sc max, andSc minare soil bulk density injgrid, mean soil bulk density in all grids, maximum and minimum soil bulk density in all grids in the oasis,respectively.
We predicted soil water parameters over the region using 235-point soil data from a mapped reference area(Figure 1).At each sampling point, soil was collected with a 200-cm3soil-corer at intervals of 20 to 100 cm depth, with three replicates; analysis methods followed those of Liu (1996).Averages of the values for sampling points were used as a final measurement value.The averages were interpolated with Gaussian kriging interpolation method(Goovaerts,1997),and spatial distribution of soil parameters is presented in Figure 2.In Figure 2, soil moisture capacity in the farmland and its protection system ranged from 21.0% to 33.0% at saturation,and between 21.0% and 31.5% at field capacity;soil bulk density ranged from 1.36 to 1.58 g/cm3.
For shelterbelts in this region, irrigation infiltration is calculated by the same method as that of maize farmland because its irrigation management measures are the same as those of maize farmland.Shrubland do not need irrigation because they depend on groundwater and precipitation for growth and survival.Therefore,its infiltration was zero.
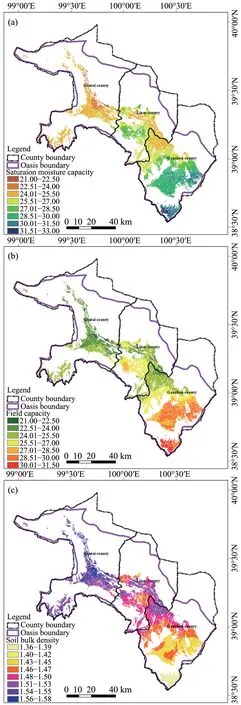
Figure 2 Spatial distribution of soil parameters in Zhangye Oasis.(a)Saturation moisture capacity,(b)Field capacity,and(c)Soil bulk density
In order to determine a better level of water consumption, oasis water consumption is defined as the maximum (Wmax), optimum (Wopt) and minimum (Wmin)water consumption whenf(x) is 0.7, 1.00, andrespectively.Whenf(x)issoil moisture far exceeded the needs of crops.The minimum, optimal and maximum water consumption of the oasis can be quantitatively studied, and specific data information of water consumption in different management modes can be provided for the watershed management department.Through the comparison of this information, support is provided for decision-making in the process of water resources management.This will be beneficial to the effective management and sustainable utilization of water resources in Heihe Oasis.Certainly, this is consistent with the fact that the farmer pursues the maximum economic benefit of irrigation in order to protect soil moisture.Therefore, maximum water consumption is also the actual oasis water consumption(WA).
2.2.3 Runoff of Heihe River enteringZhangye Oasis
Runoff data in this study is derived from 2000 to 2016 of measured discharge from the Yingluo Gorge Hydrologic Station.This data could reflect the variation tendency of incoming water quantity of Heihe River into the oasis in the middle reaches.The Yingluo Gorge Hydrological Station was set up in 1943.
3 Results
3.1 Land-use in the oasis
From 2000 to 2011, Zhangye Oasis area expanded from 19.68×10⁴hm2to 22.35×10⁴hm2; subsequently,the area shrunk to 22.22×10⁴hm2from 2011 to 2016(Figure 3a).Since 2000, the area of shelter forests in Zhangye Oasis remained stable, and the area of maize, wheat, vegetables + fruit, and their spatial distribution changed greatly (Figure 3b, Figure 4).From 2000 to 2016, the planting area of maize varied from 13.19×10⁴to 16.92×10⁴hm2, with a variable coefficient of 12.70;the planting area of wheat ranged from 0.55×10⁴to 3.72×10⁴hm2, with a variable coefficient of 60.72; the planting area of vegetables + fruit ranged between 1.27×10⁴and 5.09×10⁴hm2, with a variable coefficient of 46.14; the area of shelter belts was between 0.09×10⁴and 0.14×10⁴hm2, with a variable coefficient of 19.74; the area of shrub lands ranged from 0.12×10⁴to 0.14×10⁴hm2, with a variable coefficient of 5.90(Table 1).
A Survey of TCM Health Tourism Demonstration Base based on the Traversing Method______________________________LI Xintai,MO Yingning 43
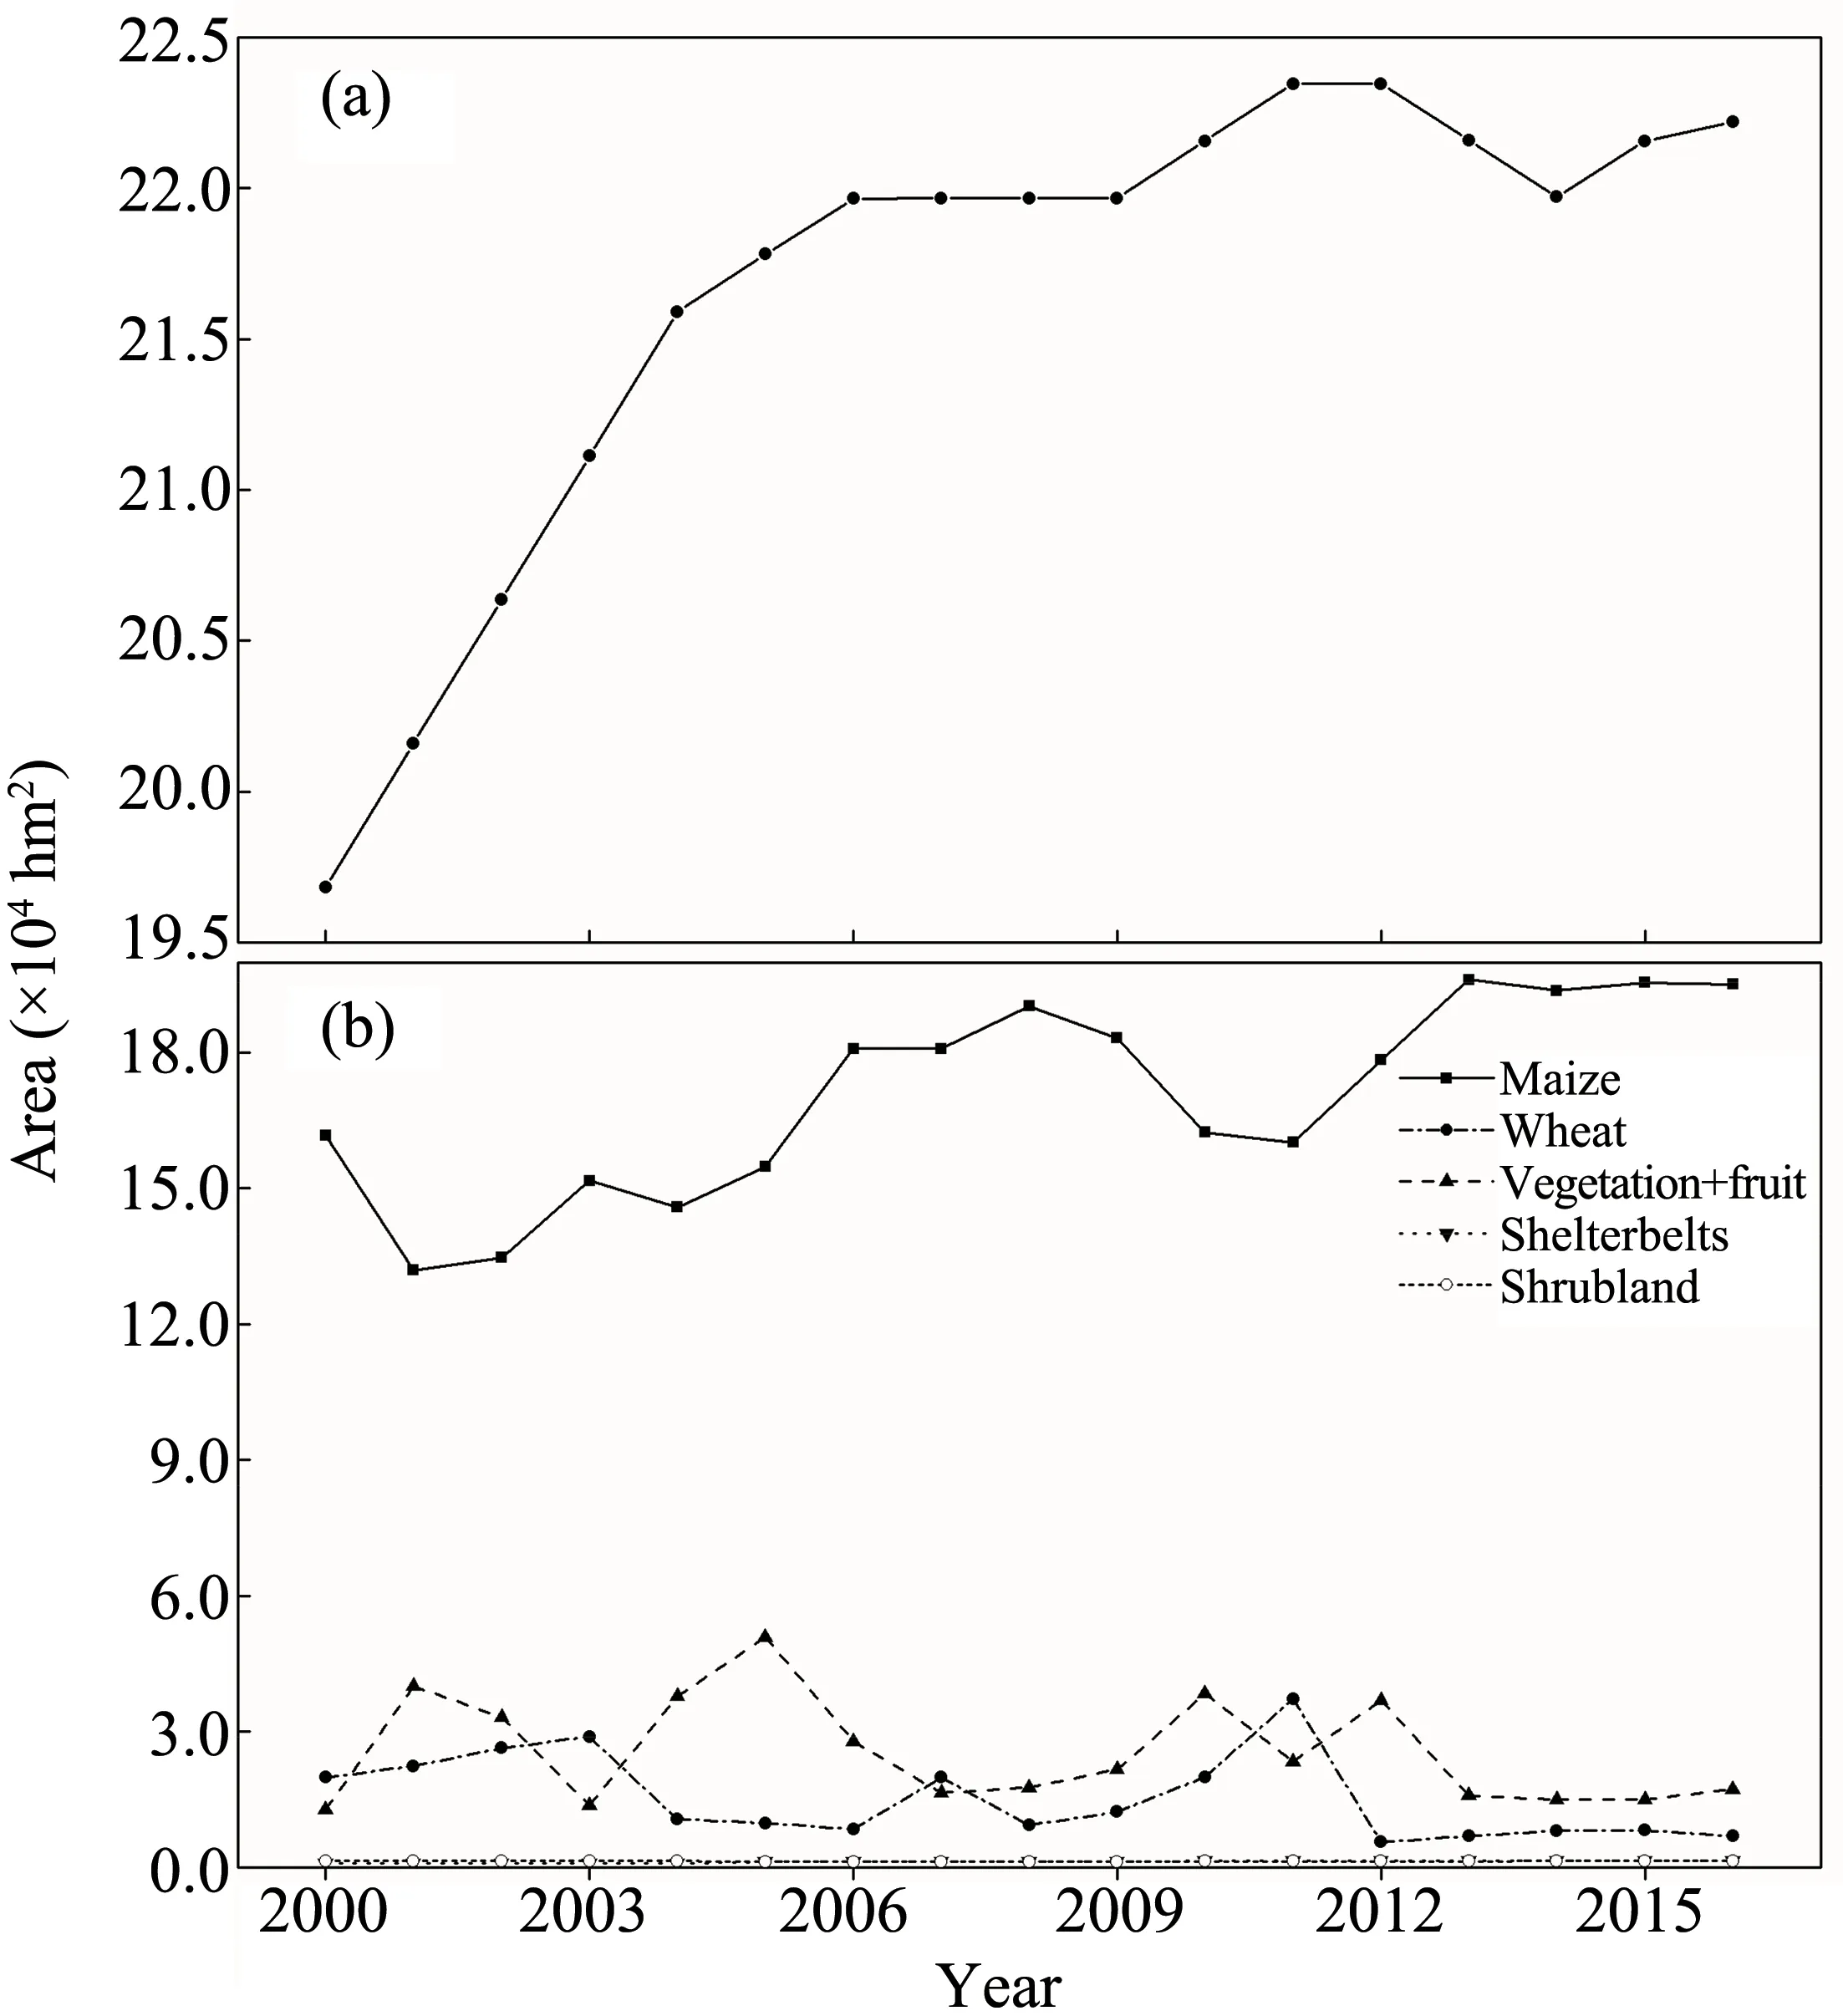
Figure 3 Land-use in Zhangye Oasis in Northwestern China from 2000 to 2016.(a)Trends in oasis area,(b)Planting structure
3.2 Oasis water consumption
3.2.1 Actual water consumption
The actual water consumption in Zhangye Oasis from 2000 to 2016 (Figure 5) at levels of <218 mm was found for 3.01% and 6.29% of total oasis area, at 219 to 358 mm for 5.04% to 11.52% of the area, at 359-471 mm for 8.10% to 18.28% of the area, at 472 to 569 mm for 12.25% to 17.70 % of the area, at 570 to 655 mm for 13.39% to 23.11% of the area,at 656 to 734 mm for 14.63% to 26.94% of the area, at 735 to 820 mm for 9.86% to 19.87% of the area,and at levels of >821 mm for 2.12% to 16.72% of the area (Table 2).As a whole, actual water consumption in Zhangye Oasis ranged from 11.35×10⁸m3to 13.73×10⁸m3, with a mean of 12.89± 0.60×10⁸m3during the growing season from 2000 to 2016(Figure 5i,Table 3).

Table 1 Land use statistics from 2000 to 2016 for Zhangye Oasis
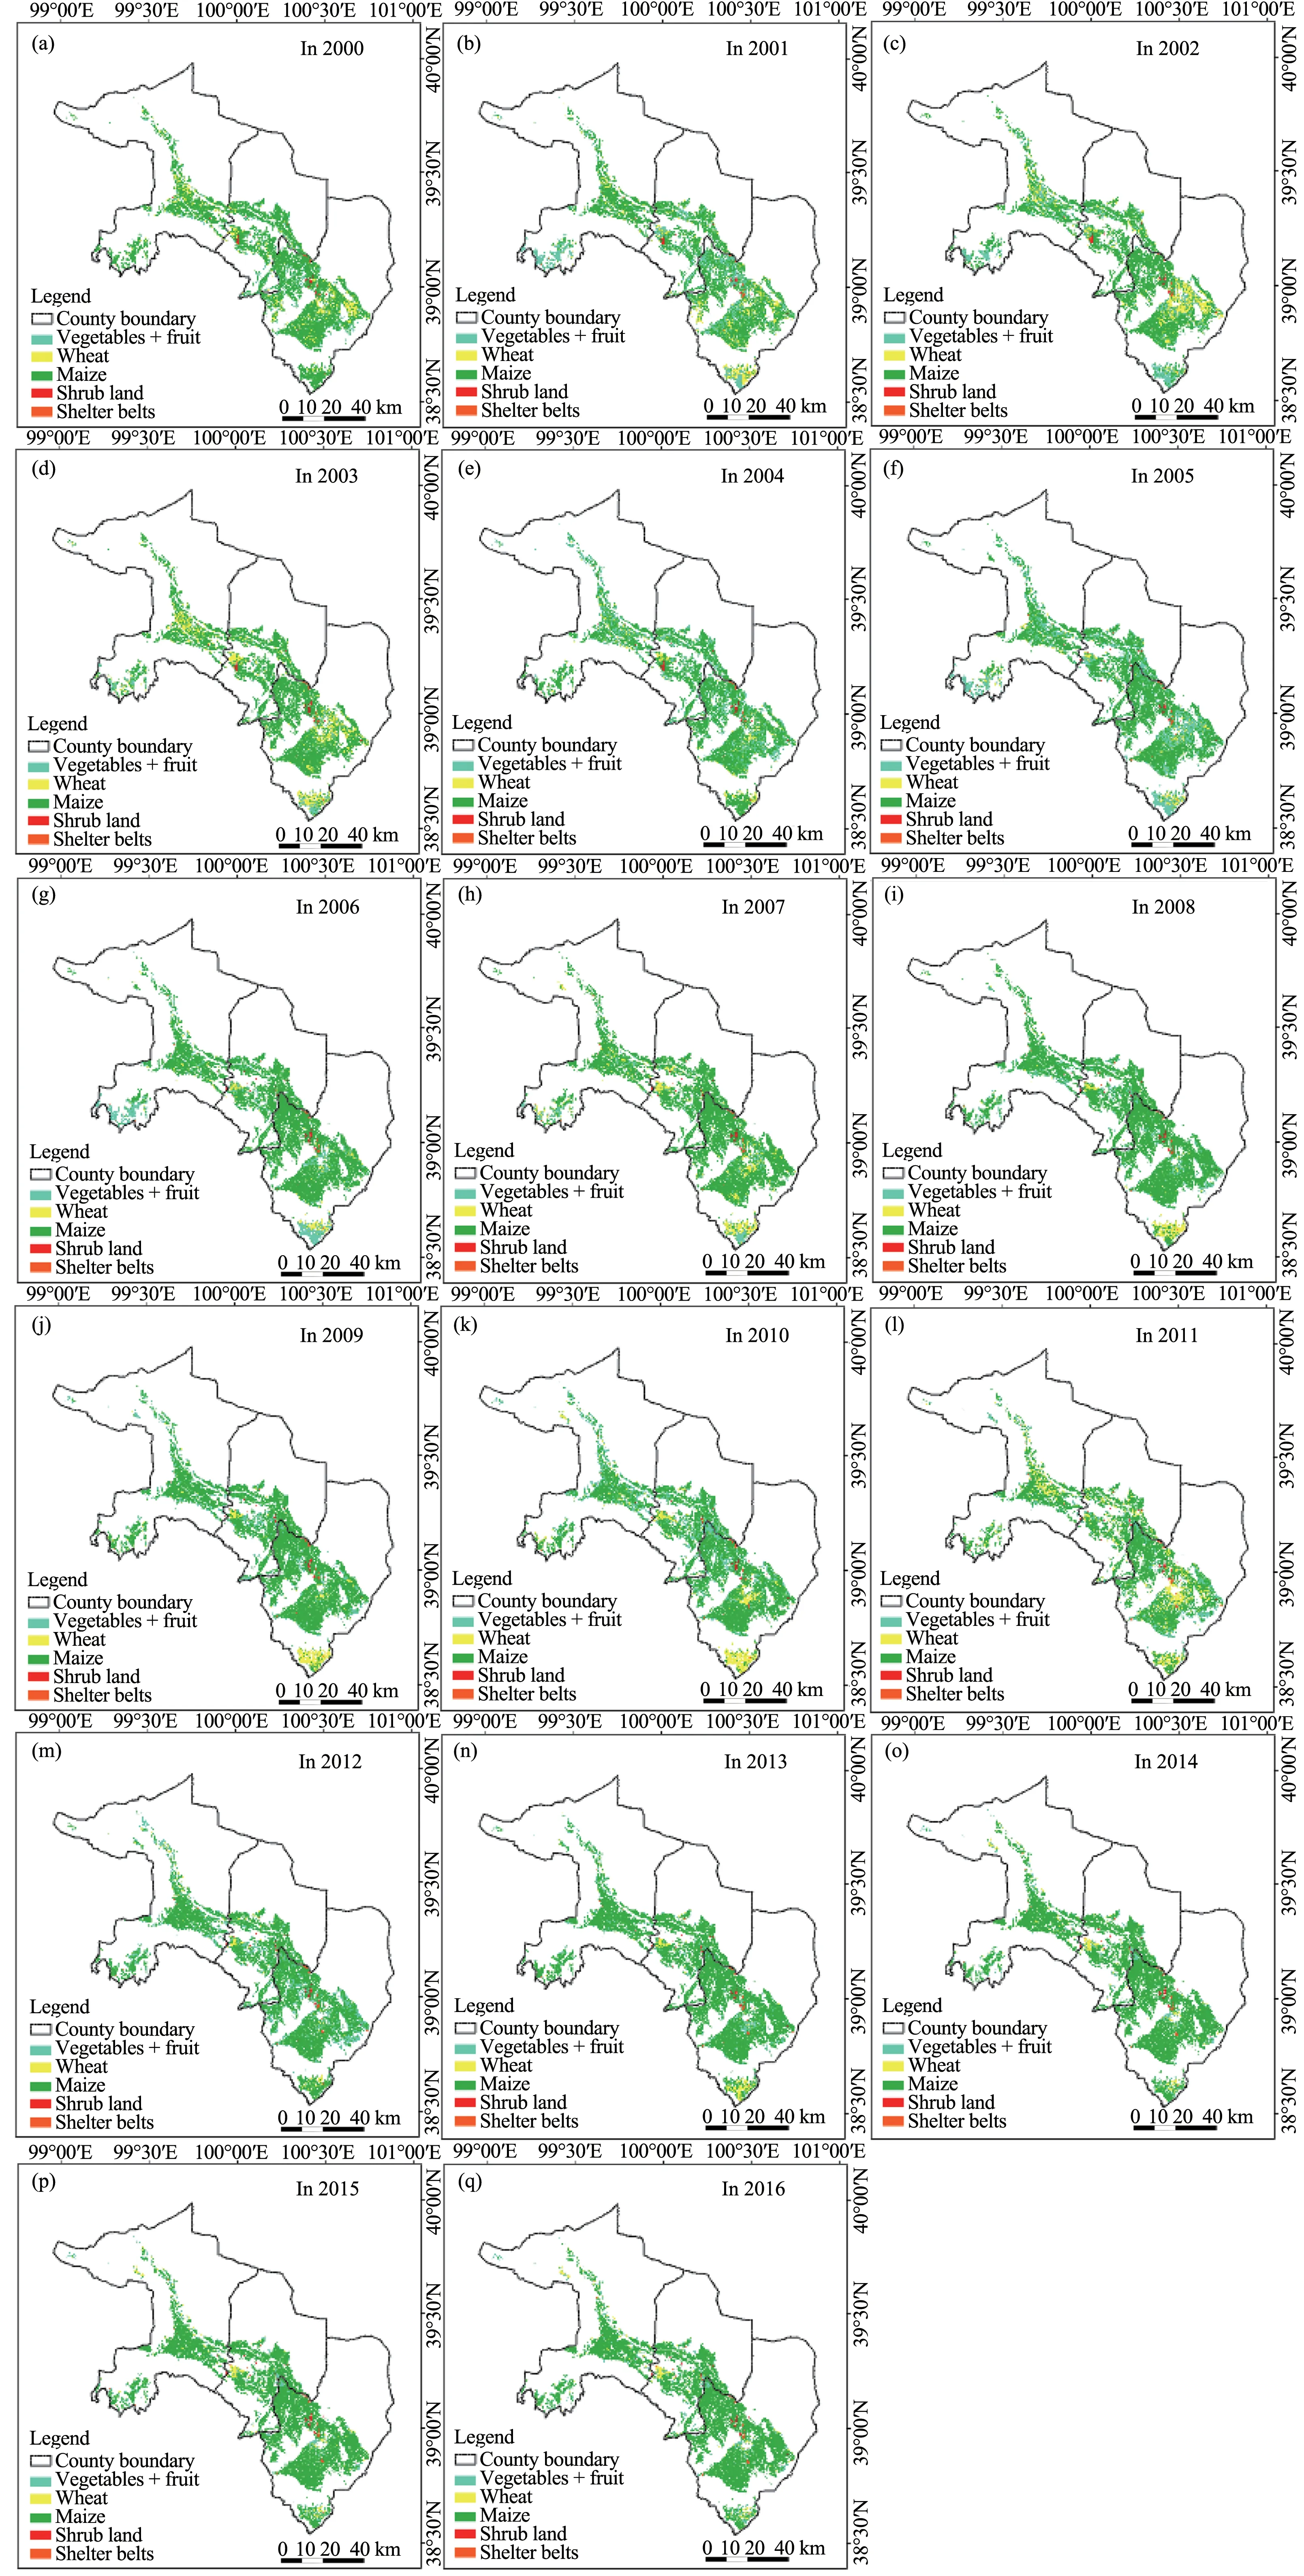
Figure 4 Spatial and temporal distribution of land-use in Zhangye Oasis from 2000 to 2016
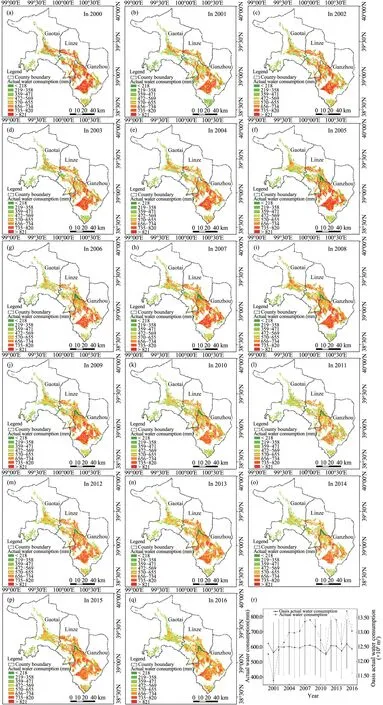
Figure 5 Spatial distribution and variability in actual water consumption during the 2000-2016 growing seasons in Zhangye Oasis.Spatial distribution in(a)2000,(b)2001,(c)2002,(d)2003,(e)2004,(f)2005,(g)2006,(h)2007,(i)2008,(j)2009,(k)2010,(l)2011,(m)2012,(n)2013,(o)2014,(p)2015,(q)2016,(r)the mean maximum water consumption per year from 2000 to 2016(bold line with filled circles,bars represent standard deviation of the mean)and oasis maximum water consumption(dash line with filled squares)
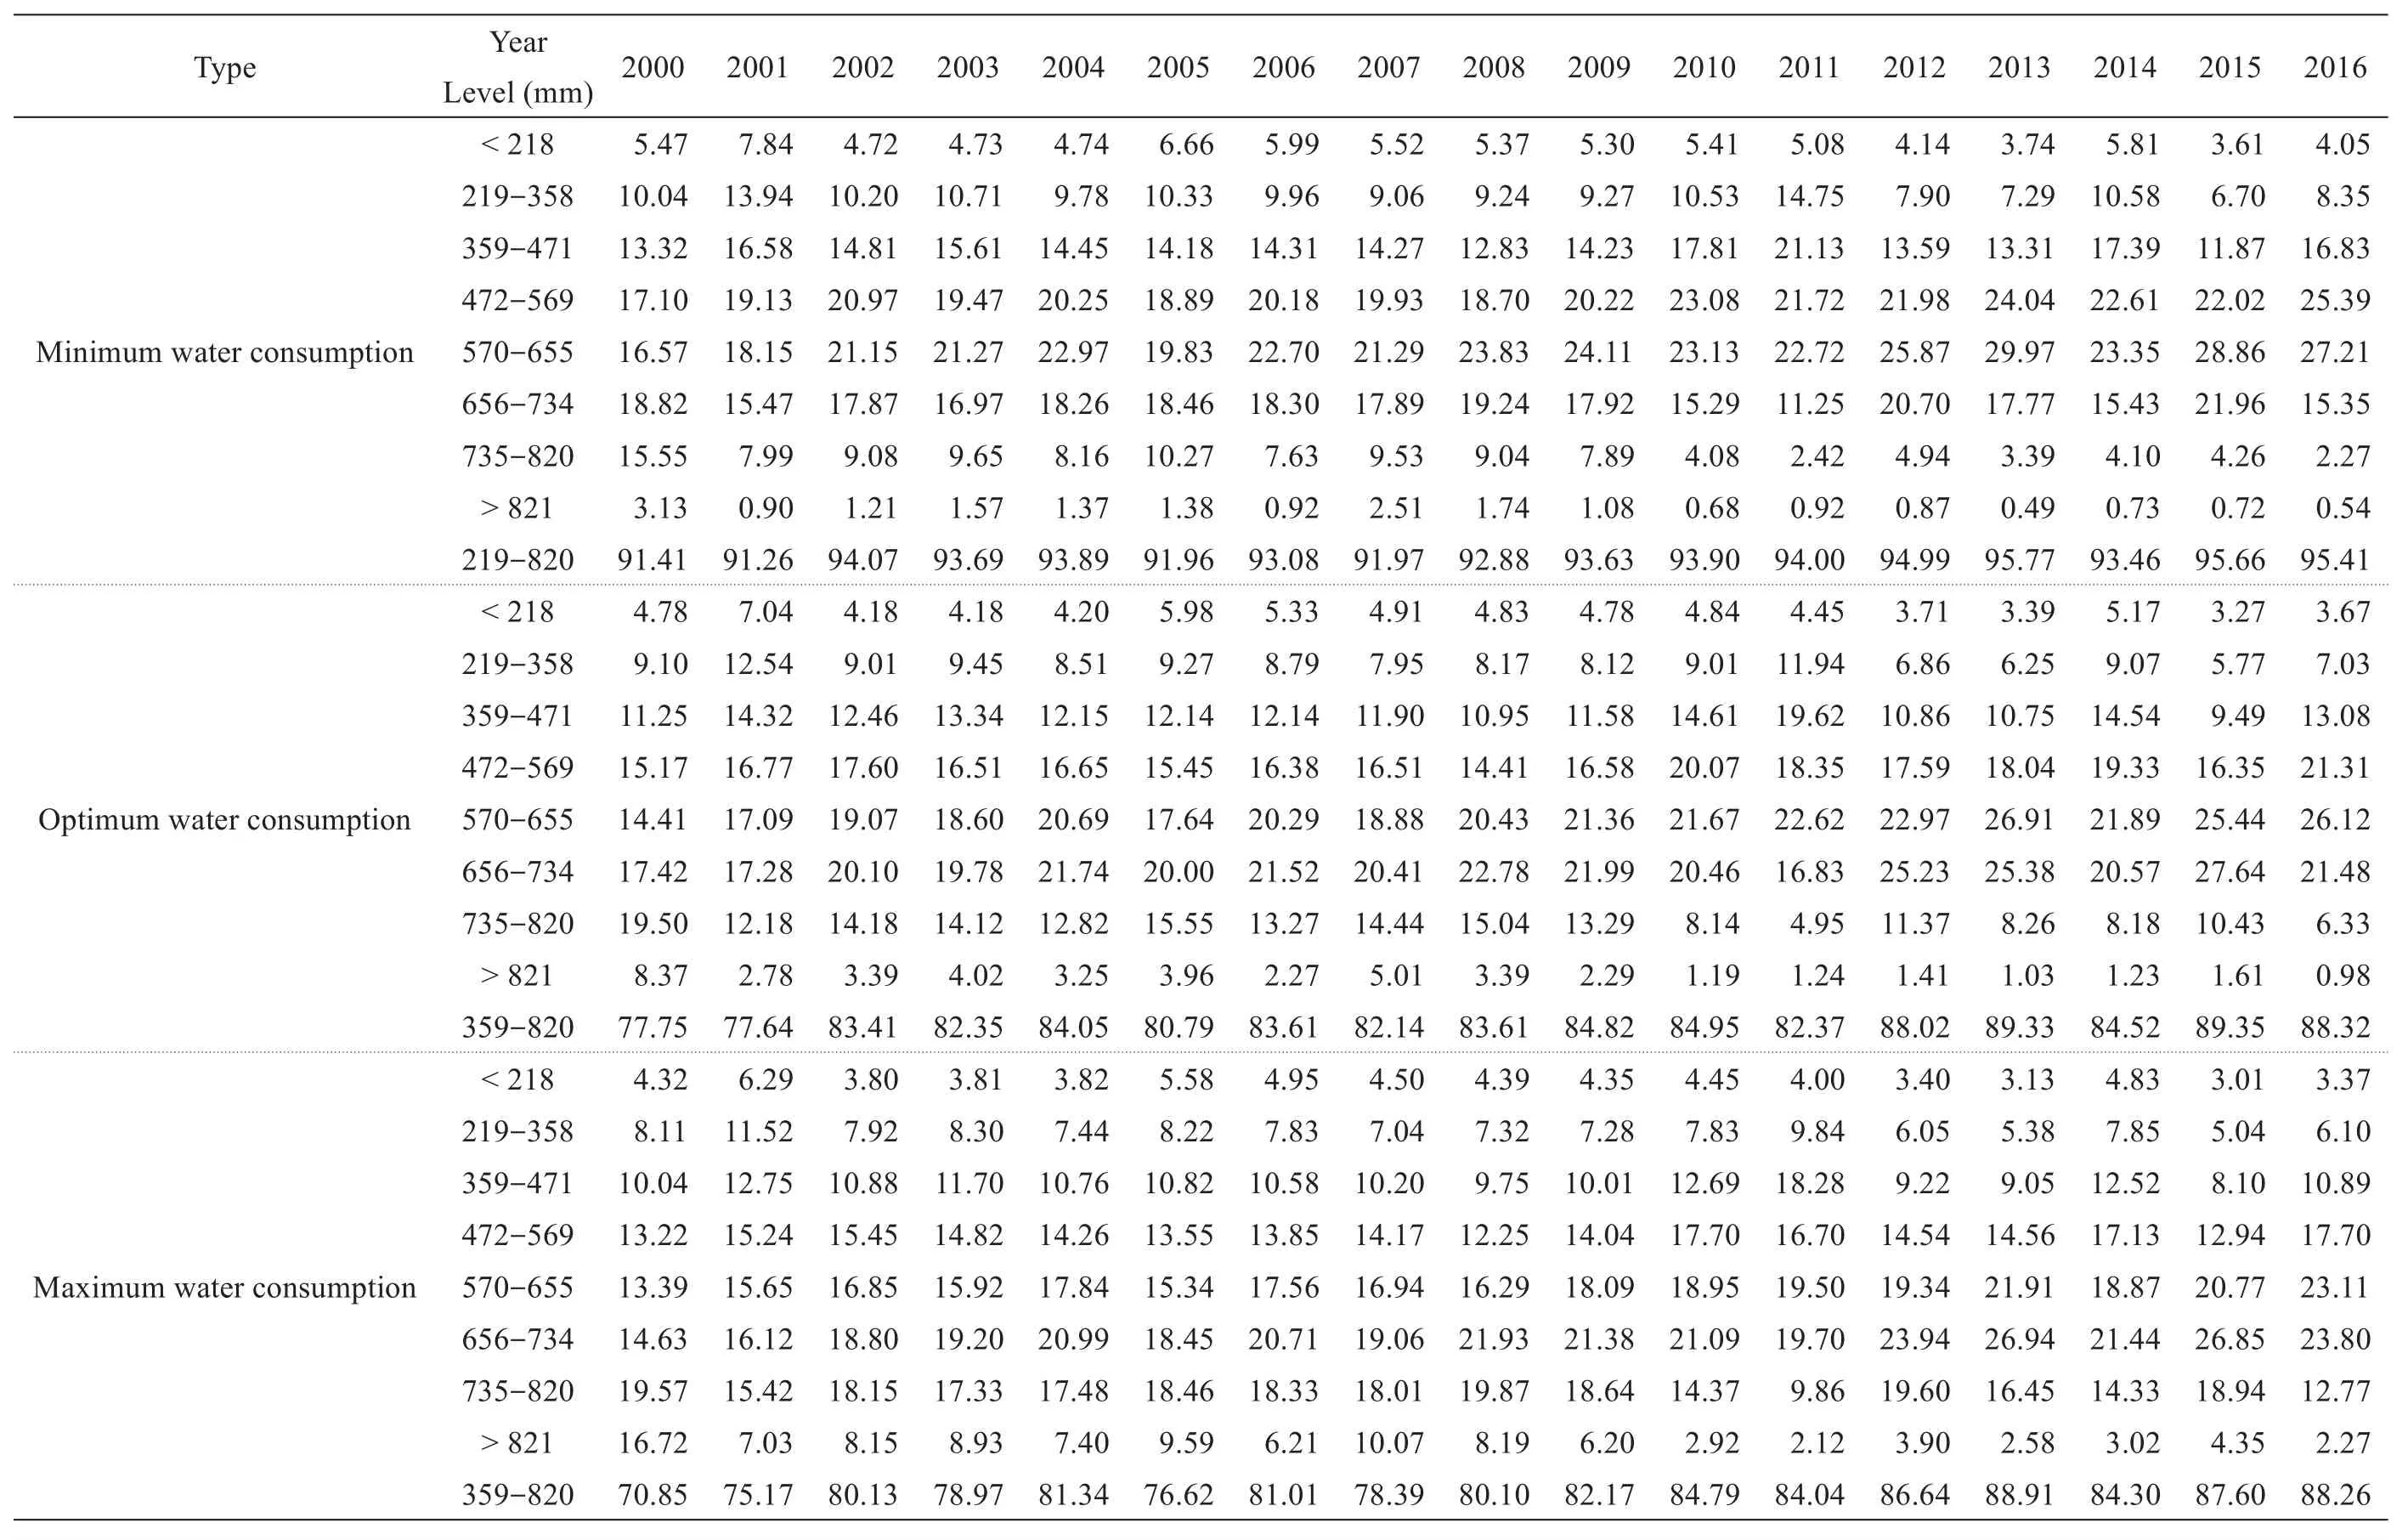
Table 2 Proportion of areas in optimum water consumption level to total oasis from 2000 to 2016

Table 3 Water consumption statistics during the growing season from 2000 to 2016 in Zhangye Oasis
3.2.2 Optimum water consumption
Optimum water consumption from 2000 to 2016(Figure 6)at levels of <218 mm was found for 3.27%and 7.04% of the total oasis area, at 219-358 mm for 5.77% to 12.54% of the area, at 359 to 471 mm for 9.49% to 19.62% of the area, at 472 to 569 mm for 14.41% to 21.31% of the total oasis area, at 570 to 655 mm for 14.41% to 26.91% of the area, at 656 to 734 mm for 16.83% and 27.64% of the total oasis area,at 735 to 820 mm for 4.95%and 19.50%of the area, and at levels of >821 mm for 0.98% to 8.37% of the total oasis area (Table 2).As a whole, optimum water consumption in Zhangye Oasis ranged from 10.81×10⁸to 13.07×10⁸m3, with a mean of 12.27±0.57×10⁸m3during the growing season from 2000 to 2016(Figure 6i,Table 3).
3.2.3 Minimum water consumption
Minimum water consumption from 2000 to 2016 at levels of <218 mm was found for 3.61% to 7.84 % of the total oasis area, at levels 219-358 mm for 6.70% to 14.75% of the area,at 359-471 mm for 11.87% to 21.13% of the total oasis area, at 472-569 mm for 17.10% to 25.39% of total oasis area, at 570-655 mm for 16.57% to 29.97% of total oasis area, at 656-734 mm for 11.25% to 21.96% of total oasis area, at 735-820 mm for 2.27% to 15.55% of the area, at >821 mm for 0.49% to 3.13% of the area(Table 2).As a whole, minimum water consumption ranged from 10.24×10⁸to 12.37×10⁸m3, with a mean 11.62±0.53×10⁸m3during the growing seasons from 2000 to 2016 in Zhangye Oasis (Figure 7i,Table 3).
3.3 Maintaining maximum Zhangye Oasis area
There is a significant difference in Heihe River runoff entering Zhangye Oasis in each month of the year(Figure 8a).Within a year,the Heihe River,which entered Zhangye Oasis in July,had the largest runoff of 3.61±0.81×10⁸m3; The minimum in February, with runoff of only 0.39±0.07×10⁸m3.Runoff was mainly concentrated in the growing season from March to October, and reached 93.10% of annual runoff (RA).From 2000 to 2016, annual runoff varies from 13.06×10⁸m3to 22.20×10⁸m3and the growth rate is 0.43×10⁸m3,with the largest annual runoff occurring in 2016 and the smallest in 2001; The variation range of runoff in the growth season is between 11.93 ×10⁸m3and 20.71×10⁸m3and the growth rate is 0.42×10⁸m3,and the maximum annual runoff is in 2016,with the smallest occurrence in 2001(Figure 8b).
Considering that agricultural water is mainly used in the growing season,we produced a statistical analysis of the relationship between Heihe River runoff and oasis area in that season.For the growth season runoff(RG)and the oasis area(A),a logistic function relationship was found (Figure 8c), which the variability of the oasis area was 47%(n=17):

when using theFtest, the correlation was significant at the 0.05 level.According to theFtest,F(0.05, 2, 14) is 3.74,Fis 6.39.WhereF(0.05, 2, 14)is the critical value of theFdistribution, with 1 and 16 degrees of freedom and a significant level of 0.05,Fis a statistic value of theFdistribution.This logistic function shows that Zhangye Oasis can only maintain a maximum area of 22.49×10⁴hm2according to runoff in the growing season.That is to say,the current oasis area is close to the critical maximum area.However, this logistic function of oasis area to growth season runoff variable explained 47%of the variation in the oasis area.This shows that the change in runoff in the growth season is not the only reason for determining changes in the oasis area.According to the water diversion plan implemented since 2000, the Heihe River runoff for Zhangye Oasis is certain to be lower than that during the growing season.To maintain the stability and sustainable development of Zhangye Oasis, reducing the oasis area is also a wise choice.
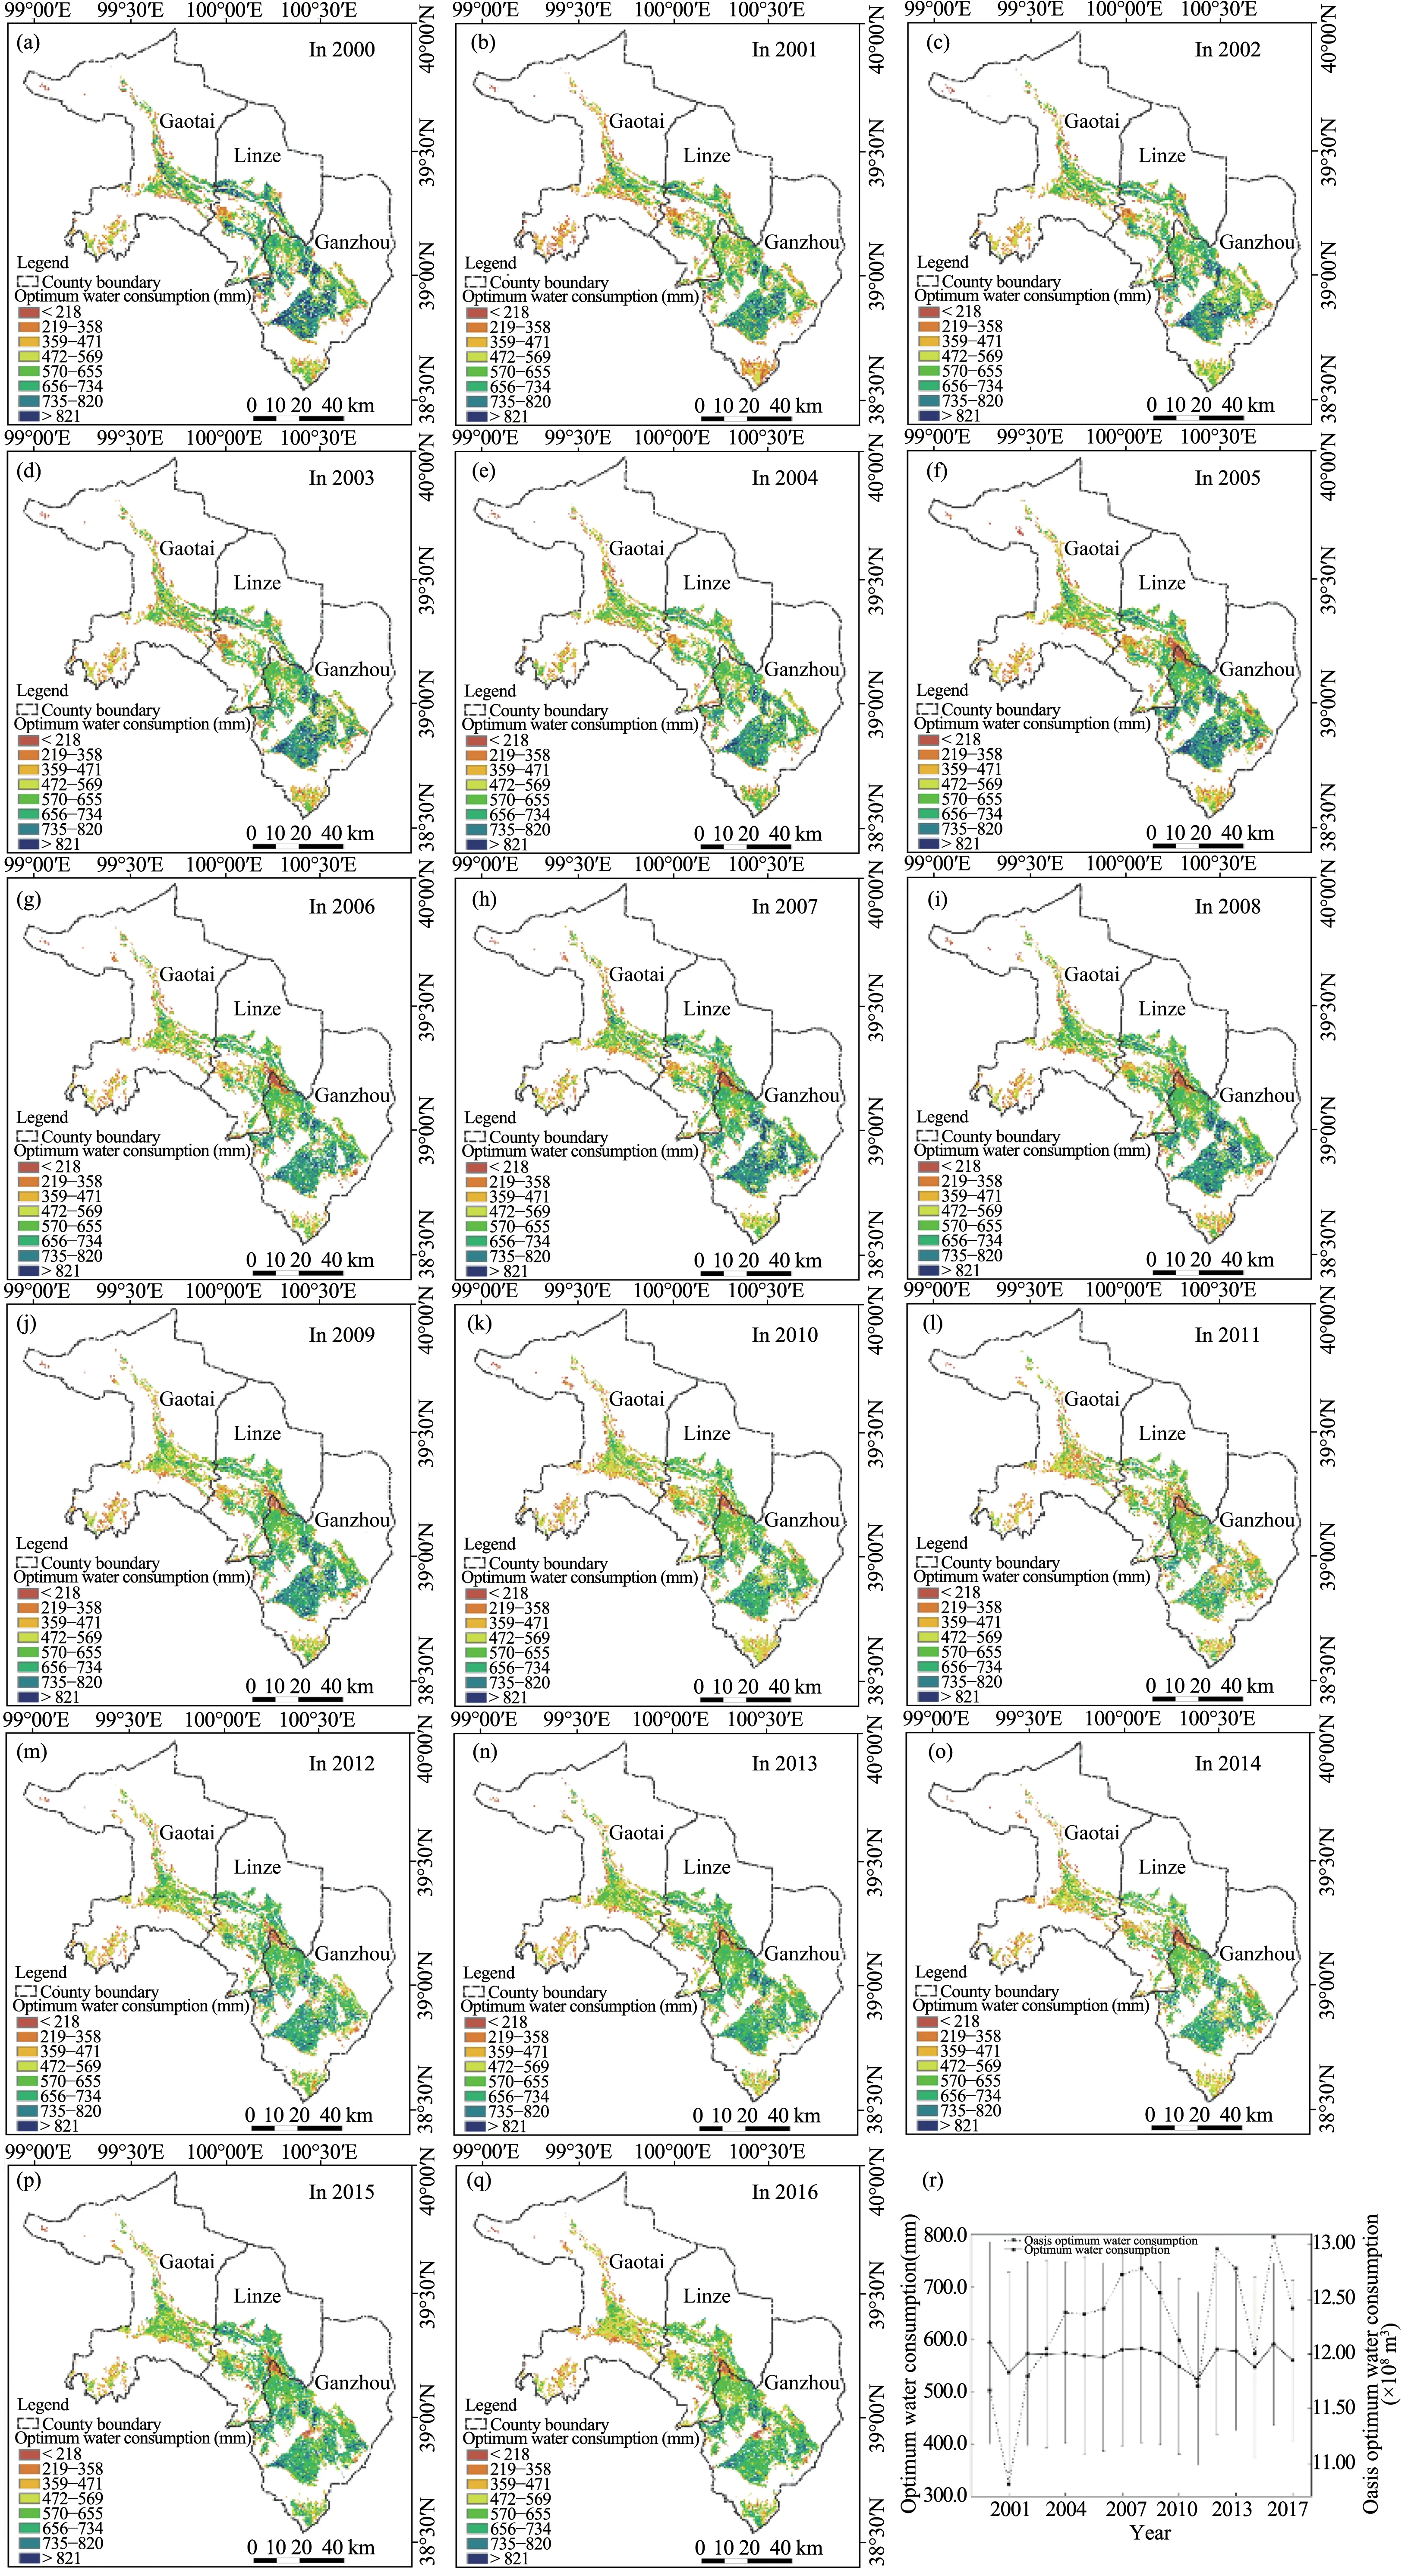
Figure 6 Spatial distribution and variability in optimum water consumption during the 2000-2016 growing season in Zhangye Oasis.Spatial distribution in(a)2000,(b)2001,(c)2002,(d)2003,(e)2004,(f)2005,(g)2006,(h)2007,(i)2008,(j)2009,(k)2010,(l)2011,(m)2012,(n)2013,(o)2014,(p)2015,(q)2016,(r)the mean optimum water consumption per year from 2000 to 2016(bold line with filled circles,bars represent standard deviation of the mean)and oasis optimum water consumption(dash line with filled squares)
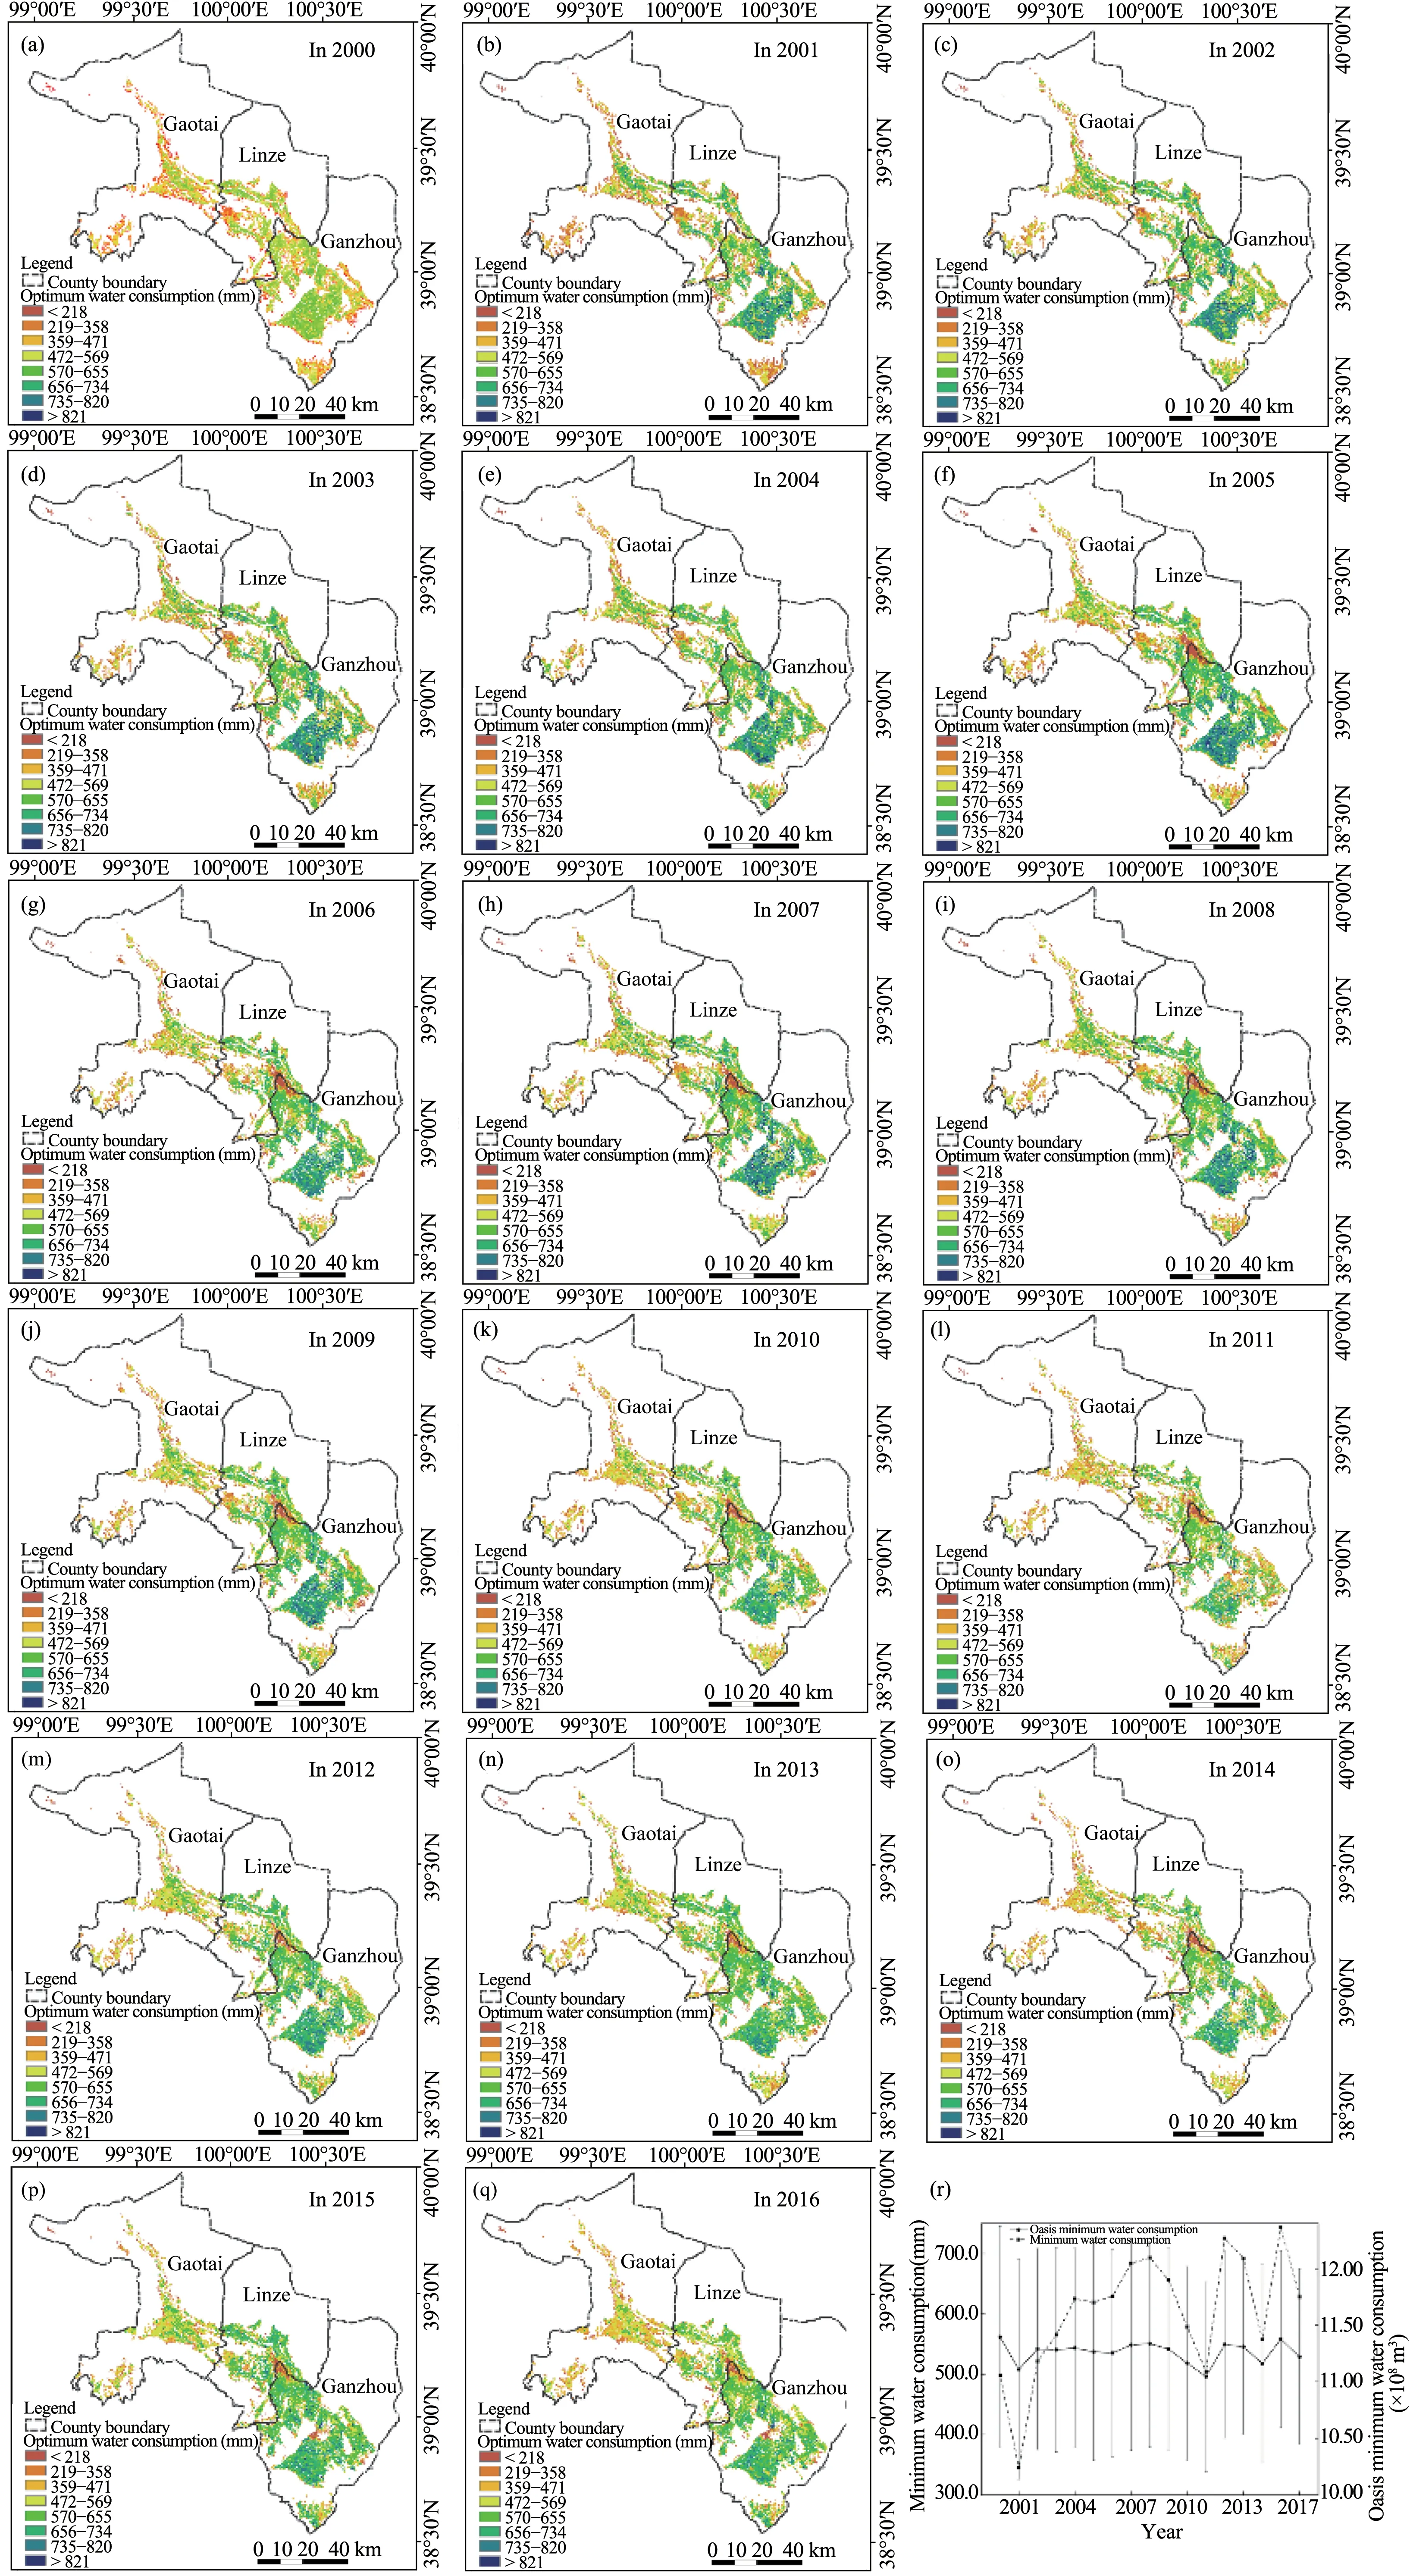
Figure 7 Spatial distribution and variation of minimum water consumption during the 2000-2016 growing season in Zhangye Oasis.Spatial distribution in(a)2000,(b)2001,(c)2002,(d)2003,(e)2004,(f)2005,(g)2006,(h)2007,(i)2008,(j)2009,(k)2010,(l)2011,(m)2012,(n)2013,(o)2014,(p)2015,(q)2016,(r)mean minimum water consumption per year from 2000 to 2016(bold line with filled circles,bars represent standard deviation of the mean)and oasis minimum water consumption(dash line with filled squares)
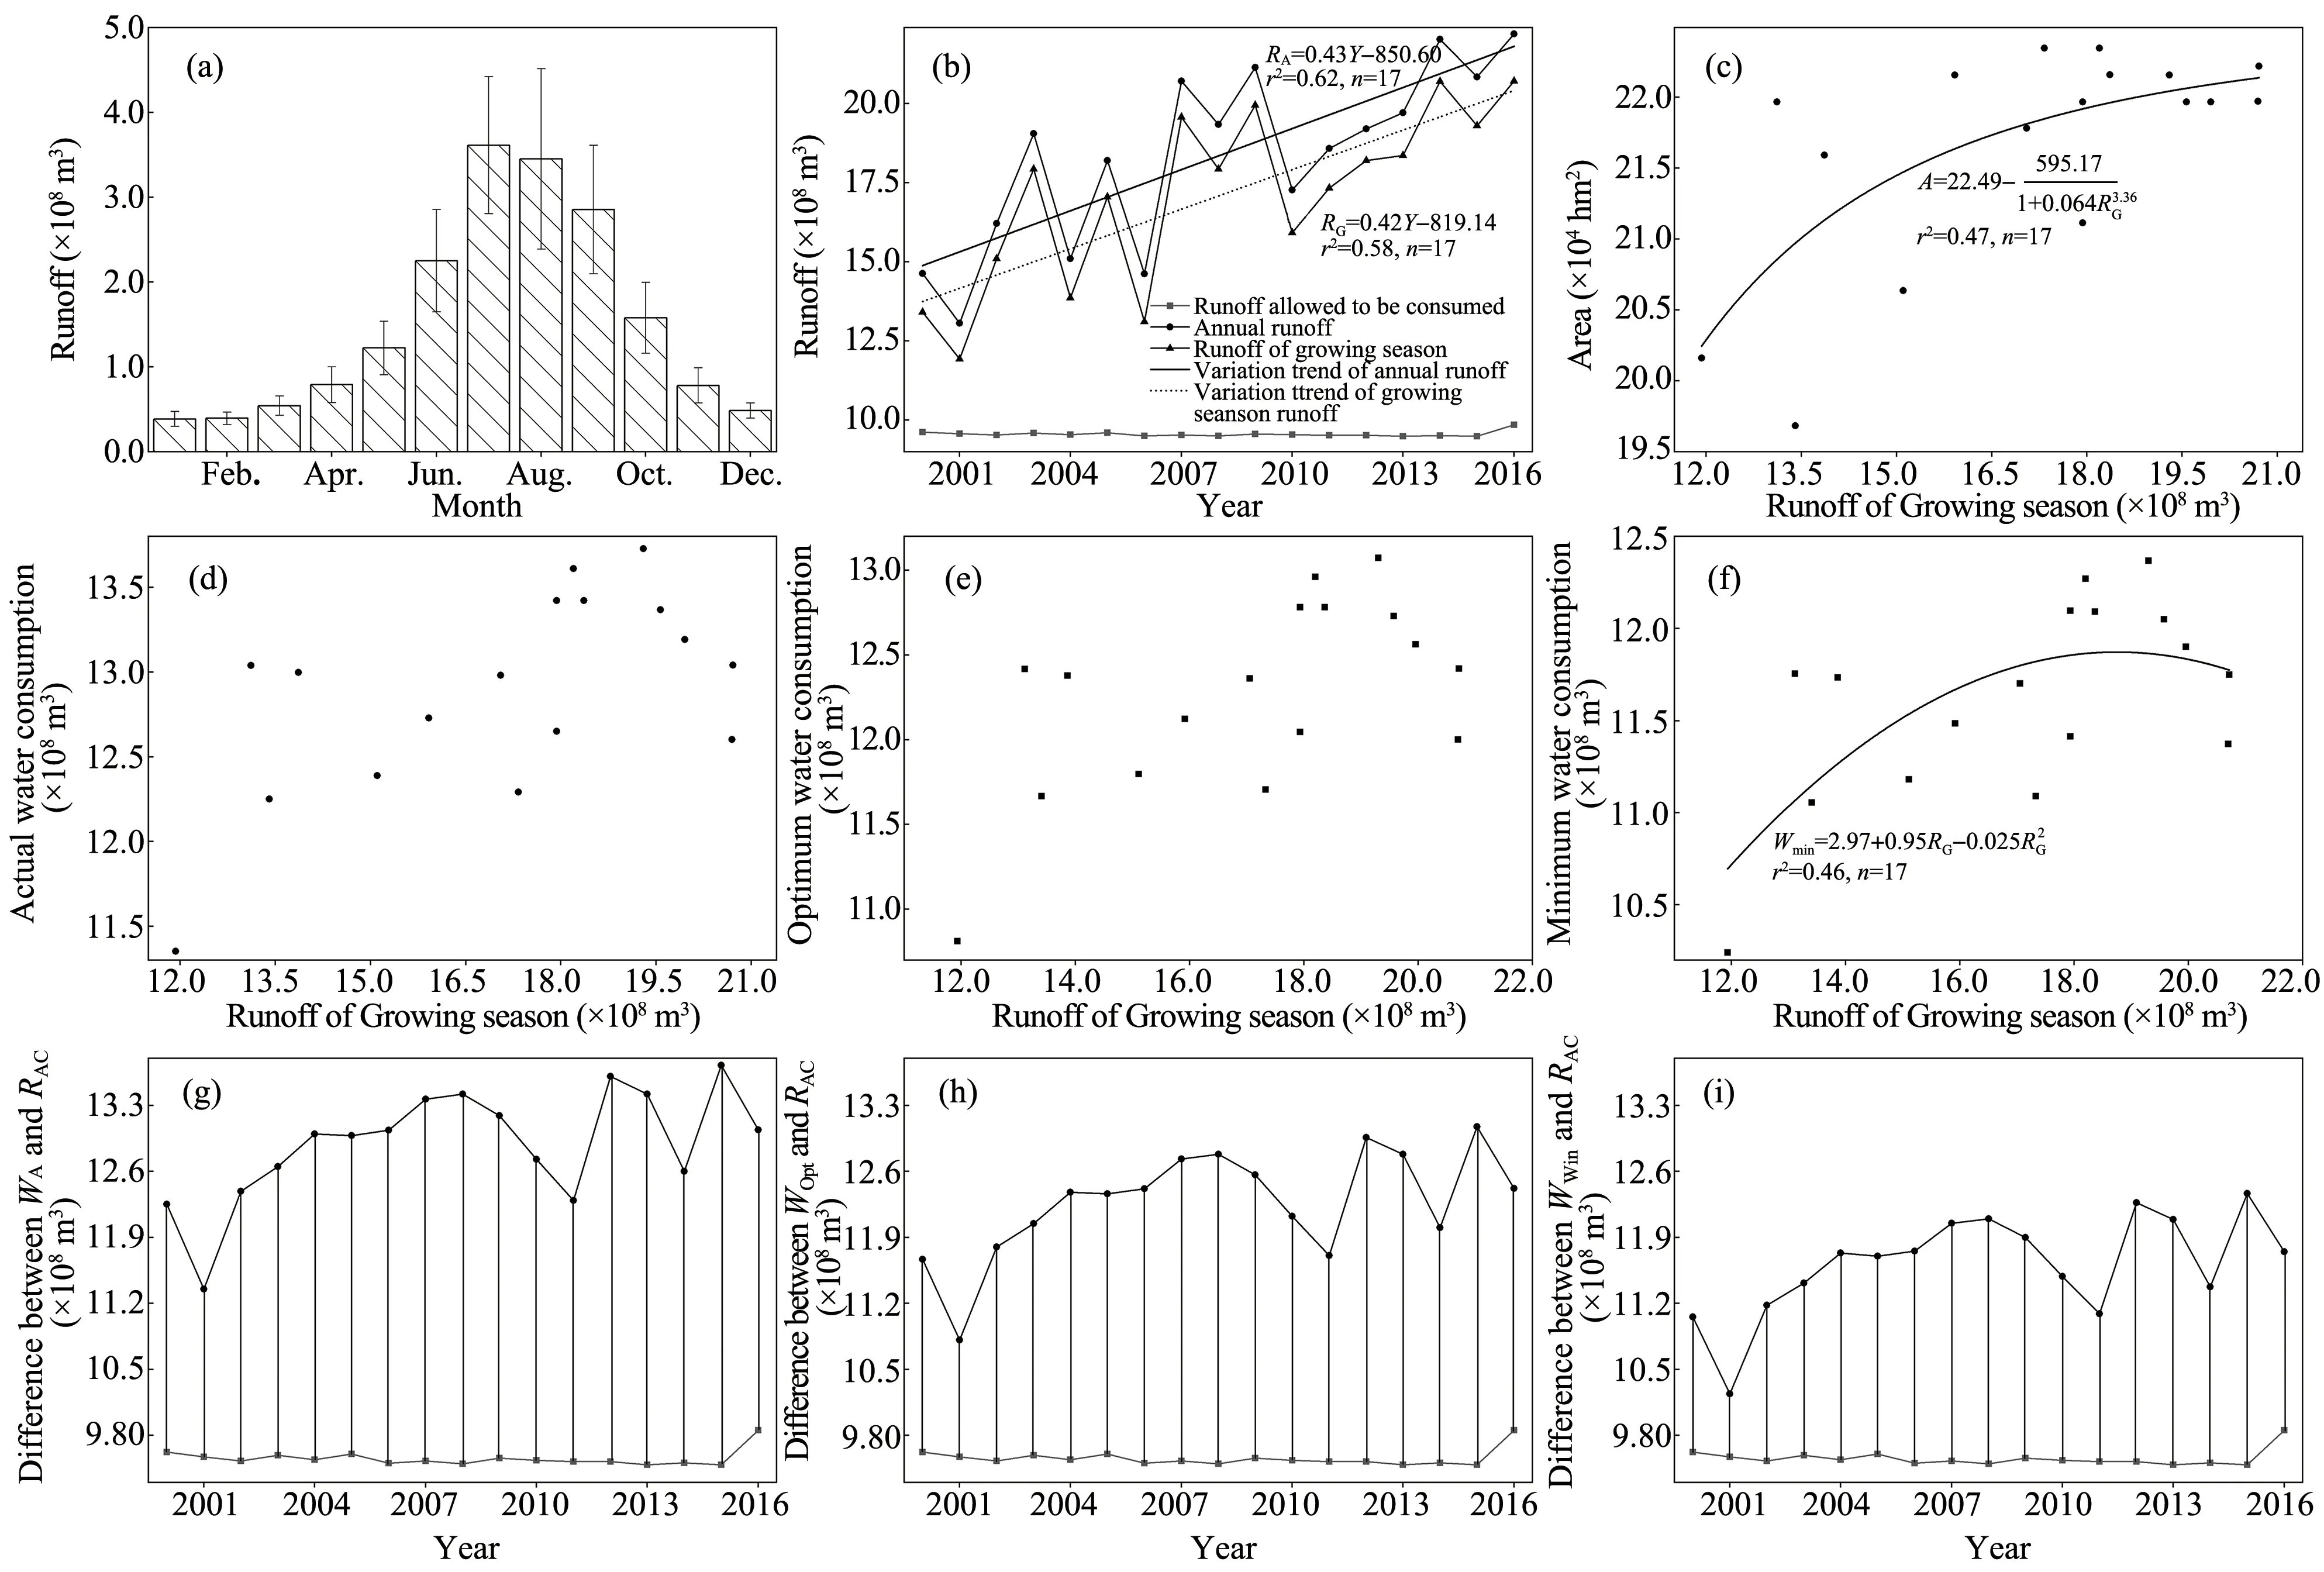
Figure 8 The variation trend of Heihe River runoff and the relationship between runoff of growing season and oasis area and water consumption from 2000 to 2016.(a)Average monthly of Heihe River runoff,(b)The variation trend of runoff and runoff allowed to be consumed(RAC)in Heihe River from 2000 to 2016,(c)the relationship between runoff of growing season and oasis area,(d)the relationship between runoff of growing season and actual water consumption(WA),(e)the relationship between runoff of growing season and optimum water consumption(WOpt),(f)the relationship between runoff of growing season and minimum water consumption(WWin),(g)Difference between WA and RAC,(h)Difference between WOpt and RAC,(i)Difference between WWin and RAC
3.4 Selected suitable management method of water resources in Zhangye Oasis
There was no observed significant correlation of actual and optimal water consumption to runoff in the growing season(Figures 8d,8e).This means that actual and optimum water consumption is not affected by runoff during the growing season.It also means that runoff in the growing season may not meet the demand of actual and optimum water consumption in Zhangye Oasis.Since 2000, runoff allocated to Zhangye Oasis (RAC) is between 9.49×10⁸m3and 9.85×10⁸m3, with an average of (9.56±0.09)×108m3according to the Heihe River water diversion scheme implemented by Heihe River Basin Management Administration in order to curb the trend of ecological degradation in the lower reaches of Heihe River (Figure 8b).In this way, there is a large gap between runoff allocated to Zhangye Oasis by the Heihe River Basin Management Bureau and actual water consumption of the oasis, which is between 1.78×10⁸m3and 4.24×10⁸m3, with an average of (3.33±0.62)×108m3(Figure 8g).If the management and utilization of water resources in Zhangye Oasis are in accordance with the optimal water consumption of the oasis,the difference between runoff allocated by Heihe Basin Administration Bureau to Zhangye Oasis and the optimal water consumption is between 0.99×10⁸m3and 3.90×10⁸m3,with an average of 2.61±0.80×10⁸m3(Figure 8h).Compared with choosing actual water consumption, it can save 0.72×10⁸m3in water resources.
In the relationship between growth season runoff and oasis water consumption, there is only a significant correlation between minimum water consumption (Wmin) (According to theFtest,F(0.05, 2, 14) is 3.74,Fis 5.62.) (Figure 8f).This simple quadratic function regression of oasis minimum water consumption to growth season runoff variable explains 46% of the variation in oasis minimum water consumption.However, this means that minimum water consumption is affected by runoff in the growing season ofHeihe River.If water resources of the oasis are managed and utilized according to minimum water consumption of the oasis, the difference between water consumption of Zhangye Ooasis and the amount of water resources allocated by Heihe Basin Administration Bureau is 0.67×10⁸m3to 2.88×10⁸m3,with an average of (2.07±0.56)×108m3(Figure 8i).Compared with actual water consumption selected, this can save 1.26×10⁸m3in water resources.Therefore, it is more appropriate to manage and utilize Heihe River runoff according to the management mode of minimum water consumption in the oasis.
4 Discussion
Estimation of actual water requirements of irrigated crops over large areas in arid and semiarid regions remains an important role in agricultural water management because of serious water shortages (Changet al.,2015b; Camposet al., 2017).Accurate assessment of water requirements, especially over long-term and at large spatial scales, will facilitate water-saving measures,increase water use efficiency through better management, and guarantee high productivity while maintaining environmental quality (Toureiroet al., 2017).Since the mid-1930s, many methods have been used to assess crop water requirements (Allen, 2000).However, there are some problems and defects in the methods adopted.For example, Eddy covariance and Bowen ratio can even estimate the evapotranspiration at scales of 0.1 to 1 km, and is considered to be the most reliable method(Rana and Katerji,2000).The same is true of the crop coefficient reference evapotranspiration method,which is the most commonly used method(Allen, 2000).Unfortunately the implementation of these techniques was limited by installation and maintenance costs, limited spatial representation, and spatial heterogeneity in crop growth process and planting systems management,which hinders the application of these approaches to larger areas (Camposet al., 2017).Although the remote sensing method can estimate the actual water demand at a larger scale, most of methods are based on ground weather data(Tanget al.,2009;Liet al.,2017).However,the availability of surface meteorological data are limited because there are few meteorological stations and most are concentrated in areas with a more concentrated population, especially in near-real time, in particular arid and semi-arid regions,such as in our study area (Figure 1).Moreover, these still only examined relatively short time-series, and did not consider the effects of soil properties on water requirements in the process of plant growth.
Our method, based on meta-analysis results from studies of evapotranspiration at field scales, MODIS data, spatially-distributed land-use and soil properties data, will overcome these limitations and avoid the scarcity of ground-based meteorological data.Metaanalysis is proven more powerful, informative, accurate, and less likely to be biased than simple narrative reviews and "vote counting" (Gurevitchet al., 1992),which has been used in numerous studies (Wang and Taub,2010;Baiet al.,2013).In the study of estimating actual water consumption based on meta-analysis method,it can not only estimate water consumption at a larger scale, but can also estimate water consumption at a monthly or even smaller time scale according to the requirement.This method has been proven to be an accurate and reliable estimation method(Zhaoet al.,2018).
In arid and semiarid regions,precipitation is not reliable and is highly erratic both in quantity and distribution.As a result, crops depend mainly on irrigation.However,properly managed irrigated agriculture in oases depends mainly on the quantitative understanding of water demand dynamics and efficient management of water resources.To ensure agricultural production and oasis stability, we described oasis water consumption in terms of minimum, optimum, and maximum.The most important goals were to minimize water consumption while maximizing production,maintain vegetation in the oasis, and provide the basis for proper management of water resources decision making.
The study of the variation range of runoff,oasis area and water consumption in Zhangye Oasis is of great significance for solving the conflicts between water supply and demand and development and protection of the ecological environment.However, this study found that only 47% of the variation in the oasis area can be explained although there was a logistic function relationship between growth season runoff and oasis area.Through this function, the maximum area of Zhangye Oasis of 22.49 ×10⁴hm2can be determined.This means that the area of Zhangye Oasis determined by runoff of the growing season has reached a maximum.If runoff allocated to Zhangye Oasis by Heihe River Basin Management Bureau is calculated and the stable and sustainable development of oasis is maintained,Zhangye Oasis should reduce the existing oasis area.
For the relationship between growth season runoff and oasis minimum water consumption, this study found that minimum water consumption and runoff has a simple function relation, while optimum water consumption and maximum water consumption and runoff was not found.Moreover, only 46% of the variation in oasis minimum water consumption can be explained.This suggests that there should be other maintained irrigation sources in this oasis.In this region,precipitation is unlikely to be a source of irrigation since it is rather scarce, with an average annual precipitation of about 120 mm.On the other hand, when precipitation is more than 8 mm, it can play a role in plant growth(Huang and Shen, 2000).According to the observation of Linze county meteorological bureau in the oasis ar-ea, the number of precipitation days ≥8 mm in the growing season from 1990 to 2017 (April to September) reached the maximum in 2017, only six times; and the precipitation was only 68.4 mm, accounting for 43.8% of annual precipitation (Figure 8).However, in most years, the number of precipitation days ≥8 mm in the growing season was less than four days, and the ratio of precipitation in the whole year was also less than 20.0% (Figure 9).In addition, according to the study of water account of irrigation district scale based on the Molden-Sakthivadivel water-accounting method, Changet al.(2015a) found that irrigation depends heavily on groundwater, which accounts for more than 80.00% of the total irrigation water in the Pingchuan irrigation district, Linze County.In Zhangye Oasis, this should be a common phenomenon.Therefore, groundwater should be another source of irrigation water.In order to curb the trend of ecological degradation in the lower reaches of Heihe River,since 2000,the Heihe Basin Administration Bureau began to implement the middle and lower reaches water allocation scheme according to the different annual inflow of Heihe River Basin, and carried out unified water allocation in Heihe River.Due to the implementation of the water distribution scheme, the quota of water use from Heihe River runoff in Zhangye Oasis has been greatly reduced.In this way,the surface water consumption of Zhangye Oasis is very limited.Although the government has taken numerous measures to save water, farmers still use flood irrigation to fully irrigate their fields, which brings greater economic benefits.As a result, groundwater has to be pumped in large quantities to make up for the lack of surface water for irrigation.Because of excessive groundwater extraction, groundwater levels in the Zhangye Oasis region saw a continuous decline during 1990-2010, where maximum cumulative groundwater level dropped 5.8 m and maximum annual average rate of decline reached 0.87 m/a (Zhanget al., 2018).In Linze County, Zhangye Oasis, groundwater depth in the groundwater pumping area between 0 and 4 m decreased from 511.59 km2in 1986 to 174.58 km2in 2010—a drop of 65.88%;and the area where the groundwater depth was 6.0 m or more increased 118.01%—from 758.49 km2in 1986 to 1,653.78 km2in 2010 (Wang and Chang, 2013).This has also led to degradation of the ecological environment in the middle reaches of Heihe River.A significant decreasing trend in the mean growing season NDVI was apparent along the river course and areas of vegetation degradation were scattered throughout the middle reaches of Heihe River Basin (Zhanget al., 2018).If this situation continues for an extended period of time, disastrous consequences for the ecological environment will ensue.Therefore,in the future, in order to maintain sustainable development of social economy and ecological environment of the Zhangye Oasis, either reduce the current oasis area,or use the optimum water consumption, which is the best way to use minimum oasis water consumption.
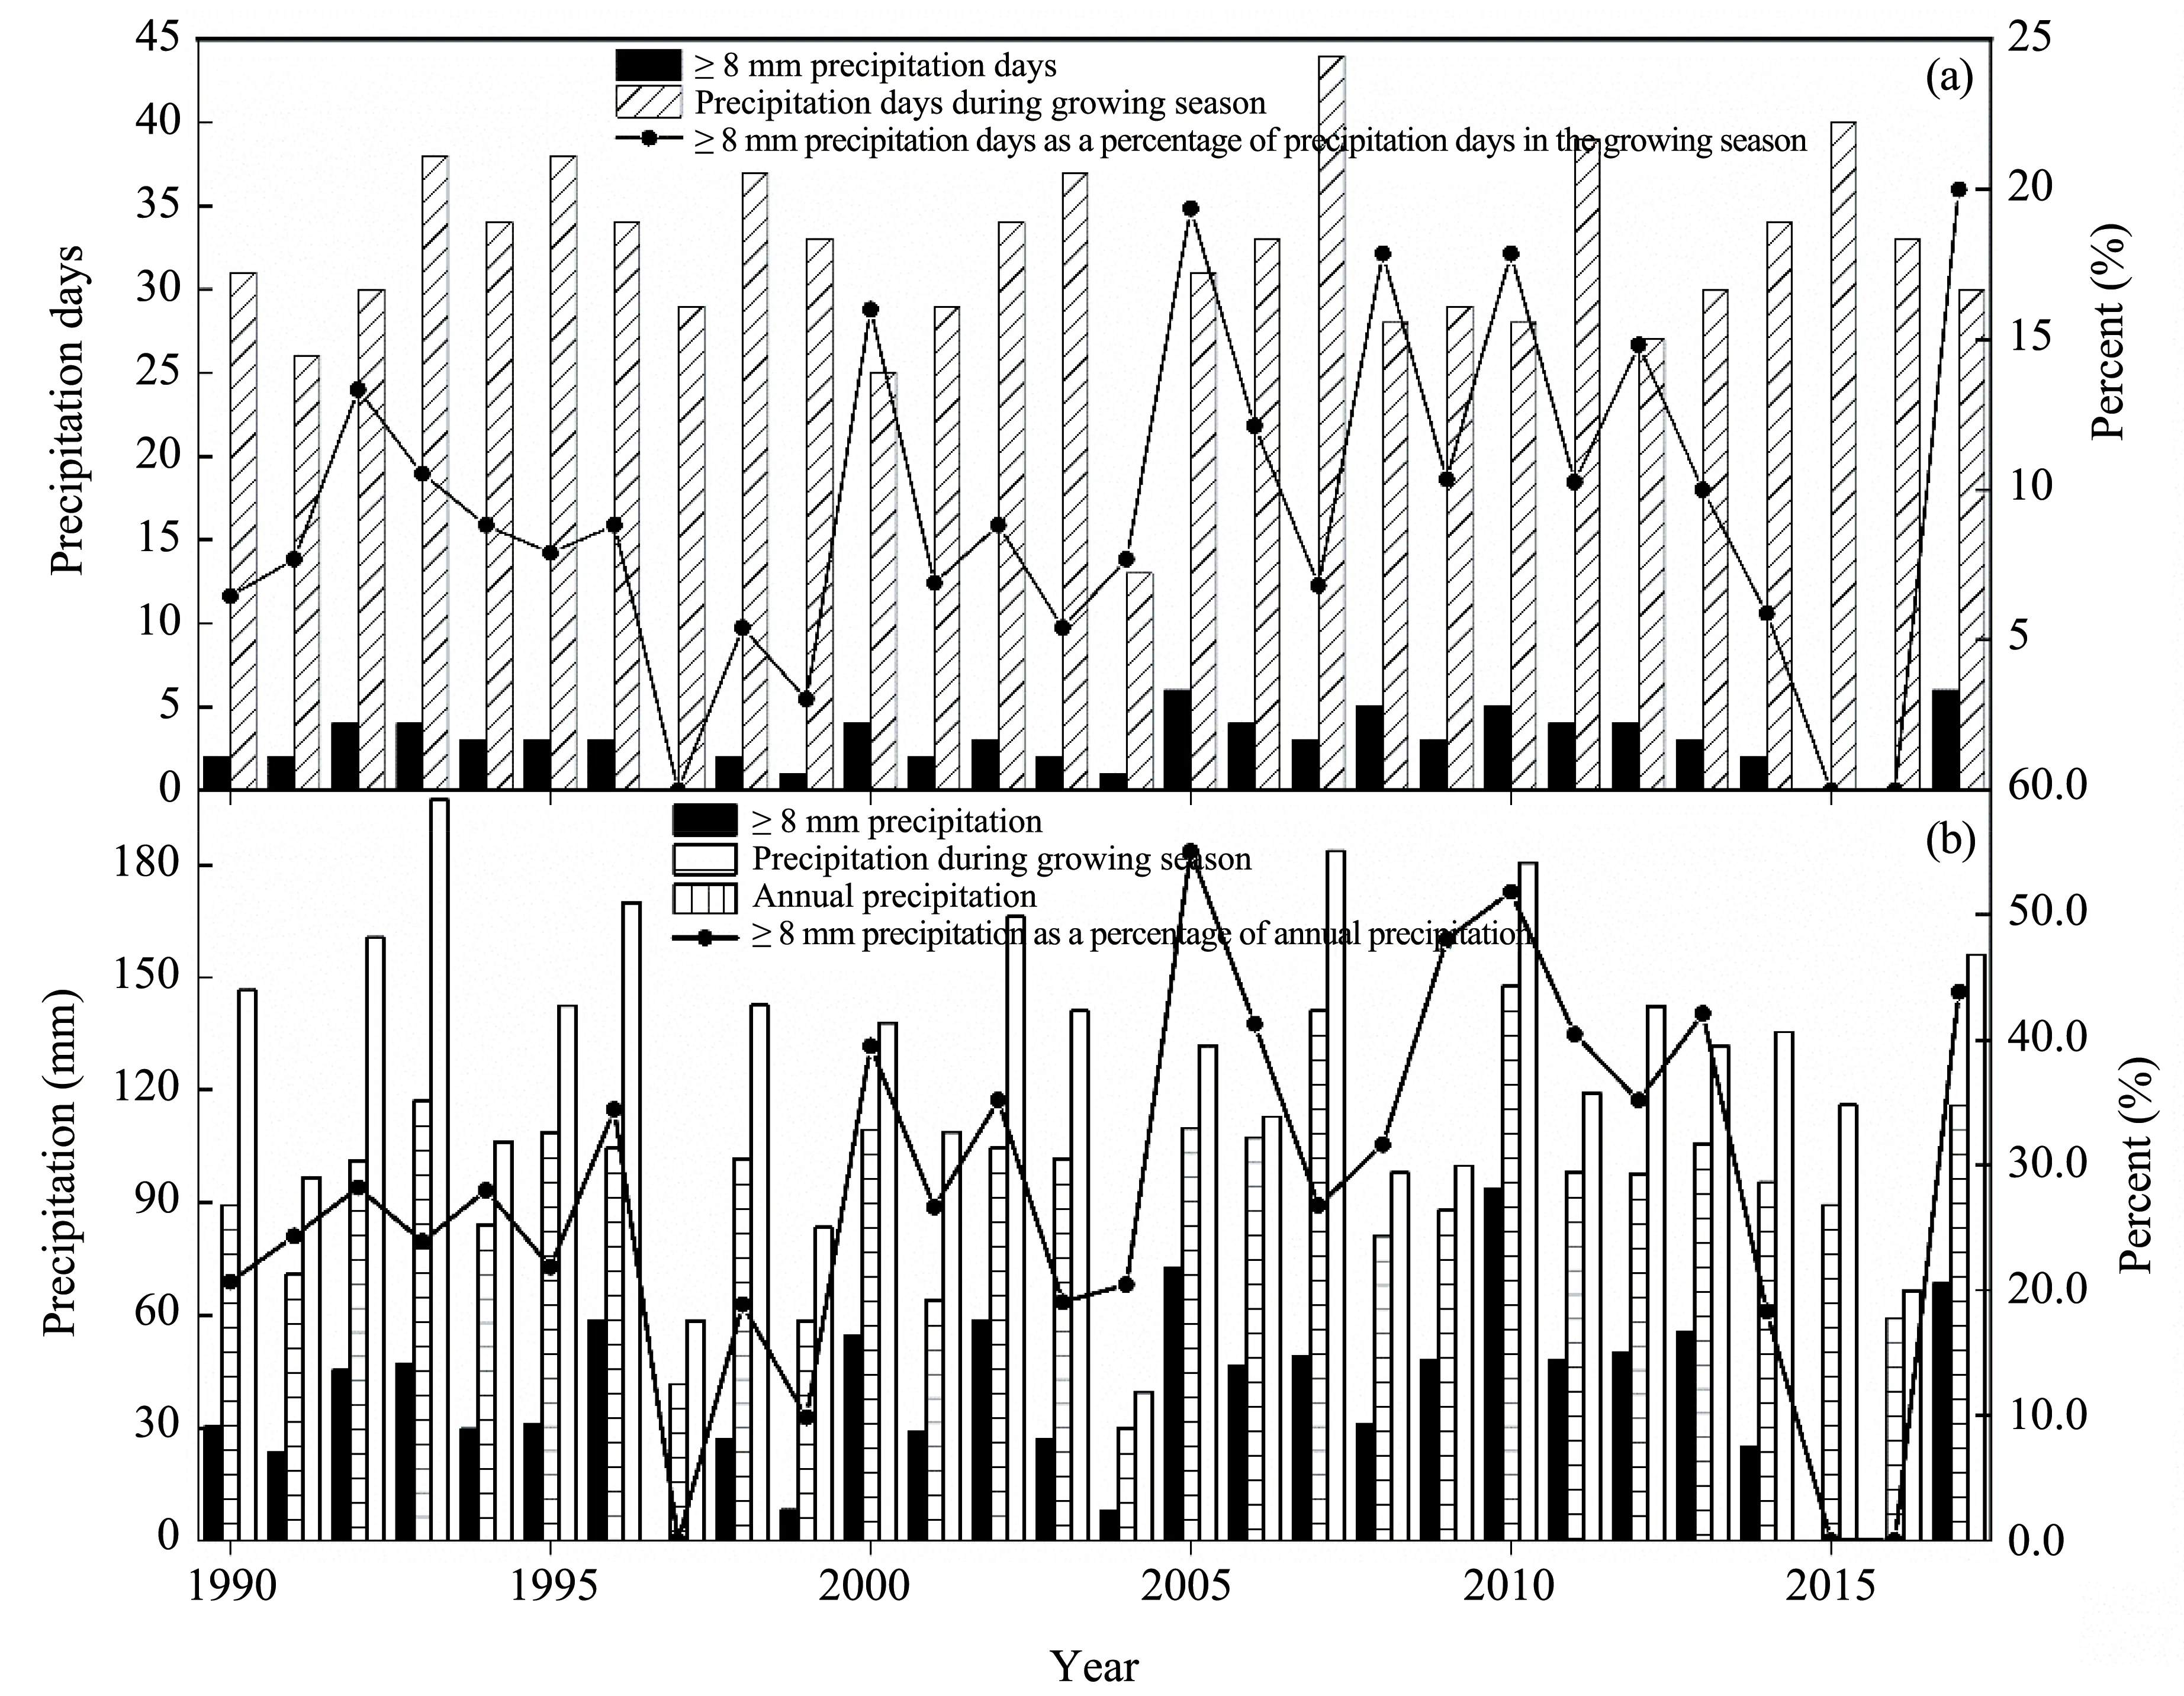
Figure 9 The growing season,≥8 mm and annual precipitation change in of Linze County,Zhangye Oasis from 1990 to 2017
5 Conclusions
Our study presents a simple sound model to improve the understanding of water consumption in an oasis region.The analysis methods, including the use of meta-analysis, MODIS NDVI products, and soil water physical parameters, were appropriate for applications at a regional scale; the ability to scale up results unlimited by scarcity of ground-based meteorological data.Moreover,this study provides insights into land use change and water consumption over longterm by using data for 2000 to 2016 at large spatial scales.According to Heihe River runoff in the growing season, the maximum retention area of Zhangye Oasis was determined.This study shows that runoff in the growth season is not the only reason for determining changes in the oasis area,and is also not sufficient to meet the minimum water consumption for Zhangye Oasis.These results can provide practical guidance for water resource management of coordinated development of the economy and the environment in an arid region.In the future, in order to maintain sustainable development of social economy and ecological environment of Zhangye Oasis, either reduce the current oasis area, or use the optimum water consumption which is the best way to use minimum oasis water consumption.
Acknowledgments:
This study was funded under the National Natural Science Foundation of China project(91425302).The authors thank anonymous reviewers for their critical review and comments on this manuscript.
杂志排行
Sciences in Cold and Arid Regions的其它文章
- Dynamic behavior of the Qinghai-Tibetan railway embankment in permafrost regions under trained-induced vertical loads
- Comparison of sampling schemes for spatial prediction of soil organic carbon in Northern China
- Theoretical expressions for soil particle detachment rate due to saltation bombardment in wind erosion
- Validation of AIRS-Retrieved atmospheric temperature data over the Taklimakan Desert
- Variation characteristics of evaporation in the Gulang River Basin during 1959-2013
