Experimental study on mercury content in flue gas of coal-fired units based on laserinduced breakdown spectroscopy
2020-07-09KaiRONG荣凯ZhenzhenWANG王珍珍RuomuHU胡若木RenweiLIU刘人玮YoshihiroDEGUCHI出口祥啓JunjieYAN严俊杰andJipingLIU刘继平
Kai RONG (荣凯),Zhenzhen WANG (王珍珍),2,Ruomu HU (胡若木),Renwei LIU (刘人玮)2,,Yoshihiro DEGUCHI (出口祥啓),2,Junjie YAN (严俊杰),2 and Jiping LIU (刘继平)
1 State Key Laboratory of Multiphase Flow in Power Engineering,Xi’an Jiaotong University,Xi’an 710049,People’s Republic of China
2 Graduate School of Technology,Industrial and Social Sciences,Tokushima University,Tokushima 770-8501,Japan
3 Moe Key Laboratory of Thermo-Fluid Science and Engineering,Xi’an Jiaotong University,Xi’an 710049,People’s Republic of China
Abstract
Keywords:laser-induced breakdown spectroscopy,flue gas,trace heavy metal,quantitative analysis
1.Introduction
The flue gases produced by coal-fired power plants include SO2,NOx,trace heavy metals and volatile organic compounds[1,2].The pollution of trace heavy metals in flue gases has attracted increased attention,particularly mercury (Hg) pollution caused by coal combustion.During the combustion process of coal in a boiler,Hg enters the flue gas in the form of vapor.Since the Hg element is hardly soluble in water and the vapor pressure is high,Hg has a relatively stable form and will be discharged into the atmospheric environment together with the flue gas [3,4].Hg in the atmosphere has toxicity,persistence and bioaccumulation effects,which cause great harm to human health and the environment [5,6].In China,the emission limit of Hg and its compounds from flue gas of a coal-fired power plant are not permitted to exceed 0.03 mg m−3.The commonly used analytical methods for measuring the Hg concentration in flue gas include cold vapor atomic absorption spectrometry,cold vapor atomic fluorescence spectrometry,Zeeman atomic absorption spectrometry,and UV differential optical absorption spectrometry,all of which measure the Hg element [7–10].However,these methods have the disadvantages of off-line detection,complex operation steps,limited measurement accuracy,a long detection period,and the inability to adapt to harsh experimental conditions and other aspects,which make it difficult for them to meet the requirements of real-time line measurement of trace Hg in flue gas.Therefore,a method with the ability to complete real-time on-line measurement of Hg concentration in flue gas is necessary.
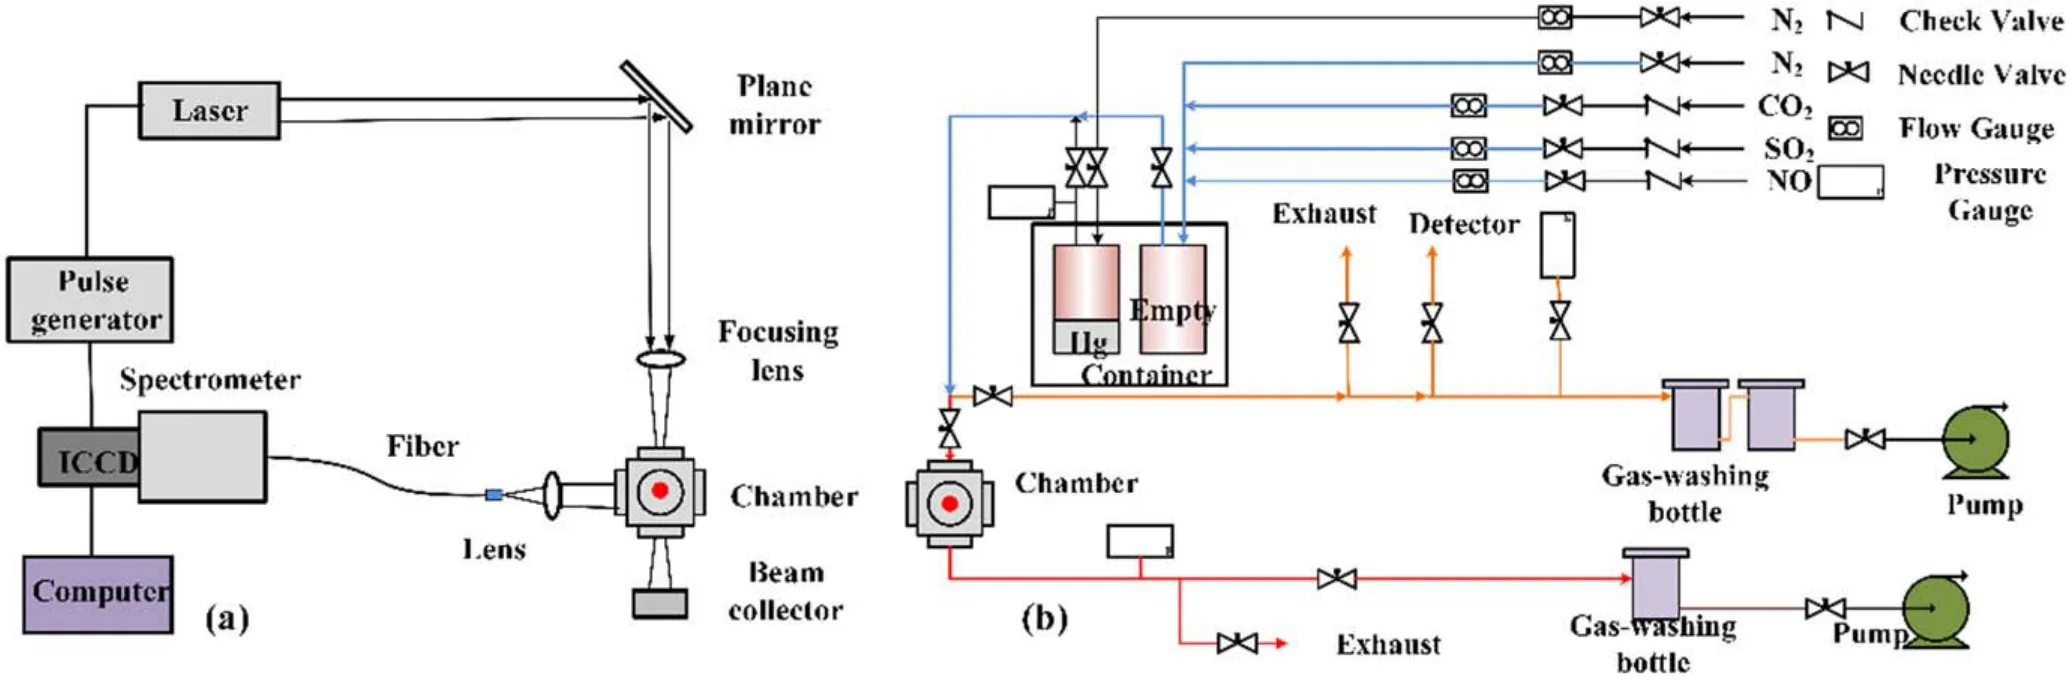
Figure 1.Schematic diagram of experimental system.(a) LIBS system.(b) Gas system.
Laser-induced breakdown spectroscopy (LIBS) is an element analysis method based on atomic emission spectrometry,which can be used for a variety of materials,including solids,gas and liquids [11–18].The LIBS technique has the potential for real-time,fast,highly sensitive,on-line,noncontact,multi-element simultaneous monitoring,without sample preparation,and has attracted wide attention in the measurement of trace heavy metals in gases.Visentini et al[19]first applied LIBS technology to the quantitative determination of Mg concentration in olefins.The results showed that the technology can achieve the same results as the conventional method in a short period of time.Zhang et al [20]used a nanosecond and picosecond laser to decompose CH3I in N2and air under reduced pressure.The results of iodine measurement showed that low pressure LIBS was an ideal method for the determination of trace substances in analytical applications.Lazzari et al [21]proposed using LIBS technology to quickly and accurately diagnose a small amount of mercury in the air,and set up an experimental system to test the feasibility.The results showed that LIBS technology was able to detect the concentrations of mercury without particular difficulties.Gleason et al [22]found that the 253.7 nm mercury emission intensity had a significant reduction with the introduction of an oxygen-containing species in long decay times,and the 253.7 nm mercury emission line was selectively quenched by oxygen species,primarily O2and NO.Wang et al analyzed the detection characteristics of LIBS for trace heavy metal mercury under low pressure and short pulse conditions [23–25].The results showed that NO formed by O2and N2in the plasma cooling process produced the electron transition of an NO emission band centered at 258 nm,which seriously interfered with the Hg signal.By controlling the pressure and laser pulse width,the interference can be effectively reduced and the detection limit of gas phase LIBS analysis can be reduced.The above analyzed results show that LIBS has great potential for directly application to the measurement of heavy metal Hg in gases.
This paper further studied LIBS detection features for the measurement of heavy metal Hg in actual flue gas of coalfired units.An actual power plant flue is usually under the condition of micro negative pressure to improve the boiler efficiency.In the process of LIBS on-line measurement of Hg concentration in flue gas,a part of the flue gas will be extracted into the measurement chamber for measurement,and the gas pressure in the measurement chamber is controllable.In this paper,mixed gas was used to simulate the simplified flue gas of coal-fired units and an experimental system of mixed gas was designed and employed to study the effect of mixed gas pressure,Hg concentration in mixed gas and delay time on the measurement results using LIBS method.The traditional calibration method and internal standard method were used to analyze the LIBS measurement data from different Hg concentrations in mixed gases and the adaptability of these two methods to the quantitative analysis of Hg in flue gas was compared.
2.Experimental setup
2.1.Experimental system
Figure 1 shows a schematic diagram of the experimental systems used in this study.The LIBS system,which includes a laser,a pulse generator,a spectrometer,an intensified charge coupled device (ICCD) camera,optical fiber,computer and other optical devices,is shown in figure 1(a).A pulse laser with a wavelength of 1064 nm,laser energy of 400 mJ pulse−1,pulse width of 6 ns and frequency of 10 Hz was generated by the Q-switched Nd:YAG laser (Quantel Q-Smart 850).The pulse laser was reflected by a plane mirror and then focused into the measurement chamber by a lens with a focal length of 100 mm,to induce plasma.Themeasurement chamber was a vacuum chamber with four quartz windows,which was approximately 200 cm3and perpendicular to the direction of laser propagation.The emission signal of the plasma was collected from another window of the chamber and focused on the entrance of the optical fiber by a lens with focal length of 100 mm,and then transmitted to the spectrometer (SQL NP 250-2) and ICCD camera (Andor iStar334T).The spectrometer divided the mixed light into monochromatic light,and then passed it into the ICCD camera for detection,displaying the spectral information on the computer.The delay time can be adjusted by the ICCD camera.
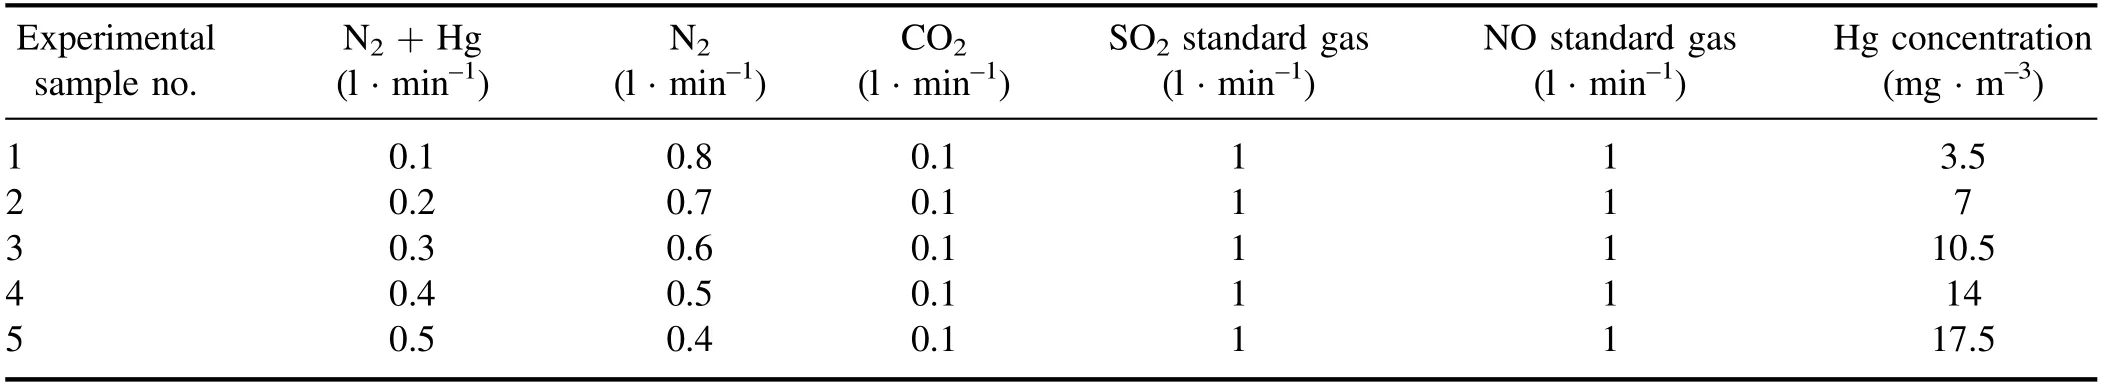
Table 1.Flow rate of each standard gas and concentration of Hg in each sample.
The mainly components of the gas system were a stainless steel measurement chamber,sample container,gas pipeline,thermostatic heater,pressure gauge,and vacuum pump,as well as other auxiliary equipment,as shown in figure 1(b).The system was equipped with two sample containers.One was empty,for gas mixing,and the other was the liquid Hg sample container,which was heated and supplied with N2to provide trace heavy metal Hg vapor in the mixed gas.The Hg concentration in mixed gas was regulated by controlling the N2gas flow into the Hg sample container.The amount of Hg volatilization at room temperature is extremely small,so the pipelines of the experimental system were evenly covered with a heater to warm the gas.The inlet pipelines of CO2,SO2and NO were heated to 50°C,and the other pipelines,chamber and containers were heated to 90°C to obtain enough Hg vapor.N2,CO2,SO2and NO were simultaneously connected to the system inlet according to a certain proportion,and were mixed in the empty sample container.The mixed gas from the empty sample container was mixed with the N2gas flow containing Hg and then divided into two flows.One flow (about one third) of the mixed gas entered the measurement chamber to generate plasma.The remaining flow passed through the bypass,in which there was a detection hole.The concentration of Hg in the mixed gas was also detected by Hg gas detector tubes(Komyo Rikagaku Kogyo K.K.No.142S).Finally,SO2,NO,and Hg vapor in the mixed gas were absorbed by the gas-washing bottle,and the remaining gas was discharged into an exhaust system.
2.2.Samples
In an actual coal-fired power plant,the flue gas composition is extremely complicated,including,e.g.,SO2,NOx,and trace heavy metals,etc.Because the amounts of CO,NO2,HCl,and SO3are small in flue gas,the influence of these gases were ignored in this paper.O2was also ignored because of its relatively low content and safety considerations.Therefore,this study used the mixed gas,which was composed of N2,CO2,SO2and NO,to simulate flue gas of an actual power plant,and LIBS was used to measure the Hg concentration in the mixed gas.N2and CO2were pure gases with purity of 99.999%.SO2and NO were standard gases.The concentration of the SO2standard gas was 6000 ppm,and the concentration of the NO standard gas was 3000 ppm.Table 1 shows the flow rate of each standard gas and the concentration of Hg for each experimental sample.
3.Results and discussion
3.1.Analysis of detection characteristics
3.1.1.Influence of gas pressure.Gas pressure is an important influencing parameter in flue gas analyses using LIBS,as it directly affects the formation processes and emission spectra of plasma.Therefore,it is very important to choose an appropriate pressure for quantitative analysis of flue gas.In this experiment,the influence of mixed gas pressure on measurement results was analyzed.Figure 2 shows the measured spectra at mixed gas pressures of 10 kPa and 20 kPa using LIBS.Measured spectra were the average of five measurements and spectral wavelength range was 245–320 nm,from which C and Hg emission lines could be identified.By comparing the spectra under the two gas pressures,it can be found that C signal intensity increased significantly when the mixed gas pressure increased from 10 kPa to 20 kPa,while Hg signal was gradually buried in the background and became more difficult to distinguish.This result indicates that mixed gas pressure would have a significant impact on the detection of the Hg signal.
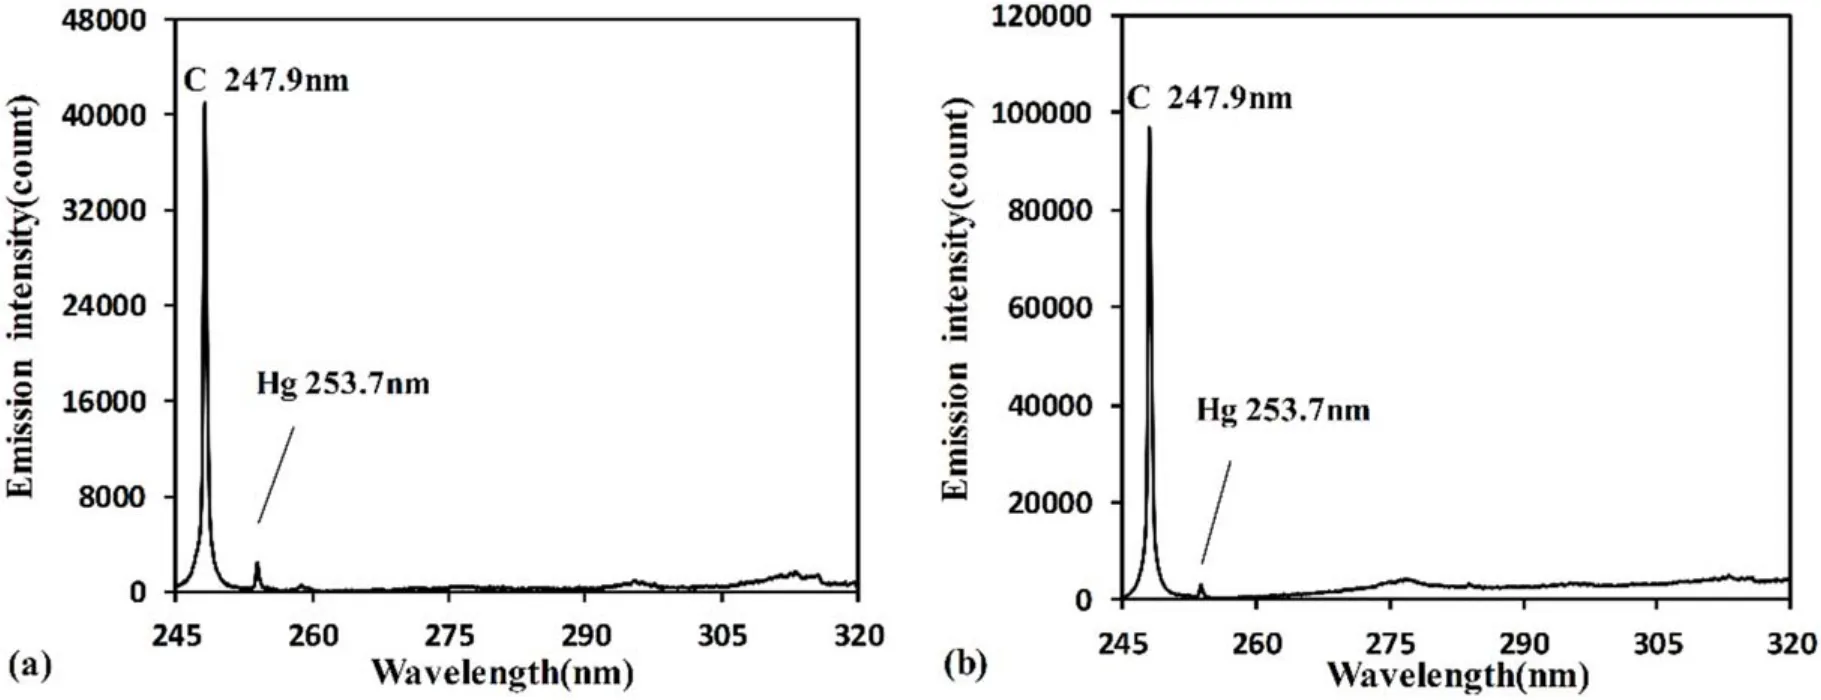
Figure 2.Measured spectra at different gas pressures in delay time of 2500 ns for sample No.4.(a)Pressure at 10 kPa.(b)Pressure at 20 kPa.
Figure 3 shows the pressure dependence of Hg measurement results.Error bars were composed of five measurements.The signal intensities of Hg 253.7 nm and C 247.9 nm were calculated using the area method.Figure 3(a) shows the Hg signal intensity at different mixed gas pressures.When the mixed gas pressure increased from 8 kPa to 20 kPa,Hg signal intensity continued to increase.The reason for this phenomenon is that with the mixed gas pressure increase,the density of generated plasma increased,the collisions of electrons,ions and neutral particles with each other became more frequent,and the laser absorption efficiency was higher.Plasma temperature including the temperatures of electrons,ions and neutrals became higher [26],and consequently the Hg signal intensity increased.Figure 3(b) shows the intensity ratio of IHg253.7 nm/IC247.9 nmat different mixed gas pressures.It can be seen that IHg253.7nm/IC247.9nmdecreased rapidly with the increase of mixed gas pressure,which means C signal intensity increased faster than Hg signal intensity with the increase of mixed gas pressure.This result indicates that with the increase of mixed gas pressure,the interference of the C emission on the Hg emission gradually increased.Therefore,under the reduced pressure conditions,the Hg signal detection is easier and interference is less.
The background of the laser-induced plasma is mainly composed of an environmental blank background and continuous emission background.The environmental blank background is characterized by a relatively uniform intensity distribution and can be directly subtracted.The continuous emission background is a relatively stable background intensity formed by various continuous spectral physical radiation in plasma[27].In the process of spectral analysis,a continuous emission background is regarded as a kind of noise interference.This noise interference is directly related to the radiation intensity and wavelength,which affect the accuracy and the detection limit of the target element characteristic spectrum.The standard deviation of noise was used as an index to evaluate the signal to noise ratio.In this study,the noise was calculated by the same method as the calculation of Hg signal intensity using the area method,and the standard deviation of noise around Hg at 253.7 nm was evaluated after the subtraction of interference signals,such as the detector background noise and broad tail of adjacent signals.
Figure 3(c) shows the standard deviation of noise at different mixed gas pressures.It can be seen that the standard deviation of noise increased with the increase of mixed gas pressure,and the error bar also increased.With the mixed gas pressure increase,the continuous emission intensity also increased.The electron impact ionization process,following the multi-photon ionization process,strengthened the noise interference in addition to the enhancement of signals.Therefore,the noise increased with the increase of mixed gas pressure.This result indicates that the noise interference can be reduced in low pressure conditions.The signal to noise ratio is a physical quantity used to evaluate the interference degree of noise in the spectra.Hg signal to noise ratio was the ratio of Hg signal emission intensity to the noise.Figure 3(d)shows the Hg signal to noise ratio at different mixed gas pressures.With the increase of mixed gas pressure,the Hg signal to noise ratio first increased and then decreased,reaching the maximum value around 10 kPa.A larger Hg signal to noise ratio indicates the smaller interference of noise on Hg signal.At high mixed gas pressure,the interference of the continuum emission from the plasma itself increased dramatically.LIBS spectra were buried in the background interference[23],which made it difficult to distinguish the Hg signal from background emission.The above analysis shows that with further increase of gas pressure or under atmospheric pressure,the interference of noise and other elements will become more serious.In order to obtain more accurate results,the appropriate gas pressure condition with high signal intensity and high Hg signal to noise ratio should be determined for quantitative analysis.Therefore,the mixed gas pressure for quantitative analysis in this experiment was around 10 kPa.
3.1.2.Influence of Hg concentration.Figure 4(a) shows the Hg signal intensity at different Hg concentrations in mixed gas.It can be seen that the Hg signal intensity increased rapidly with the increase of Hg concentration in the mixed gas.This means that the LIBS method can measure the way that the obvious Hg signal and Hg signal intensity had a positive correlation with the Hg concentration,which proves the feasibility of the LIBS method to measure Hg concentration in flue gas.At the same time,the Hg signal to noise ratio also increased rapidly with the increase of Hg concentration in the mixed gas,as shown in figure 4(b).The trend was similar to that of Hg signal intensity.This result indicates that with the increase of Hg concentration in the mixed gas,the change of noise was relatively small,and the interference of noise on Hg signal intensity measured by different Hg concentrations was relatively stable.The Hg detection limit was estimated by evaluating the ratio of standard deviation of noise to the slope of the Hg calibration curve[24,25].The detection limit of the Hg signal was around 0.06 ppm (0.32 mg · m–3) at a gas pressure of 10 kPa in this study.The detection limit can be reduced with the optimized experimental conditions,such as the utilization of a short pulse width laser [25].
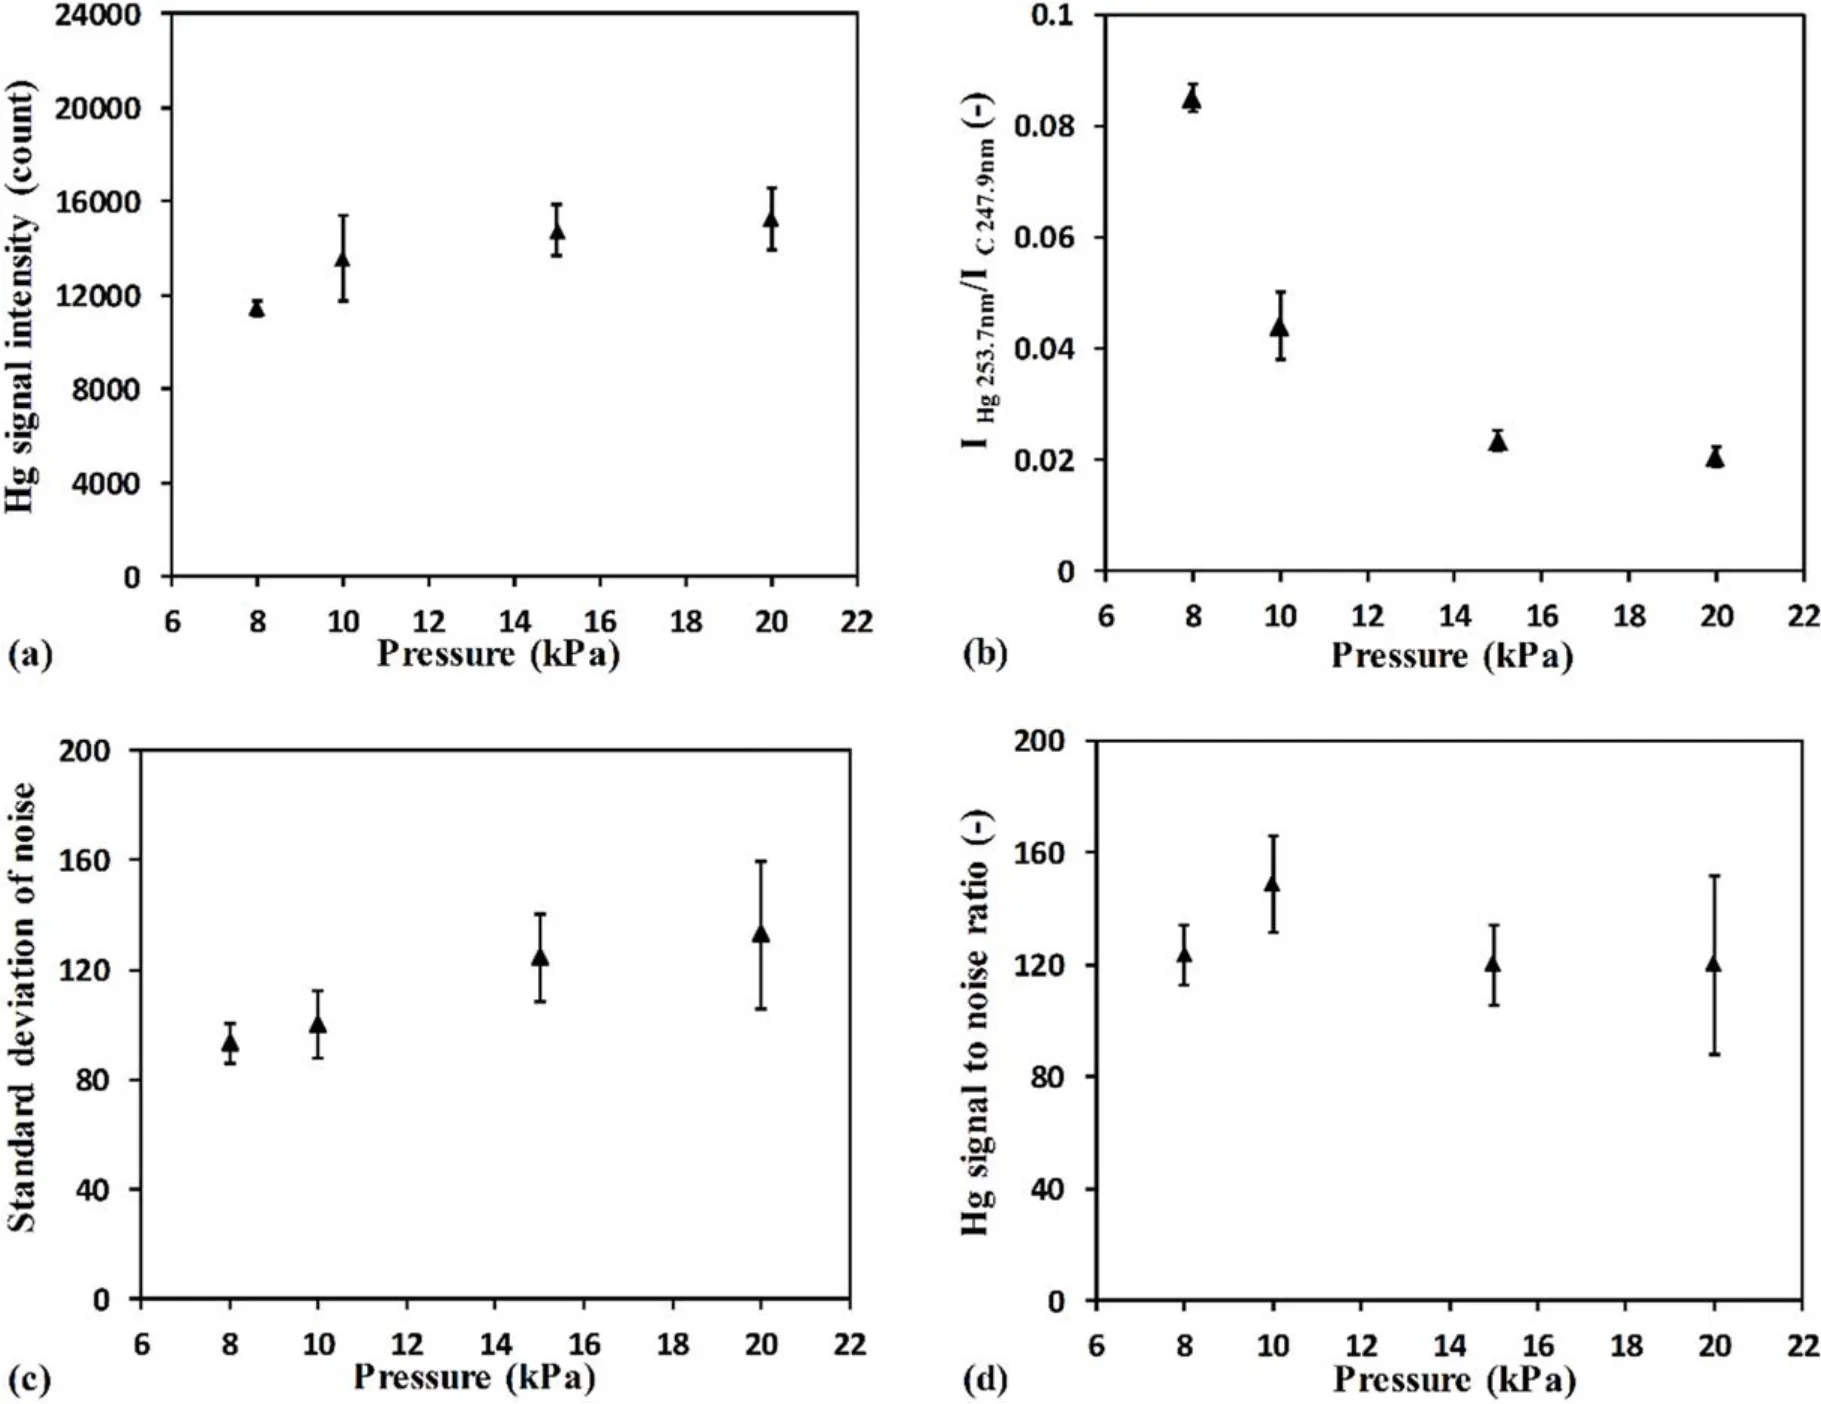
Figure 3.Pressure dependence of Hg measurement results in a delay time of 2500 ns for sample No.4.(a)Signal intensity of Hg 253.7 nm at different gas pressures.(b)Intensity ratio of Hg 253.7 nm/C 247.9 nm at different gas pressures.(c)Standard deviation of noise at different gas pressures.(d) Hg signal to noise ratio at different gas pressures.
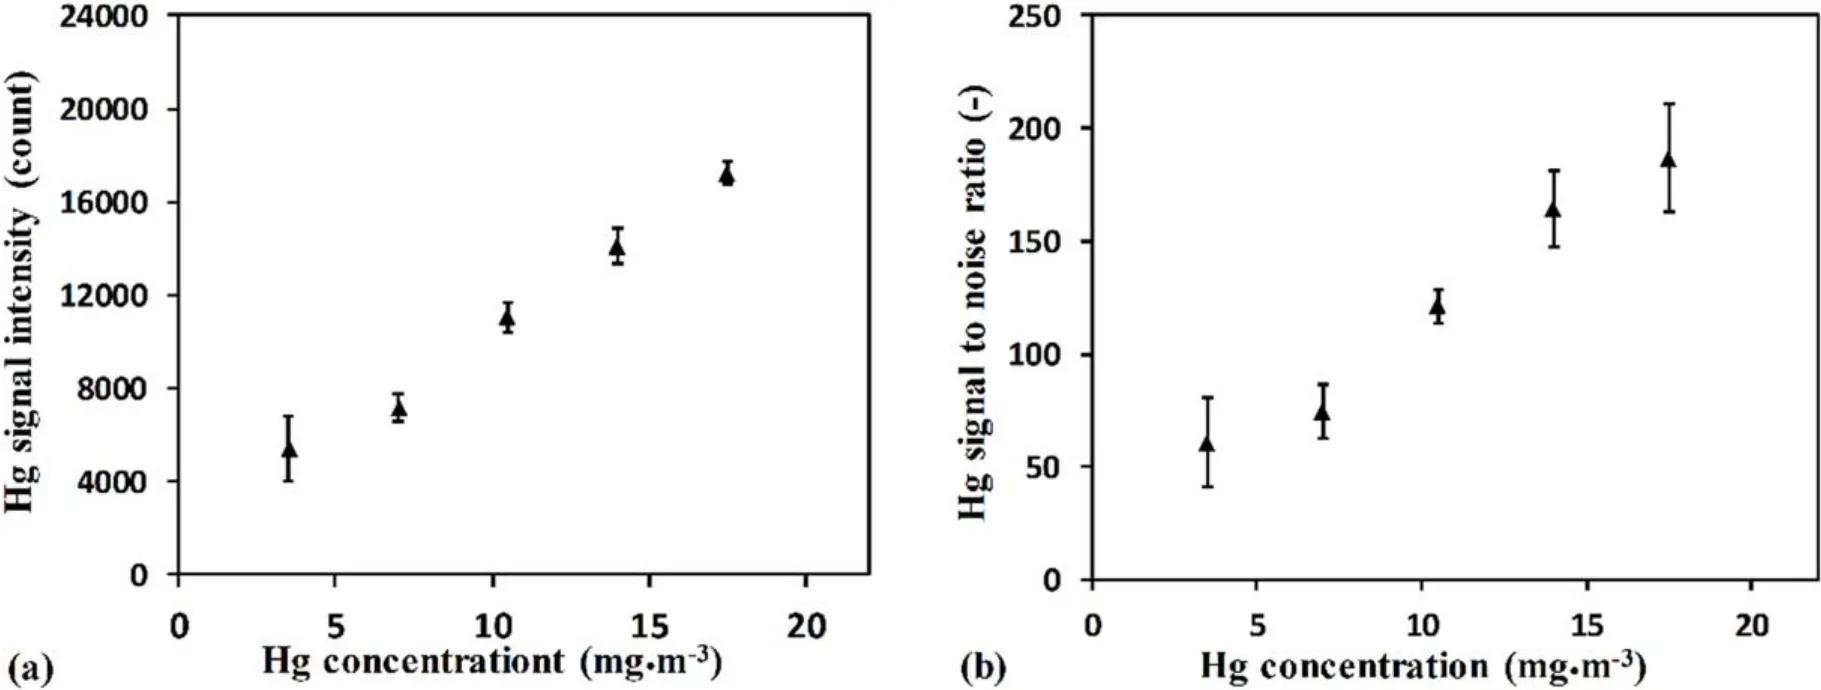
Figure 4.Measured results at different Hg concentrations with a delay time of 2500 ns and gas pressure of 10 kPa.(a)Hg signal intensity at different Hg concentrations.(b) Hg signal to noise ratio at different Hg concentrations.
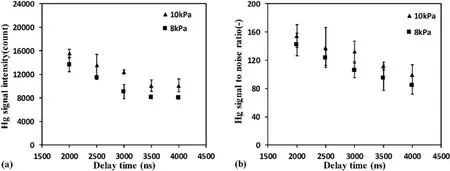
Figure 5.Measured results with different delay times for sample No.4.(a) Hg signal intensity with different delay times.(b) Hg signal to noise ratio with different delay times.
3.1.3.Influence of delay time.It is difficult to distinguish the signals of the target element in the early stage after plasma formation because of the strong interference of continuum emission from the plasma itself.Therefore,a delay time between the plasma generation and signal record time of the detector needs to be set.Different delay times will lead to different signal intensities and noise interference,which will further affect the accuracy of quantitative analysis.The influence of the delay time on LIBS measurement results was also analyzed in this study.Figure 5 shows the measured results with different delay times for sample No.4.Hg signal intensity decreased continuously when the delay time increased from 2000 ns to 4000 ns at each gas pressure,as shown in figure 5(a).It is easy to understand that the plasma was gradually cooled by the surrounding cold mixed gas,and the emission intensity of the spectra line gradually decreased with the increase of delay time.Figure 5(b) shows the Hg signal to noise ratio with different delay times.With the increase of delay time from 2000 ns to 4000 ns,the Hg signal to noise ratio also decreased at each gas pressures.This result indicates that the Hg signal intensity decreased faster than that of noise with the increase of delay time.In the mixed gas experiment with vapor of different Hg concentrations,the changes of Hg signal intensity and Hg signal to noise ratio with delay time were all consistent with this rule.However,when the delay time was too short,the C signal is oversaturated,which significantly affects the Hg signal.The delay time for quantitative analysis in this experiment was therefore 2000 ns to 4000 ns.
3.2.Quantitative analysis of mercury-containing mixed gases
The traditional calibration method and internal standard method are two commonly used quantitative analysis methods in LIBS.The traditional calibration method ignores the inhomogeneity of the plasma itself,and assumes that the plasma temperature is locally uniform [28].Scheibe and Lomakin successively put forward an empirical formula for the traditional calibration method,called the Scheibe–Lomakin formula:
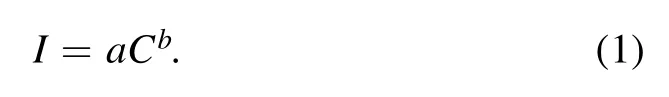
Here I is the emission intensity of the element to be measured,a is the coefficient related to the excitation condition,the excitation process of the sample and the interference elements of the sample,b is the self-absorption parameter,and C is the concentration of the measured element.When the concentration of the element is low,b ≈ 1,the element concentration is in direct proportion to the emission intensity of the element.
The internal standard method is an important technology in spectral analysis.When analyzing sample components,the selected internal standard elements are used to calibrate and reduce the influence of experimental environment and sample fluctuation on the analysis results[29,30].The basic formula of the internal standard method is:
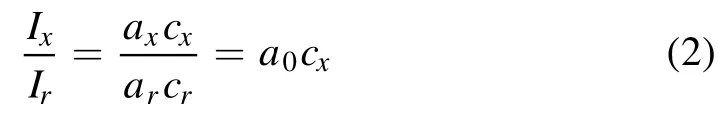
where Cxis the concentration of measured elements,Ixis the emission spectral intensity of measured elements,Cris the concentration of the internal standard element,and Iris the emission spectral intensity of internal standard elements.The calibration curve drawn by the concentration of the measured element and the intensity ratio of the measured element to the internal standard element was used to analyze the sample.
Mixed gas with different Hg concentrations was selected as the experimental sample,as shown in table 1.At mixed gas pressure of 10 kPa and with a delay time from 2000 ns to 4000 ns,LIBS technology was used to measure the five experimental samples.Hg concentration in the experimental samples was quantitatively analyzed by the traditional calibration method and internal standard method.Sample No.4 was selected as the test sample and the remaining four samples were employed to establish the prediction models of Hg concentration.Figure 6(a) shows the prediction models for the Hg concentration of mixed gas by traditional calibration methods with a delay time of 2500 ns and gas pressure of 10 kPa.This figure shows that the R2(coefficient of determination)value was 0.989 for the prediction model using the traditional calibration method,and the R2of the prediction model under other delay times was more than 0.9.In order to improve the measurement accuracy,the internal standard method also was used for quantitative analysis based on the same spectral data.In this experiment,since the element C was an element contained in the mixed gas and itsconcentration was relatively stable,it was selected as the internal standard element.The prediction models for Hg concentration in mixed gas by internal standard method with delay time of 2500 ns are shown in figure 6(b).The R2of prediction models with internal standard method was also more than 0.9 with different delay times from 2000 ns to 4000 ns.
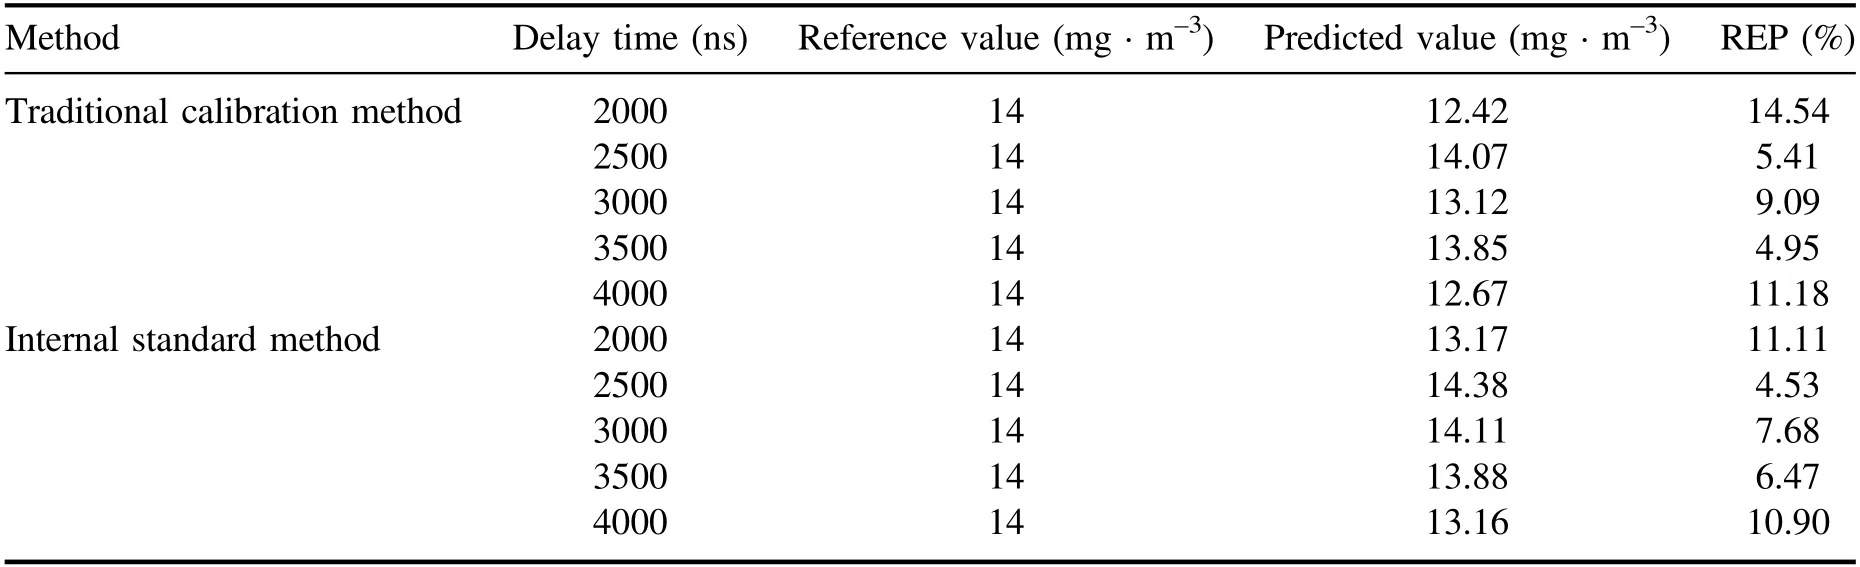
Table 2.Comparison of quantitative analysis results of Hg concentration for sample No.4 with different delay times.

Figure 6.Prediction models for Hg concentration of mixed gas by different calibration methods,with delay time of 2500 ns and at gas pressure of 10 kPa.(a) Traditional calibration method.(b) Internal standard method.
The relative error of prediction (REP) was calculated to evaluate the adaptability of these two methods to the quantitative analysis of Hg in flue gas.The REP factor was calculated as follows [11]:
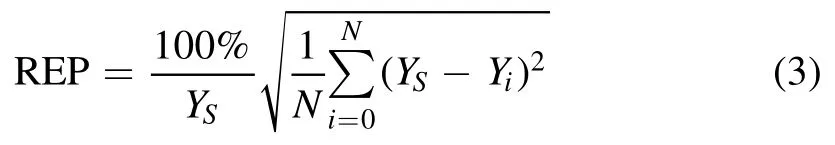
where YSis the reference value of the test sample,N is the number of measurements,and Yiis the prediction value by calibration model.REP represents the uncertainty of the predication by LIBS measurement.
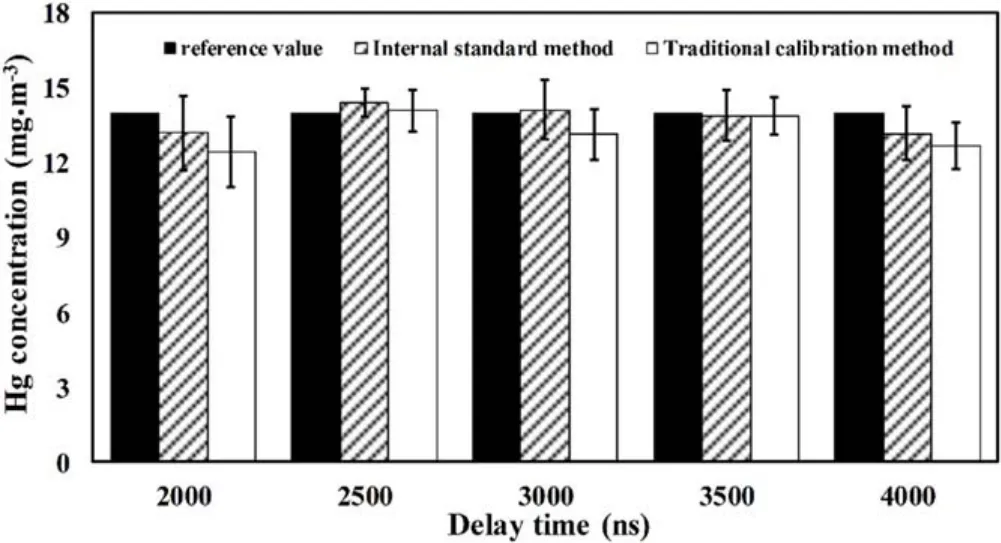
Figure 7.Comparison of quantitative analysis results of Hg concentration for sample No.4 with different delay times.
Figure 7 and table 2 show the comparison of quantitative analysis results of Hg concentration for sample No.4 with different delay times.It can be seen that experimental sample No.4 was brought into the prediction models by the traditional calibration method with a delay time from 2000 ns to 4000 ns,and the REP were 14.54%,5.41%,9.09%,4.95%,and 11.18%.For the internal standard method,the REP were 11.11%,4.53%,7.68%,6.47%,and 10.90%.Compared with the traditional calibration method,the internal standard method improved the accuracy of the quantitative analysis significantly.The REP obtained by the internal standard method was within 11.11%,while the REP of the traditional calibration method was within 14.54%.This is because the traditional calibration method is greatly influenced by the experimental parameters and the fluctuation of the sample itself.However,the internal standard method can reduce the influence of sample characteristics,ambient temperature,laser intensity fluctuation and other factors on the measurement results.Therefore,in the experimental range,the internal standard method can improve the analytical accuracy of LIBS for Hg concentration measurement in flue gas of coal-fired units.
4.Conclusion
Mixed gas was used to simulate the simplified flue gas of coal-fired units to study the influence of mixed gas pressure,mercury concentration in mixed gas and delay time on the measurement of the trace heavy metal of mercury (Hg) using laser-induced breakdown spectroscopy (LIBS).The results show that when the mixed gas pressure increased from 10 kPa to 20 kPa,the Hg signal intensity increased continuously and IHg 253.7 nm/IC 247.9 nmdecreased rapidly.The standard deviation of noise and its error gradually increased when the mixed gas pressure increased.The Hg signal to noise ratio first increased and then decreased,and reached its maximum value around 10 kPa.The 10 kPa gas pressure with high signal intensity and high Hg signal to noise ratio was selected for quantitative analysis.Hg signal intensity and signal to noise ratio increased with the increase of Hg concentration in the mixed gas.When the delay time increased from 2000 ns to 4000 ns,the Hg signal intensity and Hg signal to noise ratio decreased continuously at each gas pressure.
The Hg concentration in mixed gas was quantitatively analyzed by the traditional calibration method and internal standard method respectively.Analyzed results show that the relative error of prediction (REP) obtained by the internal standard method was within 11.11% with different delay times,while the REP of the traditional calibration method was within 14.54%.Compared with the traditional calibration method,the internal standard method can improve the accuracy of quantitative analysis significantly.Therefore,under these experimental conditions,the internal standard method can improve the analytical accuracy of LIBS used for Hg concentration measurement in flue gas of coal-fired units.
Acknowledgments
The present work was supported by National Natural Science Foundation of China (No.51506171).
杂志排行

Plasma Science and Technology的其它文章
- Way-out for laser-induced breakdown spectroscopy
- A feature selection method combined with ridge regression and recursive feature elimination in quantitative analysis of laser induced breakdown spectroscopy
- Uranium measurements using laser-induced breakdown spectroscopy in lithium chloridepotassium chloride salt of pyroprocessing
- Accuracy improvement of quantitative analysis of calorific value of coal by combining support vector machine and partial least square methods in laserinduced breakdown spectroscopy
- Rapid online analysis of trace elements in steel using a mobile fiber-optic laserinduced breakdown spectroscopy system
- The classification of plants by laser-induced breakdown spectroscopy based on two chemometric methods