Characterization of a microsecond pulsed non-equilibrium atmospheric pressure Ar plasma using laser scattering and optical emission spectroscopy
2020-06-28FengdongJIA贾凤东YongWU吴勇QiMIN敏琦MaogenSU苏茂根KeigoTAKEDAKenjiISHIKAWAHirokiKONDOMakotoSEKINEMasaruHORIandZhipingZHONG钟志萍
Fengdong JIA (贾凤东), Yong WU (吴勇), Qi MIN (敏琦),Maogen SU (苏茂根), Keigo TAKEDA, Kenji ISHIKAWA, Hiroki KONDO,Makoto SEKINE, Masaru HORI and Zhiping ZHONG (钟志萍),6,7
1 School of Physical Sciences, University of Chinese Academy of Sciences, Beijing 100049, People’s Republic of China
2 Institute of Applied Physics and Computational Mathematics,Beijing 100088,People’s Republic of China
3 Key Laboratory of Atomic and Molecular Physics & Functional Material of Gansu Province, College of Physics and Electronic Engineering,Northwest Normal University,Lanzhou 730070,People’s Republic of China
4 Department of Electrical and Electronic Engineering, Faculty of Science and Technology, Meijo University, Nagoya 468-8502, Japan
5 Graduate School of Engineering, Nagoya University, Nagoya 464-8603, Japan
6 CAS Center for Excellence in Topological Quantum Computation, University of Chinese Academy of Sciences, Beijing 100190, People’s Republic of China
Abstract A non-equilibrium atmospheric pressure argon (Ar) plasma excited by microsecond pulse is studied experimentally by laser scattering and optical emission spectroscopy (OES), and theoretically by collisional-radiative(CR)model.More specifically,the electron temperature and electron density of plasma are obtained directly by the laser Thomson scattering, the gas temperature is measured by laser Raman scattering,the optical emissions of excited Ar states of plasma are measured by OES. The laser scattering results show that the electron temperature is about 1 eV which is similar to that excited by 60 Hz AC power,but the gas temperature is as low as 300 K compared to about 700 K excited by 60 Hz AC power.It is shown that the microsecond pulsed power supply,rather than nanosecond ones,is short enough to reduce the gas temperature of atmospheric pressure plasma to near room temperature.The electron temperature and electron density are also obtained by CR model based on OES,and find that the intensities of the optical emission intensity lines of 727.41,811.73,841.08,842.83,852.44 and 912.86 nm of Ar can be used to characterize the behavior of electron density and electron temperature,it is very useful to quickly estimate the activity of the atmospheric pressure Ar plasma in many applications.
Keywords: plasma diagnosis, laser Thomson scattering, atmospheric pressure plasma(Some figures may appear in colour only in the online journal)

Table 1.Summary of emission lines for Ar atom.

where the rate coefficientsCijandCjiconcerning electron impact excitations from level i to level j with >i j, or from level j to level i with <i j, can be calculated using the expression in [17, 23]. For the reverse process of electron impact excitation, the rate coefficientsDijandDjiof electron impact de-excitation can be obtained from the principle of detailed balance.Aijis the radiative decay rate coefficient from level i to j.DBijandCBijare the stimulated emission rate coefficient and stimulated absorption rate coefficient from level i to j, respectively. The expressions for the rate coefficients referring to different atomic processes under consideration are obtained from an empirical formula[23]on the basis of the reasonable assumption that the distribution function for the atoms and electrons is of Maxwellian form in all cases. In order to calculate the energy level population,132 energy levels of the Ar atom from NIST database were used in the calculation.
In order to reproduce the experimental spectra and find the relationships between the experimental conditions and plasma parameters, a series of simulated spectra given as functions of electron temperature and electron density can be obtained by CR model and equation (3). In the simulation process, an absolute calibration has been made in order to relate the intensity of the lines to the corresponding relative excited state population. The calibration formulaIexp=cχ jmentioned inχj=n j/n0is the normalized populations of level j andn0is[17] is applied in our work, whereIexpis the intensity of the observed emission line, c is the calibration constant,the total number of argon atoms in the plasma. As calibration conditions, the electron densityne=4.48 × 1012cm-3and electron temperatureTe=1.08 eV,measured with the LTS probe at a discharge voltage of 7 kV,were used to calculateχjby equation (4). With these values we have calculated calibration constant c, and introduced the calibrated intensities in the model as input parameters.
Finally, for accuracy, we define the deviation formula to evaluate the agreement degree[24,25]between experimental and calibrated theoretical spectra as

whereIexpis the experimental spectral intensity,Icalis the simulation intensity, and N is the number of lines. Simulated spectra intensities are computed between electron temperature Te= 0.5 and 2.0 eV at 0.01 eV increments, and between electron density ne=1.0×10¹²and 1.7×1013cm-3at 0.1×1012cm-3increments(the determination of such range depends on neand Teobtained by the LTS method for all applied voltages). A minimum value among the deviations means a best estimated value of the electron temperature and electron density that is usually less than 5%.
3. Experiment
The experimental set-up is shown in figure 1. The discharge parts of the plasma contain two metal electrodes, which are two parallel blades with a length of 3 mm. The gap between the two blade electrodes is adjusted about 1 mm. Both the electrodes are coated by an insulating layer to avoid arc discharge, which means that the plasma can be classified as dielectric barrier discharges.The Ar gas flows into the plasma region by a gas tube with an inner diameter of 4 mm which is a little bigger than the length of blade electrodes.The gas tube is perpendicular to the long edge of the blade electrode and is put near the discharge region which is not shown in the figure 1. The Ar gas flow rate is high enough to push all the air away in the discharge region, and also as low as to avoid generating any plasma jet.

Figure 1.Setup of the experimental diagnosis system.The electrodes structure and an image of plasma are also shown.
The simple non-equilibrium atmospheric pressure Ar plasma is driven by a microsecond pulsed high voltage,which is generated by seeding a tunable signal with voltage from 0 to 5 V to an AC/DC amplifier. More specifically, a digital delay generator (Stanford Research Systems DG535) is used to generate a 30 Hz TTL signal,and the TTL signal is used to trigger a multi-functional signal generator (WF1314). The multi-functional signal generator is used to generate a tunable signal with voltage from 0 to 5 V and pulse width of 40 μs.Then the signal is amplified about several thousand times by an AC/DC amplifier (HVA4321). The voltage amplitude is tunable from 5 to 10 kV with a pulse duration of 40 μs, and the pulse width is limited by the raising time of HVA4321.Finally, high voltage pulses are applied to the two metal electrodes,and one of electrodes is grounded through a 50 kΩ resistor which limits the current. Figure 2 shows a typical high voltage pulse measured by a high voltage probe (Tektronix P6015A). The 30 Hz TTL signal generated by DG535 is also used to synchronize the image-intensified chargedcoupled device of triple grating spectrometer (TGS) and the laser pulse as shown in figure 1. In summary, the discharge voltage is about several kV, the current of discharge is about 100 μA limited by the 50 kΩ resistor, the time duration of plasma is about 40 μs.The discharge area is limited between the two blade electrodes. The plasma volume is approximately a cuboid with a length of 3 mm and a cross-sectional area of 1×0.5 mm2.

Figure 2.A typical discharge voltage with 8 kV, the pulse width is about 40 μs. All the measurements are taken at the peak of voltage.
The LTS set-up has been previously described [26].Briefly, the incident laser was provided by a frequency doubled Nd:YAG laser, and the laser beam with about 5 mJ/pulse was focused on the plasma by the doublet lens to a beam waist diameter of 200 μm.The laser scattering light by plasma was collected to a TGS [26–30]. The Rayleigh scattering is attenuated about six orders of magnitude by TGS,and then LTS and laser Raman scattering can be measured respectively by changing the polarization of the incident laser.More specifically, the laser scattering signal is mainly contributed by laser Raman scattering signal when the polarization of the incident laser is parallel to the direction of collecting scattered light, and the laser scattering signal includes both laser Raman scattering and LTS when the polarization of the incident laser is perpendicular to the direction of collecting scattered light [26–30]. The laser scattering is measured at the maximum point of high voltage pulse. For each laser scattering measurement, we accumulate 15 000 laser pulses to achieve a satisfactory signal-to-noise ratio. For OES measurements, emission from the plasma was collected by a lens with 25 dB attenuator of 532±5 nm and then transported to a portable spectrometer (Ocean USB4000). The spectral resolution of USB4000 is about 0.5 nm. The measured spectral intensities of a calibration lamp(SL-1 and SL-3,Stellarnet Inc.)are used for calibrating the spectrometer and its detector.The results are basically the same as the test results when the spectrometer is delivered from the factory. The spectrometer has set its own compensation in data analysis processes which can be used directly.
4. Results and discussion
4.1. Measurements of the laser scattering
A pure Ar atmospheric pressure discharge is prepared by pushing air away from the discharge region using an Ar gas flows.Noted that,the Ar gas flow rate should be high enough to push all the air away in the discharge region, and also as low as to avoid generating any plasma jet. We measured the Raman scattering of air with different Ar gas flow rates to make sure the air is push away,also the air Raman scattering is used to test the gas temperature of microsecond pulsed nonequilibrium atmospheric pressure plasma.Figure 3 shows the air Raman scattering with different Ar gas flow rates of 0 sccm, 10 sccm, 20 sccm, 50 sccm, 100 sccm, respectively.The intensity of air Raman scattering is reduced to 10-7by an Ar gas flow rate of 50 sccm, which means almost pure Ar plasma, and the intensity of air Raman spectrum is still enough to analyze the gas temperature in the plasma. The plasma discharge was still located between two parallel blade electrodes with gas flow rate up to 100 sccm, without producing a jet in the direction of the Ar gas flow.Therefore,in the following experiments,the Ar gas flow rate was fixed at 50 sccm.

Figure 3.The Raman scattering of air with different Ar gas flow rates of 0 sccm, 10 sccm, 20 sccm, 50 sccm, 100 sccm, respectively.

Figure 4.The experimental Raman scattering of air discharge(black)and corresponding fitted with gas temperature of 325 K (red).
Figure 4 shows the experimental laser Raman scattering of air discharge, and corresponding gas temperature Tgis fitted by 325 K. We also measured the remained air Raman scattering during discharge with different Ar gas flow rates,and then analyzed the gas temperature of plasma. These results show that the gas temperature in the plasma decreases with the increase of Ar flow, and gradually approaches to room temperature 300 K when it is almost pure Ar plasma.The results are shown in figure 5.The error is 5 K due to the fitting error.
Compare to other atmospheric pressure plasmas, such as

Figure 5.The gas temperature in plasma with different Ar flow rates.
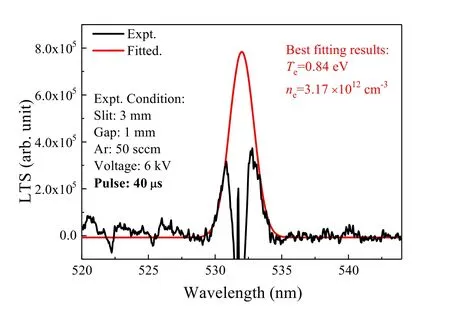
Figure 6.The experimental laser Thomson scattering spectrum and the corresponding theoretical fitting result.

Figure 7.The dependence of electron density and temperature on discharge voltage.

Figure 8.(a)The optical emission of plasma with discharge voltages of 6,8 and 10 kV,(b)the experimental intensities of Ar lines 727.41,811.73, 841.08, 842.83, 852.44 and 912.86 nm with different discharge voltages.
Tg≈700–1550 K excited by DC discharges[29],Tg≈2500 K excited by 2.45 GHz microwave [30], Tg≈700 K excited by 60 Hz AC power [26], Tg≈300 K excited by nanosecond pulse [31], Tgexcited by microsecond pulsed power supply is much lower. It is shown that the microsecond pulsed power supply, rather than nanosecond ones [31], is short enough to reduce the gas temperature to near room temperature. As we know that the collisional rate should be about 10 times larger than the radiative rate if the plasma tends to local thermal equilibrium,and also the collision times should be much longer than the times characterizing the existence of plasma [32].The lifetime of metastable states in molecular nitrogen is about hundreds of microseconds [33], and the electron density is about 1014cm-3in air discharge [26], therefore these conditions are far from enough to heat the molecular and atomic temperature in the microsecond pulsed plasma.
The electron temperature and density are measured by LTS after obtained a pure Ar plasma and the optical emissions from the plasma are measured simultaneously by a portable spectrometer. Figure 6 shows a typical experimental LTS spectrum and the corresponding theoretical fitting result. The experimental conditions are also shown in figure 6, with Ar gas flow rate of 50 sccm,6 kV high voltage with pulse width of 40 μs. The electron temperature is about 0.84 eV and the electron density is about 3.17×1012cm-3by calibrated with the laser Raman scattering of air without discharge [26].
Then, the electron temperature and density were measured with different high voltages with same pulse width of 40 μs.Figure 7 shows the relationship of electron density and temperature on discharge voltage. The electron temperature shows a slight decreasing with the increasing of discharge voltage, and the electron density shows an obvious increase with the increasing of discharge voltage.With the increase of the discharge voltage, the discharge current will increase slightly,which will cause more energy to be injected into the plasma, thus increasing the electron density. Meanwhile, the increase of electron density will lead to the decrease of the electron free path in the plasma, which will affect the acceleration distance of electrons in the electric field. When the product of average free path and electric field intensity decreases with the increase of excitation voltage,there will be a slight decrease in electron temperature, which is consistent with the phenomena observed in our experiments.
4.2. Calculation based on OES measurements
While measuring the laser scattering spectrum with different discharge high voltages, we also record the emission spectrum of the plasma by a portable spectrometer (Ocean USB4000). The spectral resolution of USB4000 is about 0.5 nm, which is enough to distinguish the main optical emission of excited Ar states in plasma. We identify the transitions in the measured spectrum by comparing them with NIST data, the results are shown in detail in table 1 and figure 8.It can be seen from figure 8 that the intensities of the experimental spectra change with the change of discharge voltage. The normalized experimental and theoretical intensities of Ar lines 727.41,811.73,841.08,842.83,852.44 and 912.86 nm with different discharge voltages are analyzed in figure 9, and a good agreement is obtained in most cases.Here, the normalization of the experimental and theoretical intensities is to divide the intensities of selected lines at different voltages by the intensity of 812.17 nm at 9 kV. Then,the electron temperature and density through theoretical simulation are obtained and presented in figure 10.It is worth mentioning that the experimental and simulated values of the electron density and temperature shown determined with the LTS and OES are the spatially and temporally averaged values. Table 2 shows the comparison of the results of theoretical simulation and the LTS measurements, which shows a similar behavior to that of experimental results.This work confirms that the intensities of the optical emission Ar lines 727.41, 811.73, 841.08, 842.83, 852.44 and 912.86 nm can be used to characterize the behavior of electron density and electron temperature of the atmospheric pressure Ar plasma.It should be noted that,the CR model gets the steadystate solution in the present theoretical calculation, but it is difficult to deal with the problem of spatial resolution, which means that it can be only used to explain the average value in space. Here, our results show that the CR model can explain the main characteristics of the plasma, and can help to judge the main parameters of the plasma quickly.

Figure 9. The normalized experimental (dash lines) and theoretical intensities (solid lines) of Ar lines 727.41, 811.73, 841.08, 842.83,852.44 and 912.86 nm with different discharge voltages.

Figure 10.The theoretical electron density and temperature at different discharge voltages.
5. Conclusions
In conclusion, we made a simple non-equilibrium atmospheric pressure Ar dielectric barrier discharge and excited itby a microsecond high voltage pulse. The behavior of such dielectric barrier discharge plasma is characterized by laser scattering and OES. More specifically, the electron temperature and electron density are obtained directly by the LTS,the gas temperature is measured by laser Raman scattering,the optical emissions of excited Ar states are measured by OES. The air Raman scattering shows that the gas temperature of plasma is as low as 300 K compared to about 700 K excited by 60 Hz AC power.It is shown that the microsecond pulsed power supply, rather than nanosecond ones, is short enough to reduce the gas temperature to near room temperature. The electron temperature is about 1 eV which is not sensitive to the discharge voltage, and the electron density increased from ~3×10¹²to~13×1012cm-3with discharge voltage from 6 to 10 kV. This indicates that the microsecond pulsed is not short enough to enhance the electron temperature. Compared the electron temperature and electron density obtained by the LTS and a CR model with OES measurements, it confirms that the intensities of the optical emission Ar lines of 727.41, 811.73, 841.08, 842.83,852.44 and 912.86 nm can be used to characterize the behavior of electron density and electron temperature, it is very useful to quickly estimate the activity of Ar plasma in many applications.

Table 2. The comparison of Te and ne obtained by theoretical simulation with OES and the LTS measurements.
Acknowledgments
This work is supported by the National Key Research and Development Program of China (Nos. 2017YFA0402300,2017YFA0304900 and 2016YFA0300600), National Natural Science Foundation of China (Nos. 11604334, 11575099,11474347 and 11874051), the Strategic Priority Research Program of Chinese Academy of Sciences(Nos.XDB28000000 and XDB07030000), the Open Research Fund Program of the State Key Laboratory of Low-Dimensional Quantum Physics(KF201807).
猜你喜欢
杂志排行

Plasma Science and Technology的其它文章
- First-principles study on the mechanical properties and thermodynamic properties of Mo–Ta alloys
- Formation mechanism of Al2O3/MoS2 nanocomposite coating by plasma electrolytic oxidation (PEO)
- Estimation of the sheath power dissipation induced by ion cyclotron resonance heating
- Influence of toroidal rotation on the tearing mode in tokamak plasmas
- Conversion between Vickers hardness and nanohardness by correcting projected area with sink-in and pile-up effects
- In-port-plug transmission line design of the ITER plasma position reflectometer