Statistical variability and fragility assessment of ballistic perforation of steel plates for 7.62 mm AP ammunition
2020-06-28MarkStewartMichaelNetherton
Mark G. Stewart, Michael D. Netherton
Centre for Infrastructure Performance and Reliability, The University of Newcastle, New South Wales, 2038, Australia
Keywords:Ballistics Probability Statistics Steel plates Armour steel Ammunition Experimental Perforation
ABSTRACT The paper describes field test results of 7.62×51 mm M61 AP (armour piercing) ammunition fired into mild steel targets at an outdoor range. The targets varied from 10 mm to 32 mm in thickness. The tests recorded penetration depth, probability of perforation (i.e., complete penetration), muzzle and impact velocities,bullet mass,and plate yield strength and hardness.The measured penetration depth exhibited a variability of approximately ±12%. The paper then compared ballistic test results with predictive models of steel penetration depth and thickness to prevent perforation. Statistical parameters were derived for muzzle and impact velocity, bullet mass, plate thickness, plate hardness, and model error. A Monte-Carlo probabilistic analysis was then developed to estimate the probability of plate perforation of 7.62 mm M61 AP ammunition for a range of impact velocities, and for mild steels, and High Hardness Armour (HHA) plates. This perforation fragility analysis considered the random variability of impact velocity,bullet mass,plate thickness,plate hardness,and model error.Such a probabilistic analysis allows for reliability-based design,where,for example,the plate thickness with 95%reliability (i.e. only 1 in 20 shots will penetrate the wall) can be estimated knowing the probabilistic distribution of perforation.Hence,it was found that the plate thickness to ensure a low 5%probability of perforation needs to be 11-15%thicker than required to have a 50/50 chance of perforation for mild steel plates.Plates would need to be 20-30% thicker if probability of perforation is reduced to zero.
1. Introduction
Steel plates are often used for protective design against small calibre ballistic threats. Is more concerned about Perforation of a target, defined as complete penetration through the target, is an important concern for armour and protective design. Smith and Hetherington[1]state that“a ballistic event repeated several times can yield a number of different results”. Nilakantan [2] notes that“spread and scatter” of ballistic results is dependent on the stochastic variability in materials and testing.
However,ballistic design is essentially deterministic,such as the minimum wall thickness needed to stop perforation (e.g., Ref. [3])and the design of escalator bullet traps at indoor shooting ranges(e.g., Refs. [4,5]). It is well accepted that deterministic approaches do not quantify the level of safety for a given design, and that probabilistic methods are well suited to determining the level of safety and risk by considering uncertainty and variability of projectile mass, velocity, and dimensions and material properties of the target (e.g., Refs. [6,7]). Repetitive ballistic testing is needed to reveal the variability of projectile penetration and perforation. For example,Trasborg et al.[7]used Monte-Carlo simulation methods to estimate the probability of injury for personnel located behind a 150 mm thick concrete wall for small calibre munitions. A probabilistic analysis allows for reliability-based design, where, for example, the wall thickness with 95% reliability (i.e. only 1 in 20 shots will penetrate the wall) can be estimated knowing the probabilistic distribution of perforation depths (e.g., Ref. [6]). A somewhat similar approach was developed by Nilakantan et al.[8]who used probabilistic methods to simulate the impact velocity needed to perforate Kevlar woven armour with probabilities from 0% to 100%. These probabilistic approaches can also be applied to airblast, ground shock and other damaging effects of military munitions(e.g. Refs. [9-11]).
The penetration of projectiles into steel targets helps in the understanding and modelling of terminal ballistics. Hence, the paper describes field test results of 7.62×51 mm M61 AP(armour piercing) ammunition fired at an outdoor range in Australia. The targets were mild steel plates of Grade 350 MPa, and 70 rounds were fired in total. The tests recorded penetration depth, probability of perforation(i.e.,complete penetration),muzzle and impact velocities, bullet mass, and plate thickness, yield strength and hardness.Statistical parameters were then derived for muzzle and impact velocity, bullet mass, plate thickness, plate hardness, and model error.
Field testing was used to replicate realistic battlefield conditions where variability is likely to be much higher than controlled laboratory (indoor) firing ranges. This test replicates the type of commercially available mild steel typically used in buildings,bridges and other civilian infrastructure-this is also of interest for collateral damage estimation. Moreover, for force protection mild steel plates are more easily (and quickly) sourced in theatres of military operation than specialised and costly armour plate. However, a fragility analysis is conducted for armour plate later in the paper to assess the effectiveness and variability of armour plate when compared to mild steel protection.
It is important to note that many studies on the ballistic penetration of 7.62 mm AP rounds are based on the heavier 7.62 mm×63 mm APM2 round (e.g., Refs. [12-14]). This round remains“the bullet of choice”for many armour test standards,and because it is no longer a current battlefield round it is“very popular with researchers and armour technologists” [15]. However, one of the aims of the present paper is to assess the ballistic characteristics of a current 7.62×51 mm M61 AP battlefield round.
The paper presents existing and well known predictive models of steel penetration depth and thickness to prevent perforation and compares these to the ballistic test results.This allows model error(i.e., model accuracy) to be estimated for each predictive model. A probabilistic analysis is then developed to estimate the probability of plate perforation of 7.62 mm M61 AP ammunition for a range of impact velocities and plate types (Grade 250 and Grade 350 mild steels, and HHA armour plate). This perforation fragility analysis uses Monte Carlo simulation analysis and considers the random(statistical) variability of impact velocity, bullet mass, plate thickness, plate hardness, and model error. In other words, parameter uncertainties are propagated through the analysis to estimate the probability of perforation for a specific plate thickness. This is followed by a sensitivity analysis.
2. Ballistic field tests
The ballistics testing procedure was developed to suit the facilities and procedures in place at the outdoor rifle range where the testing was undertaken.
2.1. Weapon and ammunition
The weapon had a 16 inch(405 mm)barrel length.Note that due to security regulations this paper cannot disclose the type of weapon used. The bullets selected were 7.62×51 mm AP ammunition. The 7.62 mm×51 mm AP ammunition is manufactured by CBC Brazil with a hardened steel core. This round is similar to the United States 7.62 mm×51 mm AP M61 round, and the NATO P80 round [16]. A schematics of the 7.62×51 mm M61 AP round is shown in Fig.1.The projectile comprises of 42.9%brass,38.6%hard steel core (which is also the tip), and 18.5% lead [17]. Fig. 2 shows the recovered hard steel core after plate perforation [17]. These rounds have a similar penetrating capacity of the heavier(and out of production)US 30-06′′Springfield APM2 and 7.62 mm×54 mm API B-32 rounds due to the M61 and P80 rounds having a core that is “more like the head of an arrow” that prevents the core from being fragmented[15].Nominal characteristics of this ammunition are given in Table 1. This AP round is described as a high ballistic threat [3].
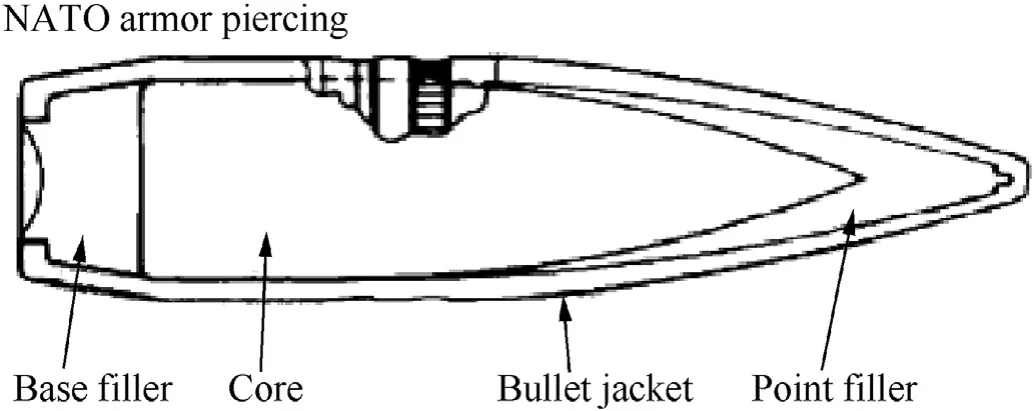
Fig.1. Schematic of a 7.62×51 mm M61 AP projectile [44].
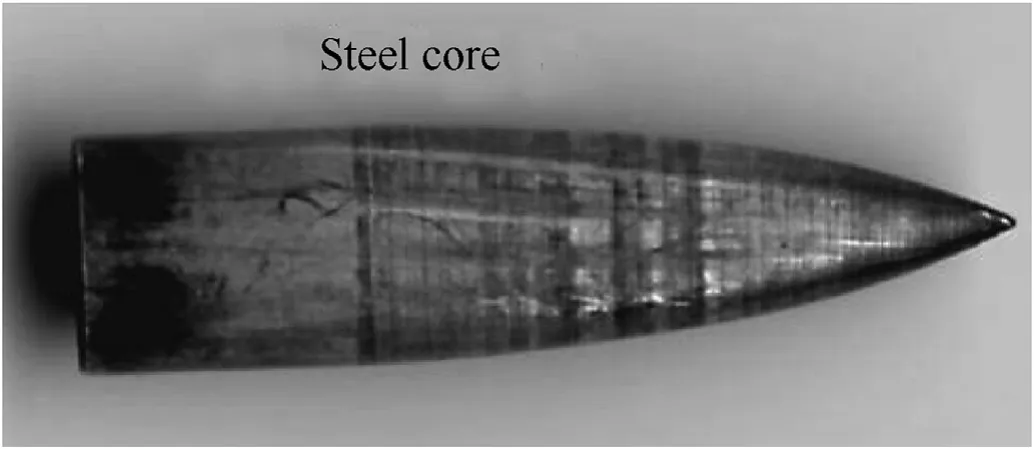
Fig. 2. Recovered hard steel core after plate perforation by a M61 AP projectile [17].
2.2. Target selection
Commercially available Grade 350 MPa mild steel plates were selected. A portion of each plate was set aside so that a sample could later be machined from each plate to test the yield strength and Brinell Hardness(BHN)of the plates.The“typical”hardness for Grade 350 steel is 140-180 BHN[18].UFC 4-023-07[3]specifies the BHN for mild steel is 110-160.The measured mean hardness of the plates is 152 BHN (measurements varied by ±5 BHN) which conforms to this typical range. The measured yield strength for each plate varied from 340 to 410 MPa, with a mean value of 375 MPa(see Table 2).
2.3. Ballistic tests
The ballistic field testing was undertaken at an outdoor rifle range.The test plates(400 mm×400 mm)were fixed to a frame at a range of 50 m(see Fig.3).A doppler radar was set up to record the velocity of each projectile from the muzzle to impact location.Ten rounds were fired at each plate. The weather on the day of testing was overcast with some rain with a temperature of 16-19°C.There was a consistent breeze blowing from the target towards the shooter estimated to be 10-20 km per hour (2.8-5.6 m/s).
2.3.1. Measurement of velocity
The muzzle velocity of each round was measured using a commercially available doppler radar (LabRadar). The doppler radar can measure muzzle velocity,and impact velocity over a range of 100 m. The velocity measurements according to the manufacturer are accurate to 0.1%. The statistical parameters for muzzle velocity are shown in Table 3. Some measurements were affected by rain, and so were not recorded. It is observed that the muzzle velocities vary by no more than ±1%, and impact velocities by nomore than ±2%.

Table 1 Nominal specifications for ammunition.

Table 2 Dimensional and material properties of mild steel targets.
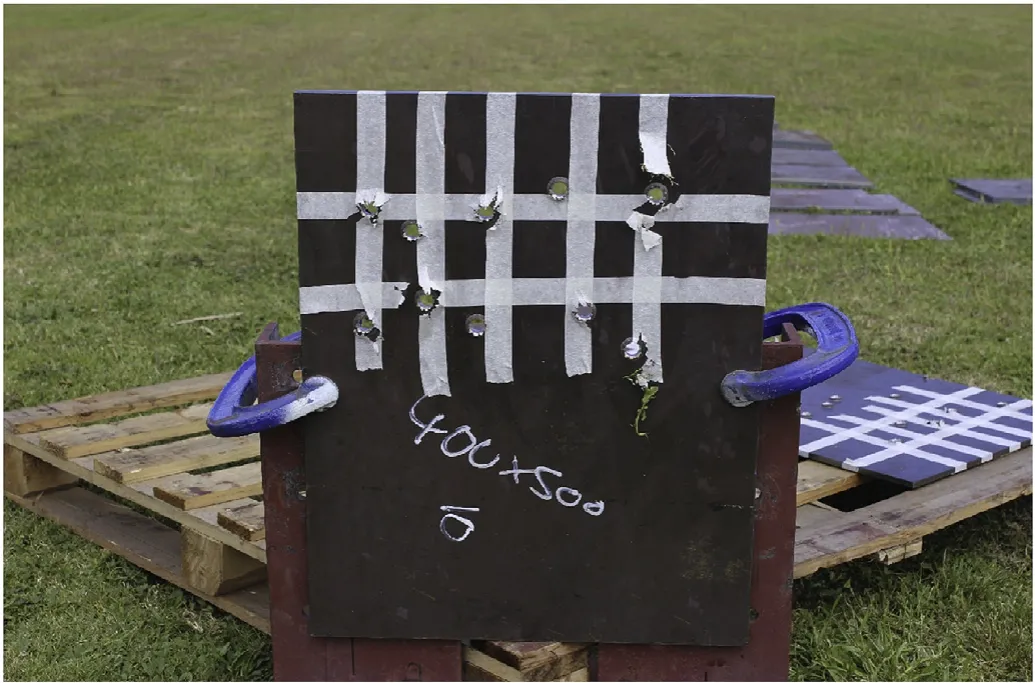
Fig. 3. Test Set Up of Target Plate (tape provides aiming points for the shooter).
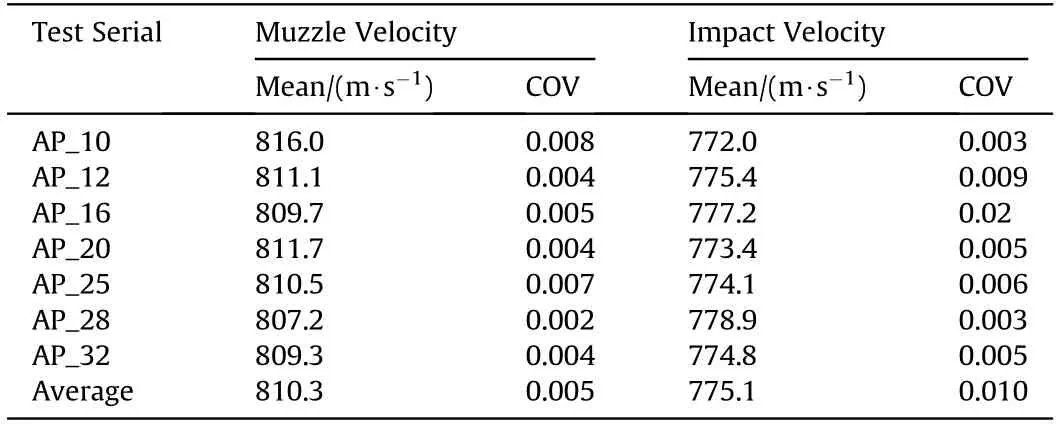
Table 3 Statistical parameters for muzzle and impact velocities.
2.3.2. Measurement of projectile weight
During the terminal ballistic field testing, seven bullets were separated from the cartridges using a kinetic bullet puller. The mean and coefficient of variation (COV) of projectile mass are 9.592 g and 0.003, respectively.
2.3.3. Penetration and perforation mechanisms
The Ballistic Damage Code summarised by Crouch [15] is:
· A No evidence of damage to front or rear of target
· B Some evidence of impact damage to the front of the target but no evidence of damage to the rear
· C Development of a smooth bulge on rear of target
· D Development of a cracked bulge on rear of target
· E Development of a cracked bulge, with light shining through target (represents the start of perforation)
· P Development of a pin-hole,through the target,caused by the partial penetration of the nose of the round
· W Full penetration of the round through the target
The U.S. Army ballistic limit defines damage code E as “failure”[19]because vehicles need to remain airtight on the battlefield.This is the“classic ballistic limit for steel structures”.On the other hand,the more common ballistic limit is the U.S.protection ballistic limit that defines failure as perforation of a witness panel placed behind the target plate as this is“critical to protect people and equipment inside, or behind, an armoured structure” [19,20]. Hence, in the present paper, perforation is defined herein as the impacting projectile passing completely through the target plate (i.e., Ballistic Damage Code“W”).This is similar to the navy ballistic limit.Table 4 shows the likelihood of damage code for each serial,as well as the probability of perforation.
The crater formed by the impact of each projectile was round and fairly uniform,and petalling on the front face of the plate was observed in all instances, see Fig. 4. Petalling on the front plate indicates that the penetration mechanism is a combination of ductile failure and spalling[21].Recht[22]notes that for thin plates the penetration process is affected by petalling.
Fig. 5 shows that four rounds passed completely through the 20 mm target plate (i.e., Ballistic Damage Code W - Pr(perforation)=40%),whereas the remaining six rounds penetrated the full thickness of the plate but did not exit the plate(see Fig.6).It is not clear which damage code that can be allocated for these six rounds,hence,the present paper assume that the Ballistic Damage Code is P. There was no perforation or development of pin-holes (W or P)for the thicker 25 mm plate.
The depth of penetration of each round was measured for plates that showed no deformation on the rear surface. In other words,this ensures that the ballistic tests replicated the penetration of semi-infinite plates. As expected, these were the thickest plates -i.e.,28 mm and 32 mm.While scanning the deformed target would have been preferable, this was not available. Hence, these measurements were made using a digital depth gauge.Note that someof the AP rounds were embedded in the plate, making it not possible to measure penetration depth.

Table 4 Observed damage code for each test.
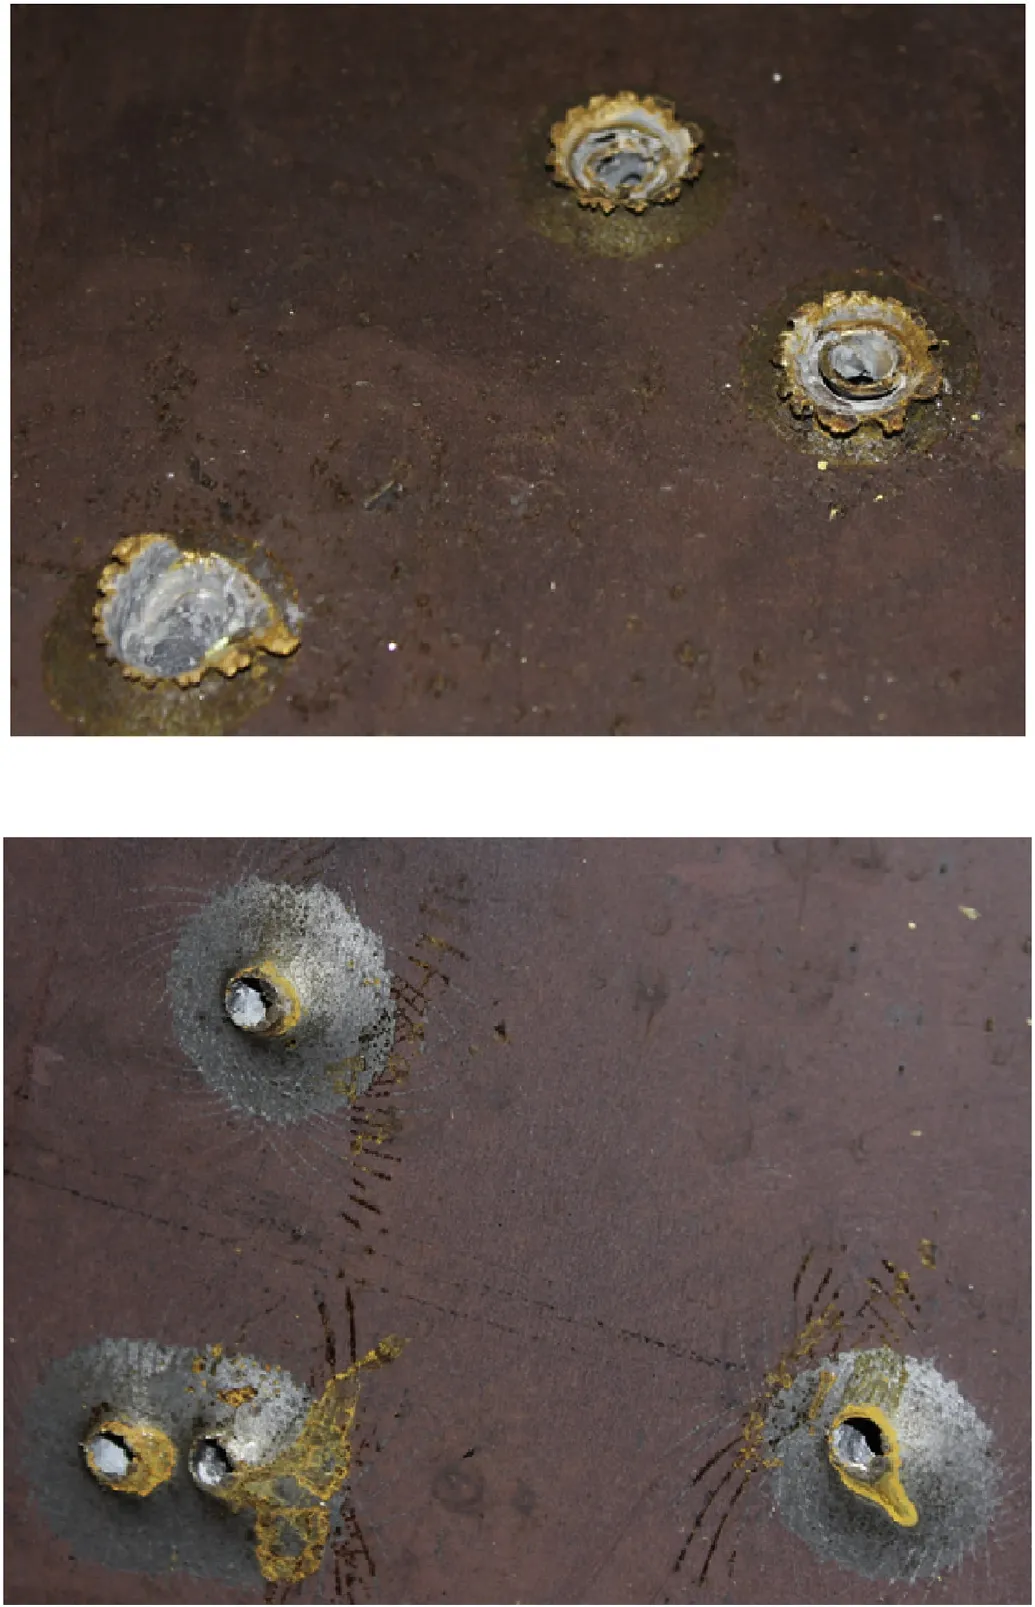
Fig. 4. Front (top) and Rear (bottom) Faces, for 12 mm plate for 7.62 AP Serial AP_12 Showing Complete Penetration.
3. Ballistic test results
3.1. Penetration
The histograms of measured penetration depths are shown in Fig.7,and statistical parameters for depth of penetration are shown in Table 5.The COV of steel penetration is approximately 0.06 (i.e.,variability of ±12%). The variability may be due to variability of impact velocity,or to the rounds being“yaw dependent”[23].Note that the variability of measured penetration depth for ball (lead)ammunition is lower for 7.62×51 mm M80 ammunition, but higher for 5.56×45 mm F1 ball ammunition [24].
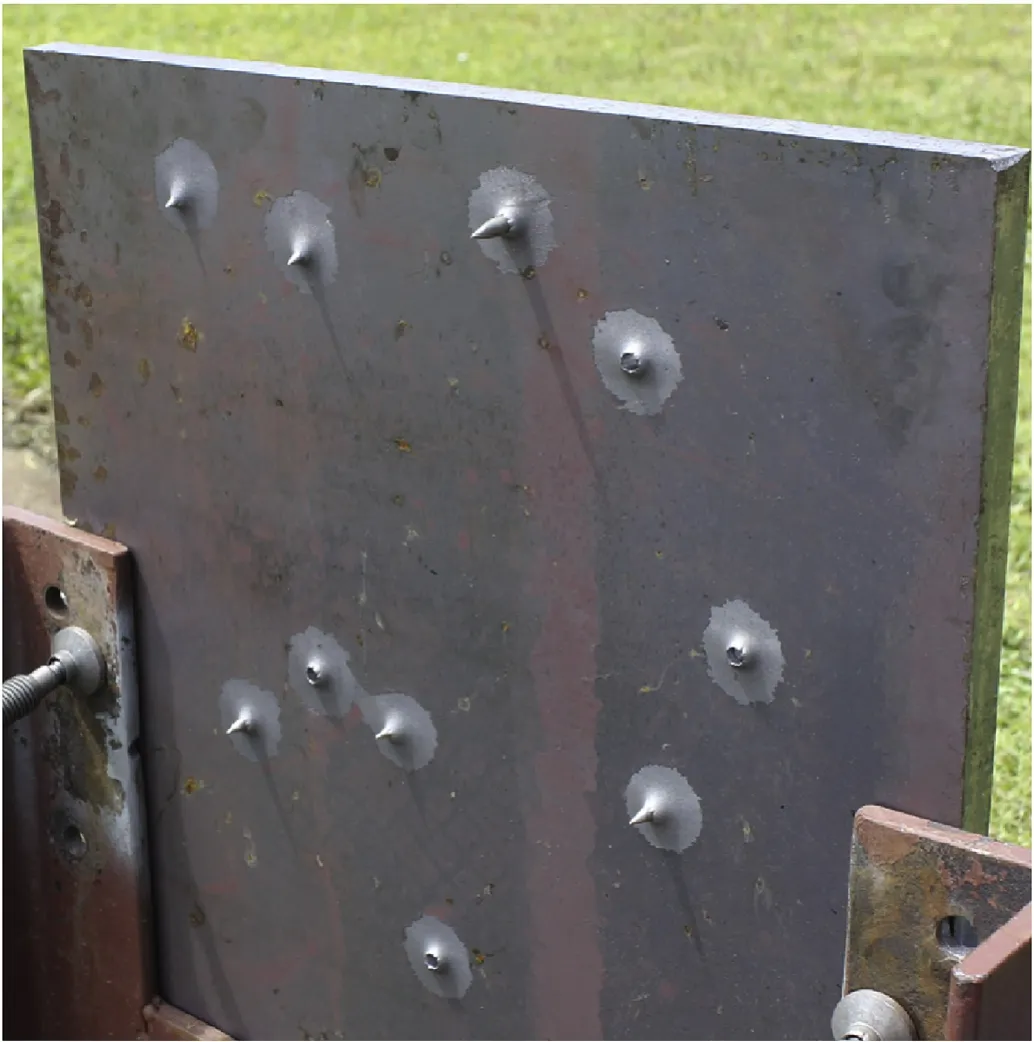
Fig. 5. Damage to 20 mm plate for 7.62×51 mm AP rounds (Serial AP_20).
3.2. Perforation
Perforation is defined as complete penetration of the round through the target plate.Fig.8 shows the probability of perforation where the difference in plate thickness between zero and full penetration is 9 mm,due to the larger differences in commercially available plate sizes tested(16,20,25 mm).Fig.5 shows that all the rounds were close to full penetration for the 20 mm plate,and 100%perforation is likely to have occurred if the plate thickness was 1-2 mm thinner than 20 mm. Hence, it is likely that 100% perforation would have occurred if the plate thickness was about 18 mm.Conversely, Fig. 5 also shows that if the plate was slightly thicker,then most,if not all rounds,would have failed to fully penetrate the plate.In this case,it is highly likely that 0%perforation would have occurred for a slightly thicker plate,so say 22 mm.Hence,the“line of best fit”in Fig.8 is corrected so that(i)100%perforation occurs at 18 mm thickness,and(ii)0%perforation occurs at 22 mm thickness.
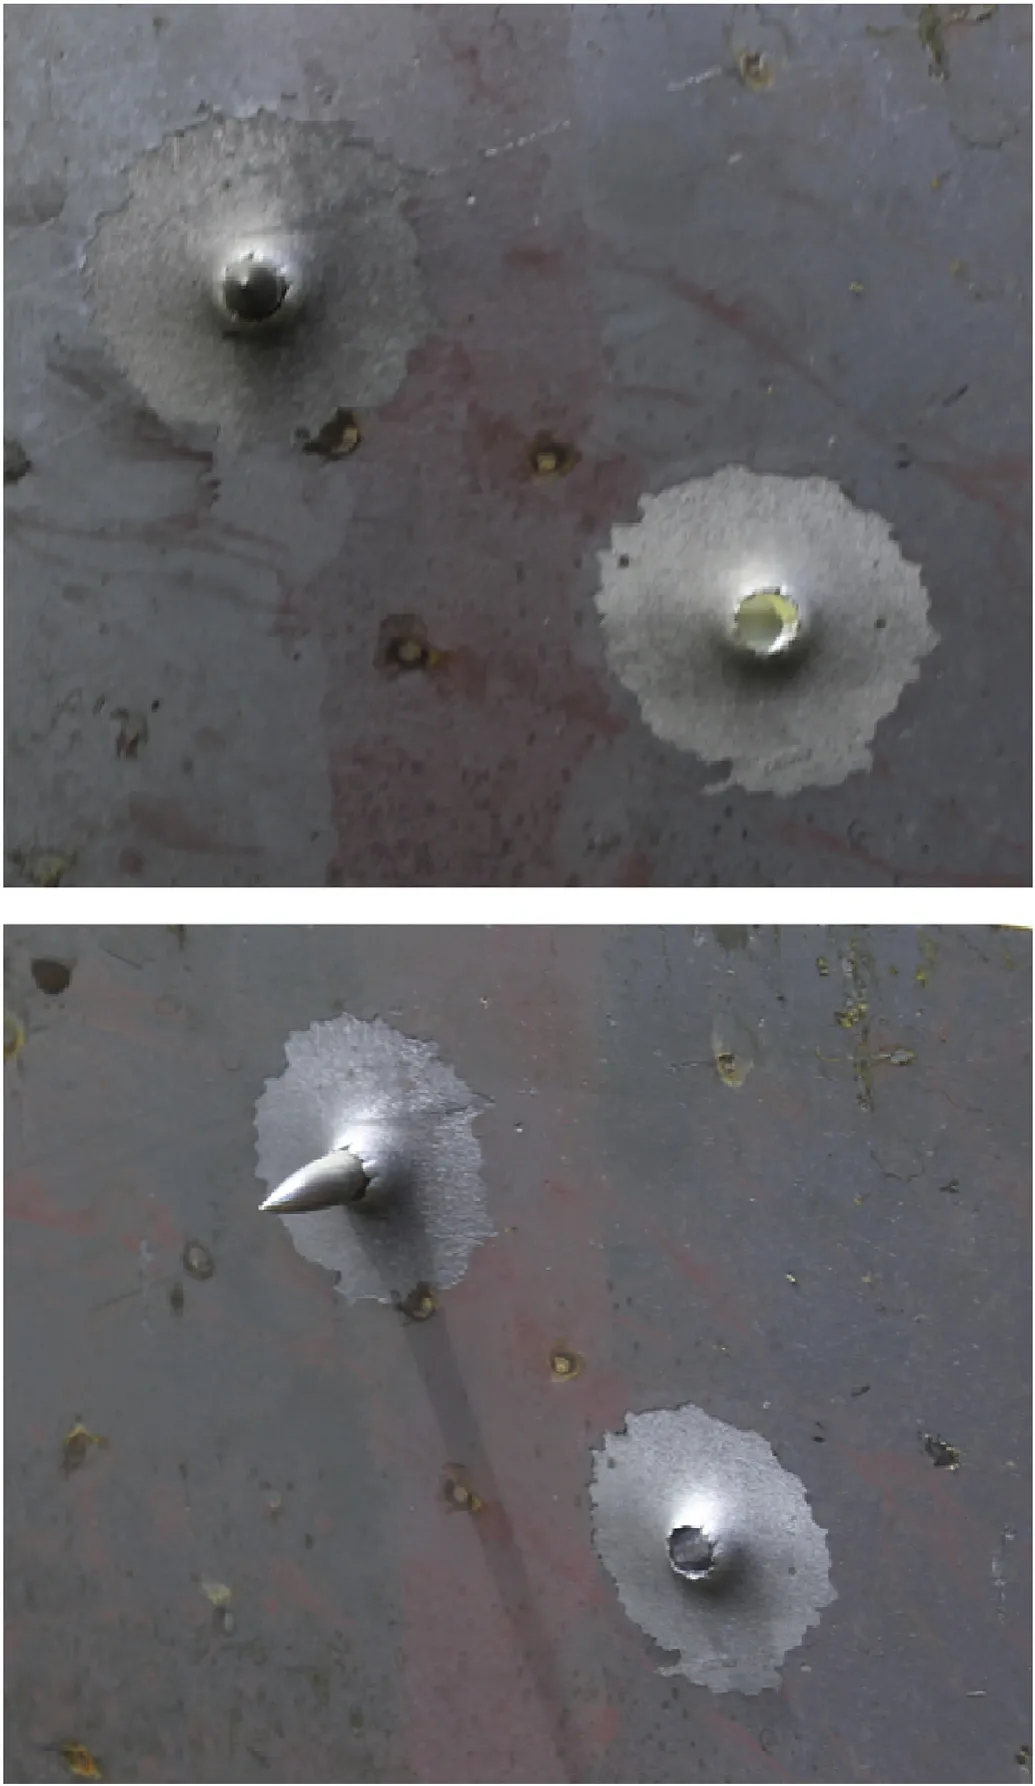
Fig. 6. Detail of Damage to 20 mm plate showing complete and partial penetrations(Serial AP_20).
The interaction between the target rear surface and the projectile lowers the resisting stress on the projectile as it approaches the rear surface of the target.It can also induce failure mechanisms at the back of the target, such as scabbing or spalling, further reducing resistance. This means that the thickness required to prevent the perforation of a given projectile should be larger than the corresponding depth of penetration in a semi-infinite target(e.g., Ref. [31]). Somewhat surprisingly, the thickness to prevent perforation is about 22 mm,and the mean depth of penetration in a semi-infinite target is not lower than 22 mm, but also approximately 22 mm.The hardness of the plates is similar so this is not the reason for the surprising results. A possible reason is that the impact velocities of the thickest plates AP_28 and AP_32 are slightly higher than the plate thickness to prevent perforation(AP_25).It could also be that our estimate of a 22 mm plate to give 0% perforation may be incorrect, and a higher thickness in the region of 23-25 mm is more realistic. Nonetheless, this is an area for further study.
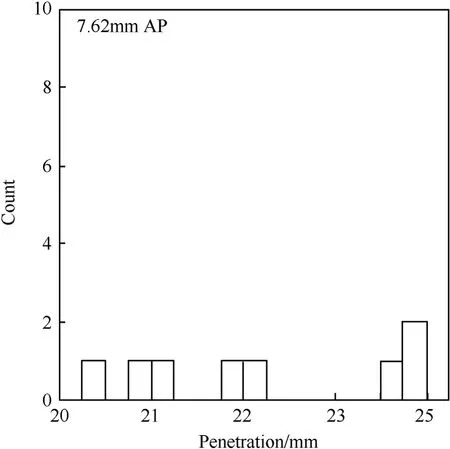
Fig. 7. Measured penetration depths.

Table 5 Statistical parameters for steel penetration from ballistic tests,for test serial AP_32.
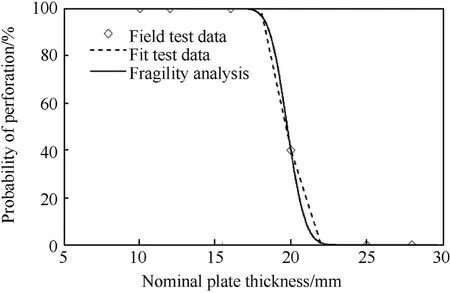
Fig. 8. Measured (test) probabilities of perforation, and comparison with results from fragility analysis.
4. Comparison of test results with predictive models
4.1. Ballistic penetration into semi-infinite plates
A number of empirical and analytical penetration models are available(e.g.,Refs.[25-27]).However,some are not applicable to the characteristics of this ballistic test.For example,some analytical models require material properties and constants that are difficult to measure or infer (e.g., Refs. [28,29]). However, some analytical models exist that calculate the penetration of a perfectly rigid(i.e.,armour piercing) projectile into a target of semi-infinite thickness[22,30,31]. Design guidelines from the US Department of Defense[3,32] and NATO[33] provide empirical equations or design tables for the perforation of steel plates which is often of most relevance to protective design. However, no guidance is given for depth of penetration. Numerical methods using Finite Element Analysis(e.g., Ref. [34]) are now routinely used to predict the penetration ability of projectiles.
Depth of penetration models developed by Recht [22], Yarin et al. [30] and Rosenberg and Deckel [31] are compared with experimental results for 7.62×51 mm AP ammunition. The penetrating ability of an armour piercing projectile is governed mostly by the kinetic energy of the bullet’s hard steel core (e.g.Refs. [13,20,31,35]). For example, Senthil et al. [12] ignored the jacket and lead cap when modelling the penetration of 7.62×51 mm AP M61 ammunition into mild steel plates. Table 1 shows the properties of the hard steel core used in the analyses to follow. Impact velocity is taken as 775.1 m/s (see Table 3).
4.1.1. Yarin et al. [30]
Yarin et al. [30] have developed a penetration model of a rigid projectile into a semi-infinite elastic-plastic target. A blunt projectile shape in the shape of a Rankine ovoid(hemispherical nose)was used with=0.86. However, Yarin et al. [30] show that their model also closely matches experimental data obtained from ogive projectiles typical of AP cores.A simplified approximate solution for penetration depth p (m) is

where m is the projectile mass (kg), ρ is the density of the target material (7850 kg/m3), r is radius of the projectile (m), Y is the dynamic yield stress(MPa)(also referred to as a flow stress[20]),G is the shear modulus of the target(80000 MPa),and v is the impact velocity (m/s). Recht [36] suggests that Y=3.92×BHN (MPa). The hardness of the plate is 152 BHN (see Section 2.2).
Table 6 shows that Eq. (1) predicts a penetration depth of 12.8 mm. This is substantially less than that measured from field trials(22 mm).The lower predicted penetration may be due to the AP ammunition being ogive-nosed with a higher=1.39 leading to higher penetrating ability.
4.1.2. Recht [22]
Recht [22] has developed an analytical model for the penetration of rigid ogive projectiles into a semi-infinite plate.This leads to penetration depth p (m) as:

where

where m is in kg,D is projectile diameter(m),v is in m/s,Cn=0.62 for ogive projectiles,Cv=0.25,α is the half-angle equal to 23.5°for ogive projectiles,K is the bulk modulus equal to Fy/(3(1-2ν)),E is the Young’s modulus of the target material, Fyis the static yield strength of the target material, ν is Poisson’s ratio (=0.3), τsis the static shear strength equal to 0.6Fy, f is the dynamic friction coefficient equal to 0.01 for metal on metal, and ρ is 7850 kg/m3. This model is also conveniently summarised by Hazell [20].
The analysis herein assumes that static yield strength is Fy=355×106N/m2for the plates used to measure penetrations(i.e., specimens AP_28 and AP_32), Young’s Modulus is 2×10¹¹N/m2,and static shear strength is 210×106N/m2.It is observed from Table 6 that the predicted penetration depth of 19.0 mm is 14%less than the mean measured value.
It is interesting to note that a design chart provided by the Australian Army for predicting the penetration of munitions into steel plates uses the Recht equation. The design chart for a mild steel target with BHN=150 shows a penetration depth of 20.7 mm[37].This also shows the Recht equation to be a very good predictor of penetration depth.
4.1.3. Rosenberg and Deckel [31]
The penetration of short projectiles is affected by the entrance phase as these projectiles are not expected to experience a constant deceleration during penetration.An empirical model derived from numerical simulations for penetration suitable for small calibre ogive-nosed rigid projectiles with L/D=3 is [31]:

where

where I is the impact factor and target resistance Rtis

where ρpis the density of the projectile in g/cm3, v is in km/s,effective length Leffis in mm and equal to m/ρpπr2, r is projectile radius(mm),D is in mm,Rtis in GPa,Y=3.92×BHN(MPa),and p is in mm.The density of the AP projectile is ρp=7850 kg/m3[34],and L/D=4.7 and Leff/D=2.7[12].Table 6 shows that the Rosenberg and Deckel [31] model overpredicts the mean measured penetration depth by 2%. This is an excellent agreement, and a low level of conservatism is to be expected from a design model. The goodagreements with the Recht [22] and Rosenberg and Deckel [31]models also suggests that the copper jacket may not contribute significantly to the penetrating ability of AP ammunition as suggested by Refs. [13,20,31,35].

Table 6 Comparison of ballistic penetration test results with model predictions.
4.2. Ballistic perforation
Two predictive models are assessed for perforation of steel plates from armour piercing projectiles.
4.2.1. UFC 4-023-07 [3]
The US Department of Defense Design to Resist Direct Fire Weapons Effects [3] provide an empirical equation for the perforation of steel plates by AP projectiles. In this case, the steel thickness required to prevent projectile perforation Ts(in mm) is

where v is the ballistic limit velocity(i.e.,impact velocity)in m/s,D is projectile diameter in mm, θ is the angle of obliquity (= 0 rad),and m is the mass of the projectile (kg). This equation is a manipulation of the expression for ballistic limit velocity given in UFC 3-340-01 [32] where Eq. (6) is the thickness necessary to stop complete perforation such that the projectile passes completely through the plate emerging with zero velocity. In other words, if the plate thickness is less than Tsthe bullet will pass through the plate with a residual velocity.
It is important to note that UFC 4-023-07 [3] specifies that projectile mass and diameter be taken from Appendix A of that document.In this,Appendix A refers to weight and diameter of the bullet (not the core), leading to m=9.59 g and D=7.82 mm (see Table 1).
Eq. (6) is based on the ballistic limit velocity defined as the velocity at which the projectile has a 50%chance of just perforating the target. Hence it is appropriate to compare the predicted thickness given by Eq. (6) with the test results where plate thickness resulted in a 50%chance of perforation.The same principle applies to the Rosenberg and Dekel [27] model described below.
Fig. 8 shows that 50% perforation of the plate to 7.62×51 mm AP ammunition occurs somewhere between a plate thickness of 19-20 mm. Table 7 shows that the UFC 4-023-07 [3] predicts a plate thickness of only 12.1 mm necessary to stop plate perforation.If properties of the steel core are used in Eq.(6),the minimum plate thickness reduces to 8.3 mm.This is a non-conservative design.This is unexpected, as design models tend to be deliberately conservative for design situations.
4.2.2. Rosenberg and Dekel [27]
Rosenberg and Dekel [27] have developed a model for the perforation of ductile plates for conical or ogive nosed rigid projectiles. The thickness of a plate to necessary to stop complete perforation such that the projectile passes completely through the plate emerging with zero velocity is

where ρpis the density of the projectile(g/cm2),Leffis the effective length of the projectile(in mm),r is in mm,v is km/s,and σris the effective stress(GPa) given as a function of plate thickness:

where Ytis the target flow stress (GPa). The target flow stress is defined as the average value of the dynamic strength at large strains,and is also referred to as the dynamic yield strength[20,38].As such,it is a difficult parameter to measure;for example,“One of the most common properties of many metals and alloys is their propensity to strain harden at large strains.Thus,it is quite difficult to determine their average flow stress (Yt)” [27]. For example, for“mild steel”Ytcan vary from 563 MPa to 975 MPa and these values depend on the ratio of plate thickness to projectile diameter [27].Nonetheless, if strain hardening is not significant a reasonable estimate of Ytcan be obtained. Recht [36] suggests that Yt=3.92×BHN(MPa).Nonetheless,a more accurate estimate of Ytthat fully considers high strain rates and material properties may be needed for improved predictive modelling.
Table 1 shows the properties of the hard steel core used in the analysis.The Rosenberg and Dekel[27]model predicts a thickness to prevent perforation of 21.5 mm, see Table 7. This is about 10%higher than the measured values. This is a conservative model because the predicted protection thickness is higher than that observed from ballistic field tests.This is an acceptable feature for a model where some margin of safety is allowed for.
5. Perforation fragility assessment for 7.62 mm AP ammunition
It is of interest to develop fragility curves that describes the probability of perforation for 7.62×51 mm AP M61 ammunition for realistic field conditions as a function of impact velocity. The Rosenberg and Dekel [27] model is selected as the “best estimate”model of perforation.It may well be that another perforation model is viewed as more accurate than the Rosenberg and Dekel [27]model.However,the purpose of the present paper is not to identify the “best” model, but to show how a fragility analysis can be conducted and how its results can inform risk-based decision making.Moreover,a probabilistic analysis enables“what if”scenarios to be simulated without the need for costly experimental testing - e.g.,what is the plate thickness with 95%reliability if BHN is known to within ±5% or impact velocity is only known to±20%, and so on.
The scenarios to follow assume that the force protection is at the design phase where all that is known,for example,is that mild steel plates are readily available for quick deployment.The exact BHN is unknown at this stage as the steel plates have yet to be delivered,and measuring BHN in the field may be difficult. In such cases the uncertainty and variability of BHN may be quite high. This design scenario is known as an “a priori” analysis associated with reliability-based design,and forms the basis of design standards for buildings in the United States, Canada, Europe, Australia andelsewhere [39]. On the other hand, if assessing the fragility of an existing protective structure it may be possible update our knowledge by accurately measuring BHN, plate thickness, etc leading to lower parameter variabilities.
There are three sources of variability and uncertainty associated when probabilistically modelling the performance of any system or component be it bridge resistance,loads on a building,or any other model used to estimate demand or capacity (e.g., Ref. [39]):
1. Predictive model-i.e.,model error defined as the ratio of actual(test) value divided by predicted (model) value,
2. Input parameters used in the model(e.g.,impact velocity,plate thickness), and
3. Inherent-or aleatory-variability,which relates to the natural(intrinsic, irreducible or fundamental) random uncertainty of a situation.
The probability of perforation(P)(also referred to as perforation fragility) for plate thickness t is:

where t is plate thickness, Tsis calculated from Eq. (7), v is the impact velocity,and ME is the model error.Random variables in the probabilistic analysis are plate thickness,impact velocity,projectile mass,Brinell hardness,and model error.The density and diameter of the hardened steel core are treated as deterministic as it is assumed that military munitions are manufactured to strict tolerances(i.e.,very low variability).Monte-Carlo simulation analysis is used to propagate uncertainty modelling through the analyses.The fragility curves are derived from 50000 simulation runs.
Model error(or model uncertainty)is defined as the test result divided by the model prediction. In this case, test result is 19-20 mm and model prediction is 21.5 mm leading to a model error of approximately 0.88-0.93-a mean value of approximately 0.9 is selected. If it is assumed that the Rosenberg and Dekel [27]predictive model is reasonably accurate, to say ±10%, then if this represents 95% bounds of a normal distribution the COV of model error is 0.05.The COV of 0.05 also includes inherent variability such as wind direction, yawing, barrel length, etc. Table 3 showed that impact velocity for AP munitions varies by only ±2%, which is equivalent to COV=0.01. The COV of projectile mass is 0.003 (see Section 2.3.2). More research is needed to fully characterise these variables, however, the present paper provides a starting point for such an analysis.
Impact velocity may vary from 800 m/s to 850 m/s as recommended by UFC 4-023-07[3]for protective design for threats from 7.62×51 mm AP M61 rounds. However, these are conservative estimates used for protective design. Table 3 showed that the impact velocity 50 m from the weapon is 775 m/s,hence,fragilities will also be estimated for impact velocities starting from 700 m/s.
5.1. Grade 250 steel
UFC 4-023-07 [3] specifies the BHN for Grade 250 mild steel is 110-160. In Australia, the “typical” hardness for Grade 250 mild steel is 120-160 BHN [40]. Hence, to be slightly conservative, the hardness of mild steel is modelled as a uniform distribution bounded by BHN=110-160.
The thickness tolerances for Australian mild steels are given by Australian Standards AS/NZS 1365 [41] is ±2-6% depending on plate thickness. If these tolerances represents 95% bounds of a normal distribution the COV of plate thickness varies from 0.01 to 0.03.Table 8 shows the statistical parameters as a function of plate thickness, as well as for all other variables.
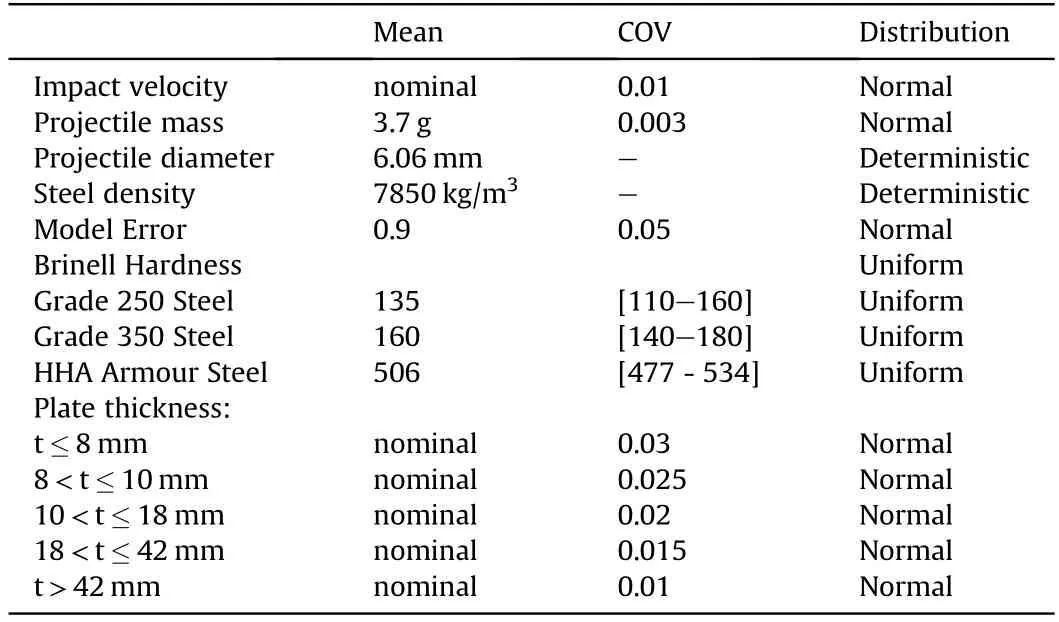
Table 8 Statistical Parameters for 7.62×51 mm AP, for realistic field conditions.
Fig. 9 shows the fragility curves for Grade 250 steel, for impact velocities of 700 m/s to 850 m/s. As expected, the probability of perforation increases as impact velocity increases. If the impact velocity is taken as 800 m/s, then Fig.9 shows that the probability of perforation is 100%for plate thickness less than 17.5 mm,50%for a plate thickness of 22.8 mm,and 0%when plate thickness exceeds 29.0 mm. Hence, the plate thickness to ensure a 0% probability of perforation needs to be about 30% thicker than required to have a 50/50 chance of perforation.To be 95%certain that a 7.62×51 mm AP round will not penetrate a Grade 250 steel plate with an impact velocity of 800 m/s requires a plate thickness of 26.9 mm.Or,if the plate thickness is only 19.7 mm the likelihood that a 7.62×51 mm AP round will penetrate that thickness is a high 95% (i.e., Pr(perforation)=95%).Hence,for design purposes a risk-averse decisionmaker may prefer only a 5%chance of perforation,hence the design protective thickness would be 26.9 mm if expected impact velocity is 800 m/s. If the impact velocity is 775 m/s, the design protective thickness with a 5% chance of perforation reduces to 25.5 mm,which reduces again to 24.2 mm for an impact velocity of 750 m/s.However, if the impact velocity selected by the decision-maker is already a conservative estimate (such as muzzle velocity), then selecting a low percentage of plate perforation may lead to overly conservative outcomes. Ultimately, the degree of risk acceptance(or aversion) as measured by Pr (perforation) is a matter for the decision-maker.
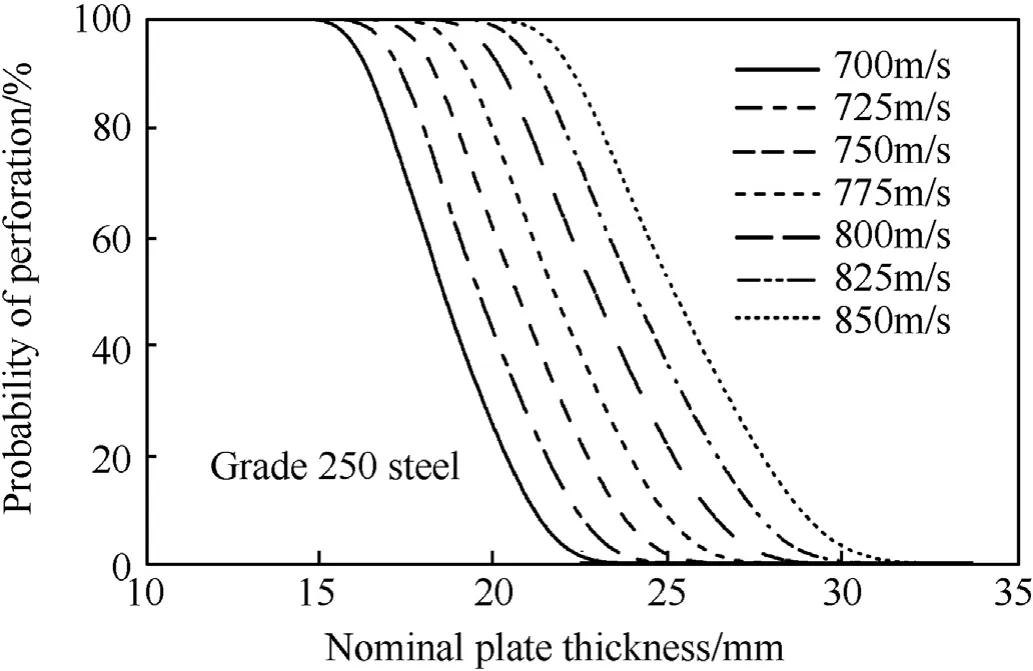
Fig. 9. Perforation fragilities for grade 250 steel plates.
A measure of dispersion(or variability)may be calculated by the difference between plate thicknesses with 5% and 95% chances of exceedance and the mean(50%)result.In this case,the measure of dispersion is ±15% for all impact velocities. If the model error is taken as mean(ME)=1.0 with the same COV(ME)=0.05, the fragility curves move to the right by approximately 10%.This results in a higher protection thickness.
5.2. Grade 350 steel
As discussed in Section 2.2 the hardness of higher strength Grade 350 mild steel can vary from 140 to 180 BHN. Hence, this is modelled as a uniform distribution bounded by BHN=140-180.The fragility curves are shown in Fig. 10 for Grade 350 steel. The thickness required to provide ballistic protection from perforation reduces by about 4 mm when compared with Grade 250 steel. For example, if the impact velocity is 800 m/s, the design protective thickness with a 5%chance of perforation reduces from 26.9 mm for Grade 250 steel to 22.5 mm for higher strength Grade 350 steel.The measure of dispersion reduces to approximately±11%for all impact velocities, most likely due to the lower variability of hardness for higher grade steel (i.e., difference between maximum and minimum hardness is 29% for Grade 350 steel, but 36% for Grade 250 steel).
It is of interest to see how the fragility analysis compares with the fragility curve obtained from the ballistic field trials(Fig.8). In this case, BHN from the field trials is modelled as a uniform distribution between 147 and 157 BHN (i.e., mean=152 BHN where measurements varied by ±5 BHN - see Section 2.2). Perforation occurred for plate thicknesses of 18 mm-22 mm,so plate thickness COV is 0.015(see Table 8).Mean impact velocity is taken as 775.1 m/s with COV of 0.01(see Table 3).The statistical parameters for other variables are taken from Table 8. Fig. 8 shows that the fragility analysis provides a reasonable fit to the test data.
5.3. HHA armour steel
According to U.S.Military Specification MIL-A-46100E[42],High Hardness Armour (HHA) steel plate has a hardness range of 477-534 BHN. MIL-A-46100E specifies plate thickness tolerance that are similar to AS/NZS 1365 [41] - i.e., ±2-6%. In the fragility analysis to follow, tolerances for plate thickness are taken from MIL-A-46100E [42] and AS/NZS 1365 [40], see Table 8.
Fig. 11 shows the fragility curves for HHA armour plate. Not surprisingly, protection thicknesses are much lower for this high hardness steel. For example, if the impact velocity is 800 m/s, the design protective thickness with a 5%chance of perforation reduces from 22.5 mm for Grade 350 steel to 9.0 mm for HHA armour plate.The measure of dispersion reduces to approximately ±8% for all impact velocities. This is due to the lower relative variability of hardness for HHA armour steel as the difference between maximum and minimum hardness is reduced to 12%.
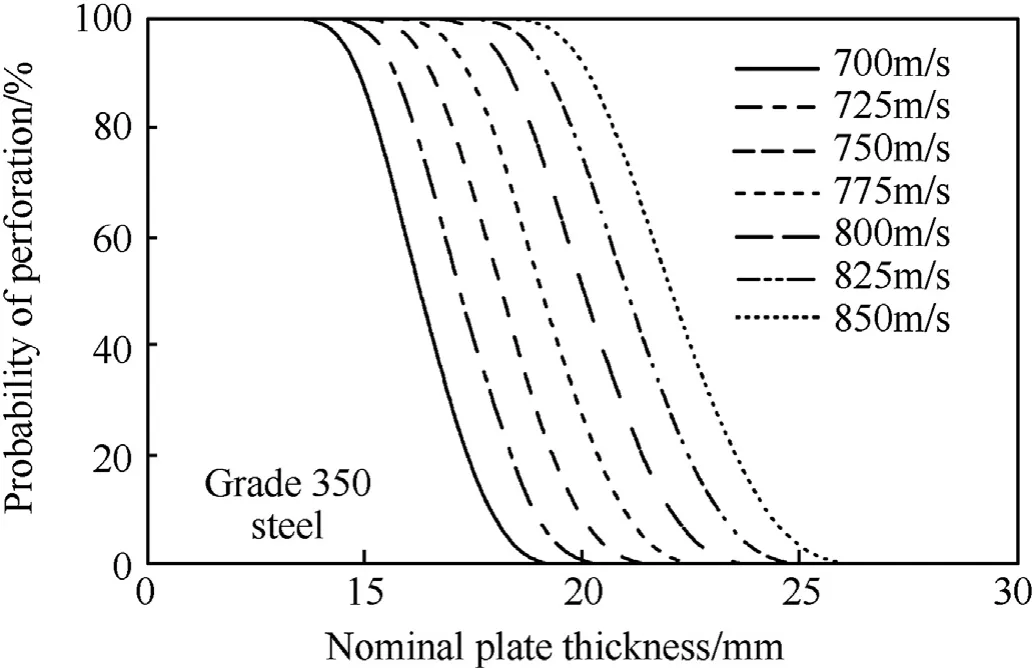
Fig.10. Perforation fragilities for grade 350 steel plates.
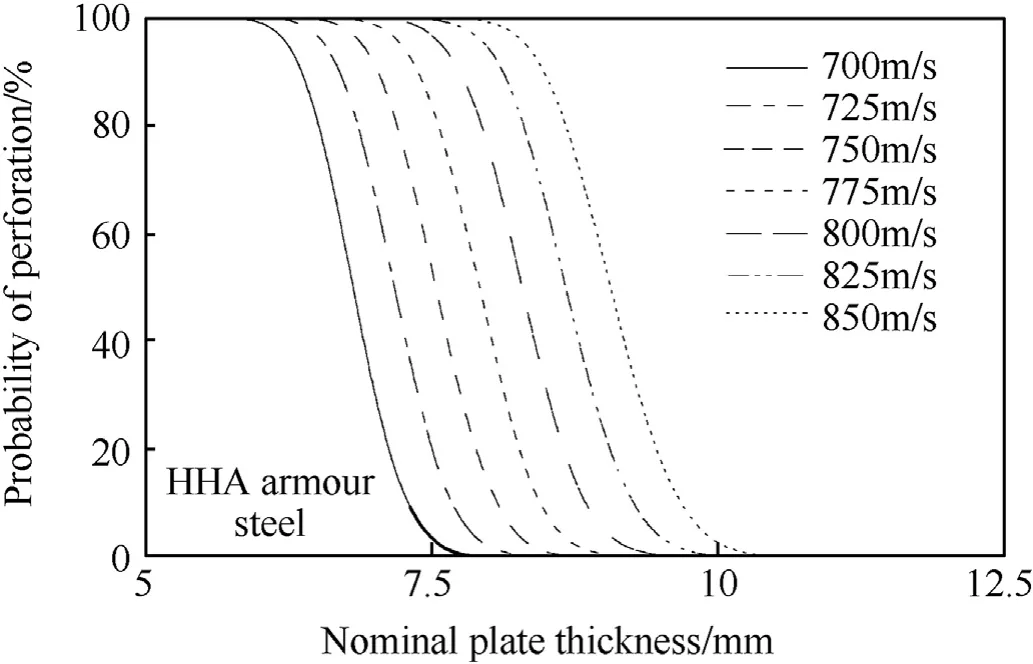
Fig.11. Perforation fragilities for HHA armour plates.
5.4. Sensitivity analysis
A sensitivity study is carried out to assess the relative impact of the variability and uncertainty of the model parameters on perforation fragilities. This was achieved by running the Monte-Carlo simulation analysis with each parameter in turn modelled deterministically, while all other parameters given in Table 8 are modelled probabilistically. The sensitivity study results are shown in Table 9,for Grade 350 steel plates with 775 m/s impact velocity.For ease of interpretation the results are presented in terms of the percentage change in plate thickness to ensure 5% and 95% probabilities of perforation - e.g., a higher value indicates a high sensitivity for that parameter. The relative sensitivities shown in Table 9 are similar for Grade 250 steel and HHA armour plates,and for other impact velocities.
It is observed from Table 9 that fragilities are most sensitive to variability of plate hardness and model error.This is to be expected,as these variables have the highest variability. Results are less sensitive to variability of plate thickness, and insensitive to observed variability of impact velocity and projectile mass. The sensitivity analysis provides a guide as to the parameters that need accurate stochastic characterisation,and those that do not.It is also recognised that a probabilistic analysis may require additional random variables to better capture observed variabilities.This may include pitch or yaw impact angle and target strain hardening and dynamic flow stress which have been shown to have a significant impact on penetrating ability(e.g.Refs.[19,20]),as well as climatic conditions, etc.

Table 9 Sensitivity Analysis for Grade 350 Steel and 775 m/s Impact Velocity.
6. Discussion
The perforation fragility curves derived herein may be viewed as preliminary.The intent is to show the probabilistic method and the data requirements.Fragilities are sensitive to model error.There is clearly a need for the collection of more perforation data and the probabilistic characterisation of model error. The Rosenberg and Dekel[27]model was selected for fragility assessment as it seemed to provide a good fit to our data and relatively easily to implement within a Monte-Carlo framework. However, the probabilistic method can be applied to other predictive models if model error is known. It can also be applied to FEA models as stochastic FEA analysis is a mature field of research and efficient Monte-Carlo methods can now be applied to computationally intensive numerical models.Perforation fragilities are also likely to be sensitive to plate hardness, pitch or yaw impact angle, and target dynamic flow stress. Improved characterisation of these variables both numerically and experimentally are needed to predict perforation fragilities with more confidence. Finally, uncertainties about protective design will be reduced if more information about variability of plate hardness,model error,impact velocity and other variables are known. This will lead to decision-making with increased confidence.
The ballistic field trials were conducted outdoors in realistic field conditions at a military range in an attempt to capture battlefield variability of penetration and perforation. This limited the scope of the field testing program when compared to standard controlled indoor laboratory ballistics testing where projectile velocities and plate thicknesses can be better controlled. These outdoor field trials provided a“proof-of-concept”that variability of key ballistic parameters can be collected,and they can be used to help develop a fragility analysis of ballistic perforation. Future field testing programs will consider a smaller difference in plate thickness for each test,yaw cards to measure yaw of each projectile,and more bullets fired at each plate. This will allow experimental and simulation fragilities to be compared and validated more comprehensively. Clearly, there is much scope for further research.
7. Conclusions
The paper describes ballistic field test results of 7.62×51 mm M61 AP(armour piercing)ammunition fired into mild steel targets at an outdoor range. The targets varied from 10 mm to 32 mm in thickness. The tests recorded penetration depth, probability of perforation, muzzle and impact velocities, bullet mass, and plate yield strength and hardness. Ten shots were fired into each plate.The variability of steel penetration is approximately ±12%. The paper then compared ballistic test results with predictive models of steel penetration depth and thickness to prevent perforation. A Monte-Carlo perforation fragility analysis then allowed the probability of plate perforation of 7.62 mm M61 AP ammunition to be estimated for a range of impact velocities, and for mild steels, and HHA armour plates.It was found that the plate thickness to ensure a low 5%probability of perforation needs to be up to 11-15%thicker than required to have a 50/50 chance of perforation for mild steel plates. Plates would need to be 20-30% thicker if probability of perforation is reduced to zero.
Acknowledgements
The authors appreciate the laboratory assistance of Goran Simundic and Michael Goodwin for assistance with measurement of the field test results The assistance of final year honours student Richard Szlicht is gratefully acknowledged.
杂志排行
Defence Technology的其它文章
- Texture evaluation in AZ31/AZ31 multilayer and AZ31/AA5068 laminar composite during accumulative roll bonding
- Local blast wave interaction with tire structure
- Research and development of training pistols for laser shooting simulation system
- Summed volume region selection based three-dimensional automatic target recognition for airborne LIDAR
- A novel noise reduction technique for underwater acoustic signals based on complete ensemble empirical mode decomposition with adaptive noise, minimum mean square variance criterion and least mean square adaptive filter
- Research on extraction and reproduction of deformation camouflage spot based on generative adversarial network model
