Biochar as Improver of Methane Production in Anaerobic Digestion of Food Waste
2020-06-22CiroFlorioPaolaGiudicianniDomenicoPirozziVincenzoPasqualeRaffaeleRagucciStefanoDumontet
Ciro Florio,Paola Giudicianni,Domenico Pirozzi,Vincenzo Pasquale,Raffaele Ragucci,Stefano Dumontet
1 University of Naples“Parthenope”,Department of Science and Technology(DiST),Centro Direzionale di Napoli,ISOLA C4,80143,Naples(Italy)
2 University of Naples“Federico II”,Department of Chemical Engineering,Materials and Industrial Production(DICMaPI),Piazzale Tecchio,80,80125,Naples(Italy)
3 Consiglio Nazionale delle Ricerche,Istituto di Ricerche sulla Combustione,Piazzale Tecchio,80,80125,Naples(Italy)
Keywords Anaerobic digestion Biogas Biochar Biomethane Food waste
Abstract Anaerobic digestion of food waste is aimed both at the reduction of the volume of waste and the production of methane. Carbonaceous additives such as activated carbons were widely studied as enhancer of methane production. In this paper a low-cost alternative additive,the biochar,was proposed to assess its use for improving both the operational stability and the energetic output of anaerobic digestion. The main objective of the present work is to assess and quantify the increase of CH4 yields induced by the biochar addition and to identify all the main mechanisms responsible of this improvement. The risk related to the Polycyclic Aromatic Hydrocarbons release from biochar in the anaerobic digestion media was discussed as well.To this aim,biochar obtained from steam assisted slow pyrolysis of Populus nigra L.up to 600◦C was used.Anaerobic digestion of food waste mixture was carried out in a batch reactor in mesophilic conditions(37◦C).Four tests were conducted by adding 0,1,4 and 10 wt%of biochar on wet food waste mixture basis. Results showed that more CH4 is produced even in the first hours of the anaerobic digestion test when 10 wt% of biochar was added to the food waste mixture(about 65 wt%more at 96 h),thus denoting a reduction of the lag phase.A total increase of CH4 yield of 14 and 42%when 4 and 10 wt%of biochar was added to the food waste mixture.In conclusion,analyses of both the liquid phase during the tests and biochar sampled at the end of anaerobic digestion process revealed that biochar favored the decomposition of acetic acid, adsorbed some inhibitors such as butyric acid,and provided a suitable habitat for microbial colonization.
1 Introduction
The increasing worldwide production of Municipal Solid Waste(MSW)impels for a management strategy different from landfilling. In 2015,the production of MSW in the European Union accounted for 476 kg/inhabitant(ISPRA,2015),a quantity calling for the implementation of sustainable processes and technologies able to convert waste into resources. As reported by Chalmin and Gaillochet(2009),the MSW are made,from 20 to 80%,of organic waste. The organic content of MSW largely depends from factors as the rate of urbanization and the economic development of the communities producing them. An effective collection and sorting of waste organic fraction allows for using this material as feedstock for anaerobic digestion, a process enabling both a significant reduction of the waste volume and, at the same time, the production of a combustible biogas. As it is well-known,during anaerobic digestion(AD)the organic matter is biodegraded by different microorganisms in four main steps: hydrolysis,acidogenesis,acetogenesis and finally methanogenesis. The gaseous degradation product is a mixture containing mainly CH4and CO2with a low calorific value (in the range 13-25 MJ/Nm3),which largely depends on its CH4content. Biological transformation routes of methane into liquid fuels such as methanol are being recently explored(Patel et al.,2017)as well. Biogas from AD typically contains 40-80%of CH4(Stewartet al., 1984). Substrate quality, structural and operational characteristics of the AD plant, the speciographic spectrum and physiological status of the digesting microflora are the main parameters controlling the percentage of CH4in the produced biogas(Stewartet al.,1984). Normally,a mesophilic AD plant operating at 37◦C has a better overall performance than a thermophilic process operating at 50-55◦C(Komilis et al.,2017),because of the relatively higher operational costs associated with thermophilic conditions (Fagbohungbe et al.,2016). Due to the delicate equilibrium underpinning the ecology and physiology of anaerobic microflora(Chen et al.,2008)many parameters need to be carefully monitored during the bioconversion,such as pH,volatile fatty acids (VFAs)/total alkalinity ratio, alkalinity, C/N ratio (Fagbohungbe et al., 2017; Sepehri and Sarrafzadeh,2018). Substrate-induced inhibition may occur when toxic compounds present in the feedstock (pesticides, antibiotics, heavy metals and persistent organic pollutants) or microbial metabolic intermediate products (long chain fatty acid, ammonia and ammonium) cause a detrimental shift in the microbial speciography or inhibit microbial activity(Fagbohungbe et al.,2017).
Currently, many technical and scientific efforts are directed towards the stabilization and maximization of CH4yields during the process by using different kinds of mineral and carbonaceous additives (Masebinu et al., 2019) capable of reducing the inhibitors stress. Among the carbon-based additives, biochar from biomass pyrolysis represents a low-cost alternative to the use of other more expensive materials such as activated carbon.In the last decade biochar is attracting an increasing interest thanks to its chemical and physical characteristics that enable it to play an important role in the development of bio-based economy models. Its well-developed porous structure,the presence of a variety of functional groups on the internal surface,its pH and the electrically conductive capability (Lehmann and Joseph, 2009) could allow to several kinds of interactions with an AD system. Moreover, the high content of biochar plants macro-and micro-nutrients of the biochar could possibly enhance the fertilizing properties of the digestate(Lehmann and Joseph,2009),even though some concerns arise from the release into the soil of Polycyclic Aromatic Hydrocarbons (PAHs) and dioxins, possibly be present in the biochar (Hale et al., 2012). The morphological structure and the chemical composition of the biochar depend upon the starting biomass, as well as upon the pyrolysis conditions in terms of pyrolysis technology and operating variables to which the biomass is exposed (Di Blasi et al., 2009). The pyrolysis temperature followed by the heating rate and the pressure are expected to be the most important factors influencing the resultant physical and chemical characteristics of biochar of any given biomass feedstock (Antal et al., 2003).This implies that one can modulate the biochar characteristics by a proper tuning of the operating variables and of the starting biomass to find out the optimal ranges of the desired properties of the biochar.
Many authors (Masebinu et al., 2019) observed that in mesophilic AD of various substrates the addition of biochar obtained from different sources under different pyrolysis conditions increased CH4production rate,shortened the methanogenic lag phase, favored the growth of methanogens, enhanced the degradation rate of dissolved organics and of volatile fatty acids(VFA).
The comparison among the literature data appears very hard due to the different experimental conditions,substrates and biochars. However, the extensive literature survey provided by Masebinu et al. (2019) suggests that biochar acts as stabilizing agent in AD process through three main mechanisms: the sorption of inhibitors, the restoring of the buffering capacity of an AD system and the capability of immobilizing the bacterial cells. Biochar was observed to mitigate inhibition from N-based compounds (ammonia, nitrate, nitrite)(Shen et al., 2016). More specifically, Kizito and Wu (2016) found that biochar added to the digestate of pig manure adsorbed increasing amount of NH4at increasing values of temperature,pH and inhibitor concentration.Increasing biochar dosages as well as decreasing particle size increased the adsorption efficiency. However, in AD experiments using glucose as substrate, Lu et al. (2016) reported that a reduction in the particle size was less effective in reducing the duration of the lag phase with respect to AD experiments without biochar addition. They concluded that biochar alleviated the combined stress of ammonium and acids by enriching specific methanogenic bacteria. Biochar ability to adsorb NH3(Sharma and Melkania,2017)promoted the reduction of the lag phase of about 35%during the AD of sewage sludge,whereas the adsorption of limonene was supposed to be responsible of a decrease of about 49%of the lag phase and the increase of about 16%of CH4yield during AD of citrus peel(Fagbohungbe et al. 2016). Besides the capability of adsorbing inhibitors, biochar enhanced the buffering ability of the AD system. It caused an increase of the production and degradation rate of VFA with a congruent increase of pH during the AD process, thus resulting in a reduction of 41% of the methanogenic lag phase and an increase of 10%of CH4yield(Sunyoto et al.,2016)during AD of aqueous carbohydrates food waste. A similar effect was observed by Wang et al. (2018) resulting in an enhancement of CH4production rate in the range 22.4-40.3% during AD of food waste. It is worth to be noted that variations in the substrate dosage affected the performance of biochar in driving AD system pH to alkaline values(Luo et al.,2015). The peculiar morphologic structure of biochars was proven to favor the colonization of microbial cells and the formation of biofilms on its surfaces and internal pores. Biochar supported the growth Archaea (Mumme et al.,2014), microorganism of a domain including especially methane-producing forms,and favored the enrichment in colonies of putative methanogens(Fagbohungbe et al.,2016)and Methanosarcina(Shen et al.,2017). Despite the promising results, some authors reported that the addition of biochar above a specific value dependent on the AD system was less effective and, in some cases, even detrimental for the AD performances (Sharma and Melkania, 2017; Sunyoto et al., 2016). Meyer-Kohlstock et al. (2016) observed variations of CH4yield in the range of-8%to+31%after biochar addition to the substrate in lab-scale experimental trials. By simulating an industrial-scale biogas plant, they obtained only a slight volume increase (about 5%) of both biogas and CH4when 5 wt%(dry matter)of biochar was added to the feedstock. Cai et al. (2016)observed that the effectiveness of biochar addition depended on the additive amount of biochar and on the inoculum to substrate ratio (ISR).The higher the ISR the less effective was the addition of biochar and as the ISR decreases the biochar demand increases,thus suggesting the role of biochar in supporting the inoculum activity.
The analysis of the literature suggested that the variability of AD systems,substrates and biochar characteristics produced often very scattered results and, despite the fact that most of the experimental evidence proved the effectiveness of char in increasing the performances of the AD process,in some cases the addition of biochar had no effect or was counter-productive. A comprehensive approach is required to establish possible correlations between the chemical and physical characteristics of biochar and the effects that it has on the performance of an AD system. Moreover,its adsorption properties against other inhibitors such as phenols should be assessed.Finally, another aspect related to a safe application of biochar during AD should be taken into account as the presence and the leachability of some pollutants such as PAH is often debated in many biochar applications(Fabbri et al.;2013).
This study tries to give a first contribution to fill this gap. Differently from other papers on the same topic,biochar was extensively characterized thus allowing to consider at the same time a plethora of mechanisms responsible of biochar interactions with the AD system. A preliminary discussion was provided about the effect of specific biochar properties, thus paving the way for a further systematic approach aimed at the optimization of the biochar characteristics for a proper integration between pyrolysis and AD. To this aim, AD of a labmade mixture of food waste (FW) was carried out in a batch reactor operating under mesophilic conditions.Biochar was added to the feedstock in the bioreactor at different concentrations (from 0 to 10 wt% on wet feedstock basis). Biochar was obtained from Populus nigra L.lignocellulosic material through steam assistedslow pyrolysis at a final temperature of 600◦C (Giudicianni et al., 2017). Char characterization included pH,BET surface,ICP/MS,elemental and proximate analysis. Cumulative biogas and CH4volumes were monitored during incubation and final CH4yields were calculated. The results were discussed in relation to the measured concentration of reducing sugars,Volatile Fatty Acids(VAFs)and phenols in the liquid phase during incubation and related to some char’s properties (pH,BET surface and surface chemistry). The possible release of PAHs in the liquid phase was also assessed. Fourier Transform Infrared Spectroscopy (FTIR)and Scanning Electron Microscopy (SEM) analyses were performed on the biochar after the AD process to investigate chemical and structural modifications induced to the biochar during the process.

Table 1 Characterization of food waste(1)and inoculum.
2 Materials and methods
2.1 Materials preparation and characterization
Food leftovers were used to prepare a mixture of FW mimicking the organic fraction of urban MSW of a western city established on the basis of the results of interviews to local citizens. The mixture was made of 30 wt%of apple,5 wt%of cooked meat(bovine),30 wt%of large leafy vegetable,and 35 wt%of white bread(adapted from Florio et al., 2017). The ingredients were grossly chopped during preparation and the mixture was assembled and finely shredded with a domestic blender. Finally, the mixture was pressed manually in a mortar to make a puree before being inserted into the bioreactor.
An anaerobic digestate, taken from the lower part of an AD biodigester treating bovine manure, was used as starting inoculum. The inoculum was kept at 5◦C not later than 2 days. Before using the inoculum was maintained at room temperature for 1 hour.
Proximate analysis of the FW mixture and inoculum was performed using a TGA 701 LECO thermogravimetric analyzer,adapting ASTM E949 and 897 procedures.
FW mixture and inoculum characterization is reported in Table 1.
Biochars were produced from Populus nigra L.lignocellulosic material through steam assisted slow pyrolysis process (Giudicianni et al., 2017). About 6 g of biomass (sieved in the size range 400–600µm) were pre-dried at 105◦C for 2 hours to remove the residual moisture before the pyrolysis experiments. Then, the biomass sample was spread in thin layers (approximately 1 mm thick) over four trays and placed in a prismatic reactor for the pyrolysis experiments. Steam, heated at 5◦C/min, entered the reaction chamber at mass flow rate maintained at 0.25 g/s during the tests. Gaseous stream exited the reaction unit and was collected for off-line characterization. When the temperature in the reactor reached 600◦C,the seam flow was stopped and the reaction chamber was rapidly cooled down to room temperature by feeding a cold nitrogen flow. Char characterization was performed in Giudicianni et al. (2017) and reported in the Table 2 for the sake of clarity.Briefly,elemental and proximate analysis were conducted according to the ASTM D5373 and ASTM D1762-84 procedures. The surface area was evaluated using the BET equation applied to the sorption isotherm obtained using argon at 87 K as the adsorbate in an Autosorb-1(Quantachrome)apparatus. Char pH was measured with a digital pH meter (827 pH LAB,Metrohm) adopting the ASTM D4972-13 procedure. Finally, the content of major inorganic elements was determined by ICP/MS by dissolving the char sample via microwave-assisted acid digestion based on US-EPA Methods 3051 and 3052.
Biochar samples were extracted using the ultrasonic extraction procedure EPA 3550C,from biochar samples both before and after AD tests in order to investigate the possible release of PAHs in the liquid phase duringthe AD experiments. A mixture of acetone/hexane (1:1 vol/vol)was used as extraction solvent. The extract was separated from the sample by vacuum filtration and analyzed by GC/MS(Agilent 7890b/MSD 5975)equipped with a siloexane column HP-35MS.The oven temperature was programmed at 40◦C and held for 1 min,then it was raised to 300◦C at a heating rate of 15 K/min and held at 300◦C for 30 min. The identification of the peaks was based on computer matching of the mass spectra with the NIST and with the GC/MS software libraries.

Table 2 Populus nigra L.biochar characterization(Giudicianni et al.,2017).
2.2 Anaerobic digestion tests
In Four crimped Pyrex bottles with perforable butyl rubber septa were used as batch digesters. The reactors were loaded with 15g of FW,inoculated with 7.5 g of inoculum. Increasing amounts of biochar corresponding to 1,4 and 10 wt%(wet basis) of the FW sample were added in three reactors (test B1, B4 and B10, respectively).Then, distilled water was added to obtain volume of 100 mL. An experiment without biochar addition (FW)was used as reference. During incubation the pH was kept between 6 and 6.5 with Na2CO3(5%w/v),a range suitable for methanogenic activity. The amount of basic solution to be added in the reactor was estimated on the basis of a reference test tube containing 2mL of digesting medium. Dissolved oxygen was removed and anaerobic conditions were assured by purging the bioreactors with nitrogen for 10 min. Glass digesters was subsequently placed into a rotary incubator(150 rpm)at 37◦C(Al-Zuhairi et al.,2015)until biogas production was no longer observed. Gaseous samples and 2mL of liquid phase were collected and analyzed at selected time intervals during the process: 0,48,96,168,192,264,336,384 and 408h.
A 21 days AD test was performed using a standard substrate (glucose 5g/L)in the same experimental conditions above mentioned. Final yield obtained was 158 mLCH4/g glucose,a value that was used as reference.
At the end of each test,digested FW mixture,biochar and the liquid phase were separated by sedimentation and the biochar was collected, washed 3 times with deionized water and dried in a stove overnight at 60◦C before characterization.
As for the liquid phase,less than 10%of total digestate volume was collected out for analysis(Al-Zuhairi et al.,2019).
2.3 Analytical methods
pH of the liquid phase was measured using 740 pH meters(WTW,Weilheim,Germany)keeping the sample in steady agitation during the measurement.
The amount of reducing sugars during incubation was calculated using the modified Nelson-Somogy method(Nelson,1944;Pirozzi et al.,2013).
Total phenols were characterized using Folin-Ciocalteu reagent according to Box (Box, 1983), measuring the absorbance at 760 nm using the spectrophotometer UV-1700(Shimadzu).
The liquid samples were analyzed for VFAs(acetic,propionic and butyric acids)and ethanol concentration.After centrifugation (Hettich Universal 32R)at 9000 rpm (rcf 9050) for 5 minutes, the liquid phase was separated,filtered with 0.2µm cut-off filters,and analyzed using a Shimadzu Gas chromatograph C-17A equipped with a FID detector and a capillary column containing a PEG stationary phase(BP20 column,30 m by 0.32 mm i.d.,0.25mm film thickness,from SGE)(Ausiello et al.,2017).
Biogas volumes were collected and measured according to Al-Zuhairi et al. (2015). Briefly,each fermentation bioreactor was connected with a capillary tube to an upturned bottle(125 mL)entirely filled with distilled water,equipped on both ends with a needle. The biogas volume was determined measuring the water displaced in a graduated cylinder through a needle from the upturned glass bottle.
Biogas composition was determined by Gas chromatograph HP 5890 series II equipped with a TCD detector and a double packed molecular sieves-Porapack (Ausiello et al., 2017). Biogas volumes were normalized at standard conditions(25◦C,1 bar).
Scanning Electron Microscopy (SEM) analysis (Phenom ProX, Phenomworld) of biochar samples at the end of incubation was performed. Infrared spectra of the biochar samples, before and after the process, were recorded on a Nicolet iS10 spectrophotometer using the attenuated total reflectance (ATR) method. The ATR infrared spectra were recorded in the 500-3700 cm-1 range by using a zinc selenide crystal,collecting 32 scans,and correcting the background noise. The spectra were acquired and processed using OMINIC 8 software.
AD tests were performed in triplicate. Statistical analysis was carried out using Past software v3.22. The significant test was set at p<0.05.
3 Results and discussion
3.1 Biochar characterization
Results in Table 2 showed that biochar has a basic pH value and a high Brauner Emmett Teller (BET)surface that could be relevant in the interaction between biochar and the AD environment.
According to the literature volatile matter, O: Corg (Spokas, 2010) and/or H: Corg (Enders et al., 2012)ratios can be used to classify the biological stability in soil. A volatile matter above 80%(w/w biochar ash-free mass)may indicate biochars with no C sequestration value; a volatile matter below 80%(w/w biochar ash-free mass)and an O/Corg ratio above 0.2(Spokas,2010)or H/Corg above 0.4 may indicate moderate sequestration ability;a volatile matter below 80%(w/w biochar ash free mass)and an O/Corg ratio below 0.2 or H/Corg below 0.4 may indicate high recalcitrance. Based on the proposed classification,given the low values of O/C and H/C ratio and of volatiles content, the biochar used in this work had a high degree of aromaticity and maturation,corresponding to high recalcitrance to biotic decomposition (Spokas, 2010). The assumption is corroborated by the negligible weight loss observed during anaerobic digestion of biochar deriving from pyrolysis of paper sludge and wheat husks at 500◦C(Watanabe et al.,2013).
The concentration of 16 main PAHs (US EPA, 2002) in the biochar was below the detection limit of the instrument(500µg/g),in agreement with Fabbri et al.,(2013).
3.2 AD tests
The anaerobic incubation was stopped after 17 days,when the daily increase of biogas produced fell below 1%of the total volume at this time.
In Figure 1 the cumulative volumes of biogas produced with and without biochar addition are reported.Along the incubation,the production of biogas increased continuously with slight and not significant differences among treatments FW(control), B1(1 wt% of biochar) and B4 (4 wt%of biochar). On the contrary, the B10 treatment (10 wt% of biochar) produced at the end of incubation 513 ± 13 mL of biogas, 25% more than the control.
In Figure 2a,the CH4cumulative production during incubation is reported. The total CH4volume produced by the treatment B10(397±10mL)was significantly higher(42%)than that produced by the control(276±7 mL).
Figure 2b shows the CH4volume produced at each sampling time during the initial stage of AD tests. It is noteworthy that the CH4produced at each sampling increased with the addition of biochar to the digesting feedstock. A higher amount of CH4is produced even in the first hours of the AD test when 10 wt%of biochar was added to the FW mixture(about 65 wt%more at 96h),thus highlighting a reduction of the lag phase.
Table 3 shows the CH4content in the cumulative volume of biogas produced in the various treatments, its average daily production and yield. Results confirmed the enhancement of AD process performance induced by biochar addition. A total increase of CH4yield of 14 and 42%when 4 and 10 wt%of biochar was added to the FW mixture.
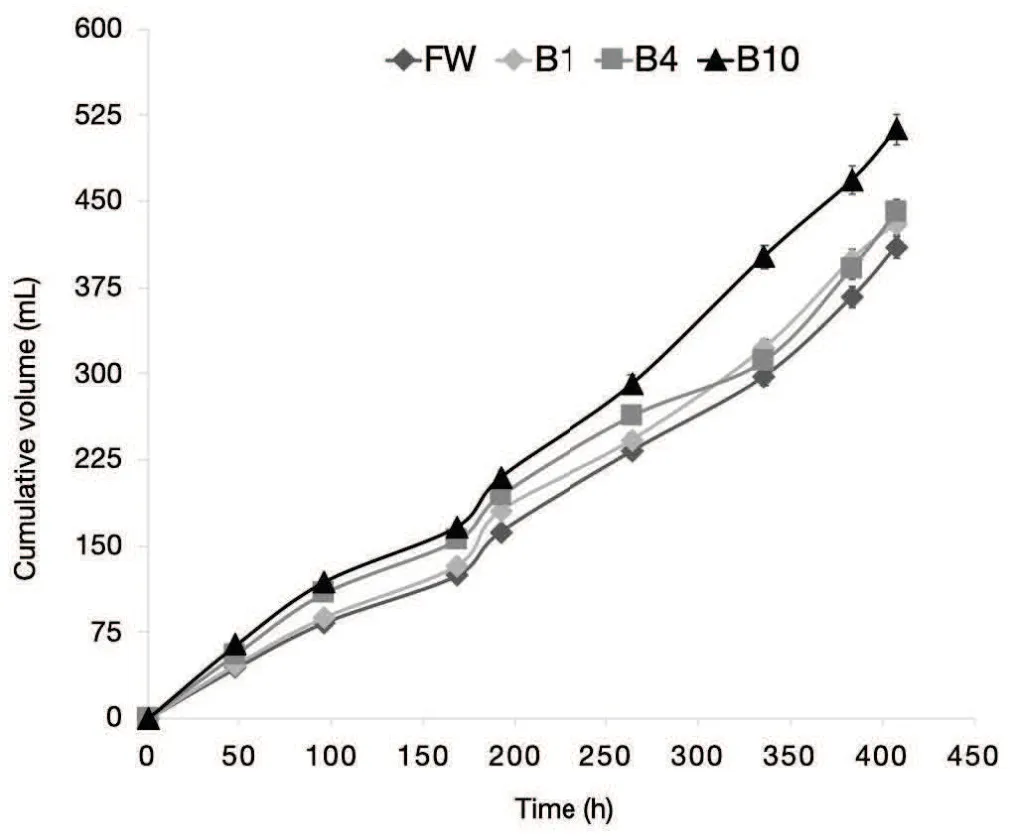
Fig.1 Biogas cumulative volume for AD batch experiments:FW(control),B1(1 wt%of biochar),B4(4 wt%of biochar),and B10(10 wt%of biochar).
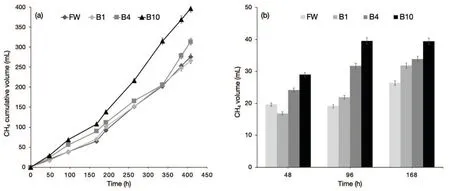
Fig.2 CH4 cumulative volume(a)and volume(b)produced during the lag phase for AD batch experiments:FW(control),B1(1 wt%of biochar),B4(4 wt%of biochar),and B10(10 wt%of biochar).

Table 3 CH4 content in the produced biogas,average daily production and yield for AD batch experiments:FW(control),B1(1 wt%of biochar),B4(4 wt%of biochar),and B10(10 wt%of biochar).
The effect of biochar addition on the degradation of the reducing sugar during the AD process for the control and the B10 treatment is reported in Figure 3.
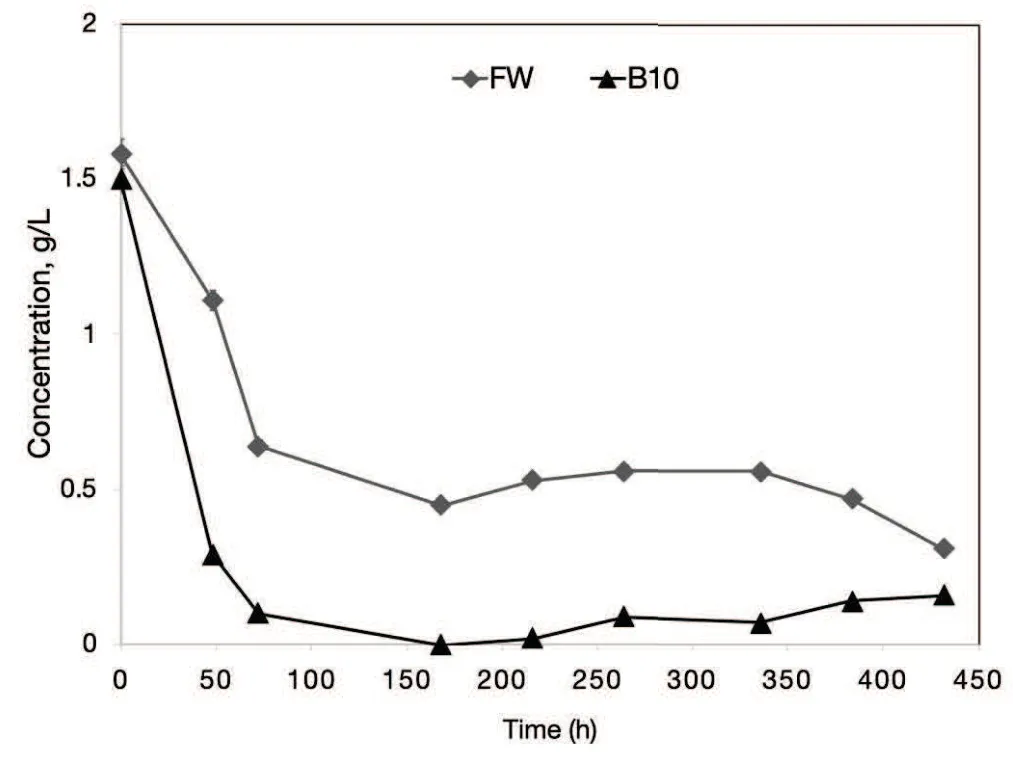
Fig.3 Reducing sugars concentration for AD tests in the control(FW)and treatment with 10 wt%of biochar added(B10).
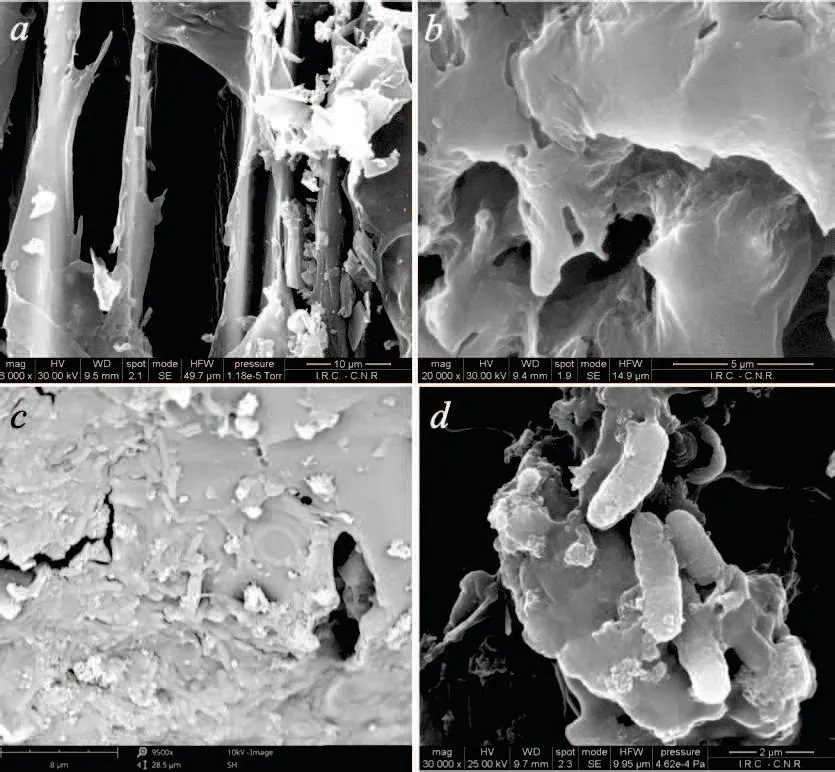
Fig.4 SEM micrographs of char before(a and b)and after(c and d)the treatment B10(10 wt%of biochar).
The reducing sugar concentration sharply decreased in the control reaching its lowest value at 168 h of incubation. From this point onward,the concentration of reducing sugars remained nearly constant up to the end of incubation. The treatment B10 behaved differently,as the decrease of reducing sugar concentration was more pronounced and reached an extremely low value at 168 h of incubation, remaining fairly constant up to the end of the incubation when it reached 0.31±0.01 g/L.In the first 48 hours of incubation the treatment B10 showed a decrease of reducing sugar concentration of 81%,whereas in the control this concentration decreased of about 30%.
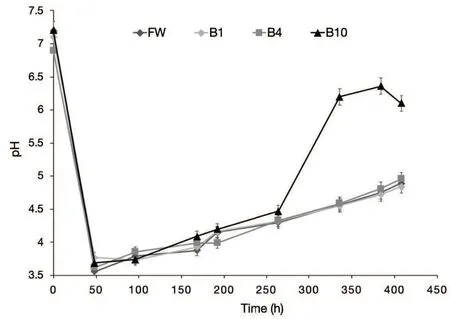
Fig.5 pH during AD batch experiments: FW(control),B1(1 wt%of biochar),B4(4 wt%of biochar),and B10(10 wt%of biochar).

Table 4 Concentration of ethanol and volatile fatty acids(VFAs) during incubation in the treatments FW (control),and B10(10 wt%of biochar).
SEM pictures a and b of Figure 4 show the uncolonized biochar, whereas pictures c and d showed the presence of microorganisms (cells of about 1µm thick and 2.5µm long) in biochar collected at the end of the AD process. It is reasonable to assume that the addition of biochar to the feedstock created a favorable habitat for microorganism involved in AD process, thanks to its porous structure and high specific surface. It is likely that biochar promotes direct interspecies electron transfer between fermenting bacteria and methanogenic ones.As already observed for AC, biochar due to its electrical properties (Giorcelli et al., 2019) can behave as an electrode that accepts electrons from anode-reducing microorganisms (secondary fermenting bacteria), and in turn, donates electrons to cathode-oxidizing microorganisms (methanogenic archaea), thus determining higher CH4 yield(Lee et al.,2016). Future investigations on the speciation of microorganisms colonizing the biochar would cast light on this mechanism.
Figure 5 shows the trend of feedstock pH in all treatments along the AD process. The pH values decreased sharply in all treatments in the first 48 hours of incubation from a mean value of 7.10 ±0.14 to a mean value of 3.67±0.10. All treatments behaved in a similar way up to 264 hours of incubation, when pH values raised up to 4.35±0.10. From this point onward,the treatment B10 raised sharply its pH keeping it 24.5%higher of the mean of all the other treatments at the end of incubation. Table 4 reports the concentration of acetic,butyric and propionic acid at selected times for the treatments FW and B10. In FW a strong acidogenic phase occurred in the first 48h of the process as confirmed by the increasing concentration of acetic and butyric acid, and pH decreased to acidic values.
Propionic acid was never detected during the AD process neither in the control nor in the B10 treatment. On the contrary, acetic acid concentration increased with time up to 264h,whereas a slight decrease of the butyric acid concentration was observed. It is likely that during this stage the rising of pH was due to the onset of proteins degradation leading to the production of basic compounds. Between 264- and 432-hours decreasing concentrations of acetic acid were observed in both the treatments. Respectively, a reduction of 87% and 71%was observed for B10 and FW.Being acetic acid is one of the main precursors of CH4,it seems that biochar is able to promote, through a mechanism that needs to be elucidated, its conversion to CH4,determining a lower acid concentration in B10 and a higher increase of CH4production rate after 264 hours (Figure 2a). It should be noted that butyric acid concentration was quite high throughout the tests, so that a possible inhibiting effect could be assumed on the bioconversion process (Schievano et al., 2010). However, butyric acid concentration was always lower in B10 then in FW. Semi-quantitative GC/MS analysis of the acetone/hexane extract from biochar added to the B10 treatment revealed,at the end of incubation,that butyric acid was present in significant amount (7.12% of the total chromatogram area). The adsorption of butyric acid on the biochar surface could mitigate its inhibitory effect on the AD process.
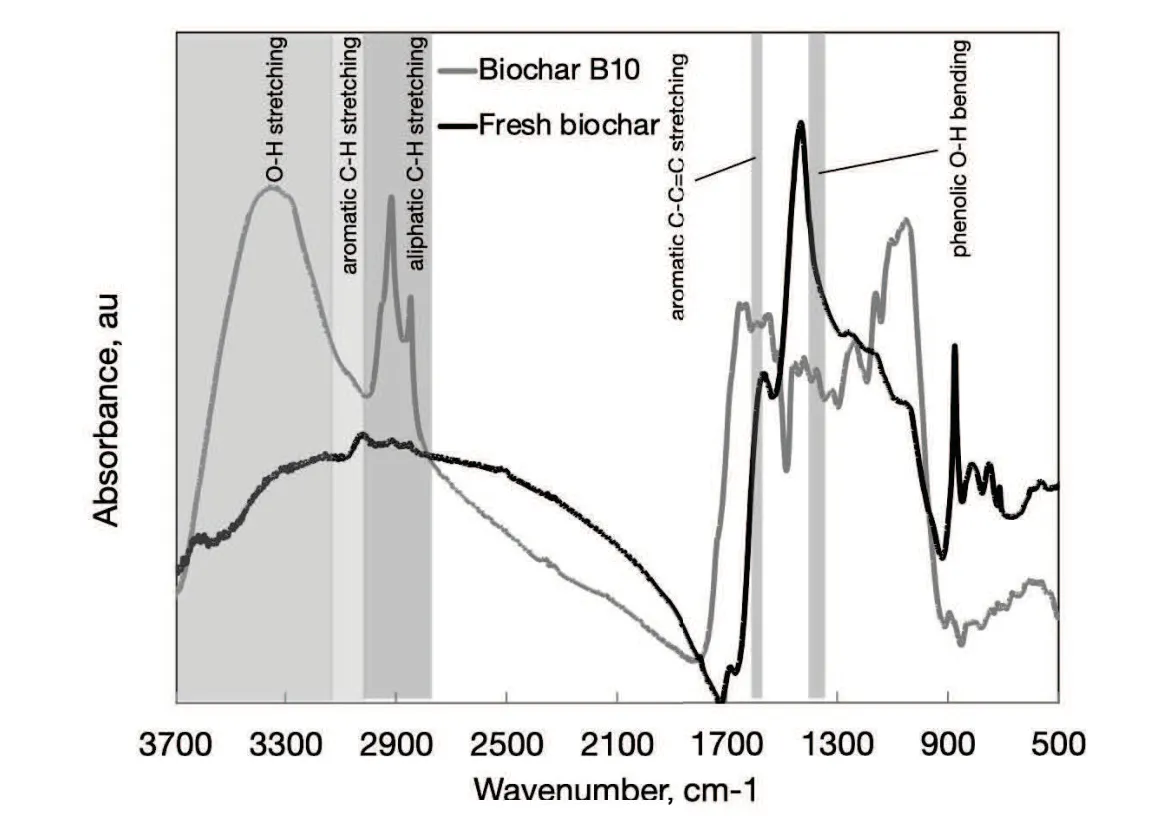
Fig.6 FTIR spectra in the range 500-3700 cm-1 of biochar before and after the treatment B10(10 wt%of biochar).
Finally,Table 4 shows that,in both FW and B10 treatments, the presence of ethanol was detected from the beginning of the incubation. In FW its value remained approximately constant up to 264 h and increased as the incubation goes by,thus indicating the onset of alcoholic fermentation pathways. On the contrary,in B10,after a slight increase from 0 to 72 h of incubation,ethanol concentration decreased up to the end of the test.
FTIR analysis of biochar samples before the addition to the feedstock and at the end of B10 treatment was performed and the resulting spectra are presented in Figure 6.
By comparing the two spectra in Figure 6 it is possible to observe that biochar retrieved at the end of B10 test showed a pronounced wide signal in the region between 3100 and 3700 cm-1,much less evident in the spectrum of the fresh biochar. This region corresponds to the stretching vibration of O-H bonds due to the hydroxyl groups in phenolic and aliphatic structures(alcohol,phenol,amine,amide,and carboxylic acid groups). A shoulder on this main peak could be detected between 3000 and 3100 cm-1representing the typical stretching vibration bands of aromatic C-H bonds, whereas two or more overlapped peaks in the region 2850-3000 cm-1denoted the stretching vibration of aliphatic C-H bonds. Very weak signals in the same regions were observed in the spectrum of fresh biochar. Finally, the peaks in the regions 1525-1600 cm-1and 1350-1400 cm-1could be indicative of aromatic C-C=C stretching and phenolic O-H bending, respectively. Even though FTIR analysis is not selective respect to the specific adsorbed compounds, these observations supported the hypothesis that biochar adsorbed both ethanol and probably phenols onto its surface. Even though the signals typical of C-H aromatic moieties appeared just as a weak shoulder on the wide peak in the region 3000-3100 cm-1,the tendency of biochar in adsorbing phenols is well documented in literature(Han et al.,2013).
Phenols are typically recognized as inhibitors of the methanogenesis. The inhibitory effect of phenol compounds is closely correlated to their apolarity characteristics. The lipophilic nature of these compounds seems responsible for their toxicity towards methanogenic bacteria (Olguin-Lora et al.,2003). Their concentration in the liquid phase during tests FW and B10 is showed in Figure 7.
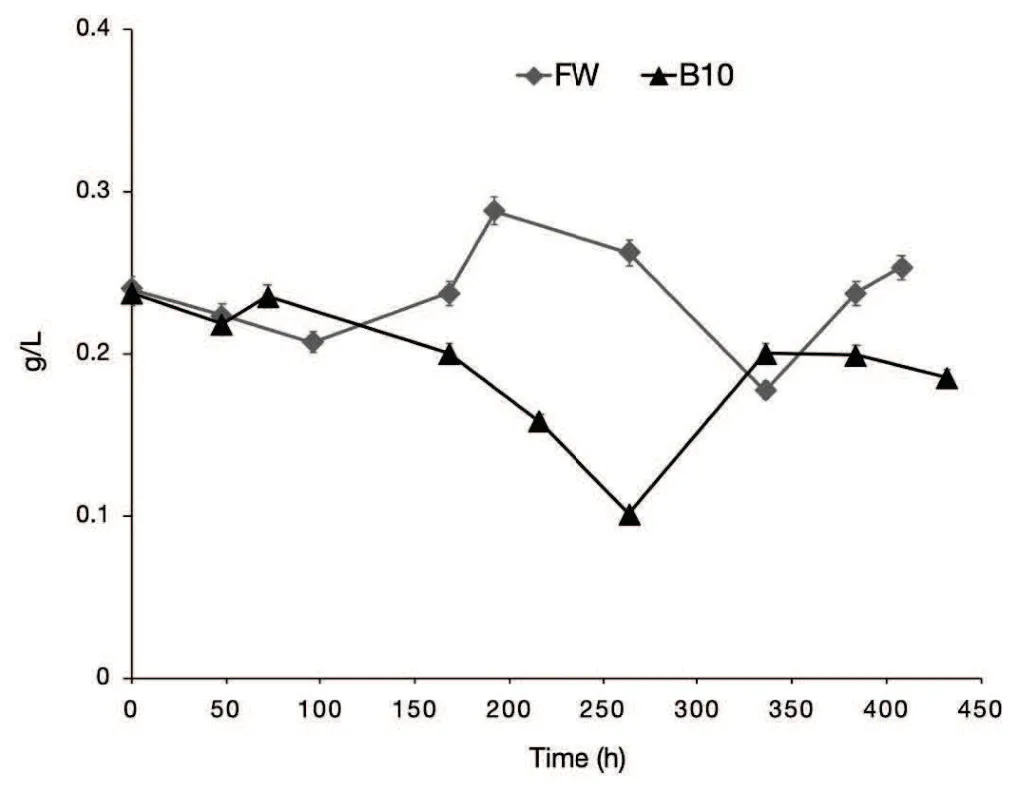
Fig.7 Phenols concentration for AD tests FW(control)and B10(10 wt%of biochar).
Even though in the first 168-hour phenols concentrations were comparable in both the tests, it is worth be noted that at higher incubation times the concentration was always lower in the test B10,in agreement with the FTIR results. During the test B10 a greater volume of CH4is produced, with respect to the control test, after 192 h. The CH4production rate in the test B10 remains higher than in the control test during the 192-336 h time range. The decrease of the phenols concentration in the test B10 in the same time range could be one of the reason of the observed difference. In this range the minimum phenols concentration in the test B10 is about half of the one in the test FW.This hypothesis is corroborated by the similar CH4production rates observed for the tests B10 and FW after 336 h when the phenols concentrations in the liquid phases of the two tests become comparable.
4 Conclusions
Biochar addition enhanced CH4yield and reduced the lag phase of its production. The increase became relevant when 10 wt%(25 wt%dw)of biochar was added to the FW.In this case CH4content in the produced biogas was 86±2.1%v/v,with a final yield of 84±2.1 mL/gVS and a daily production of 23±0.6 mL/day. The analysis of liquid phase and of the biochar morphology and chemistry after the biochar amended treatments suggested that biochar favored the conversion of acetic acid to CH4and adsorbed some inhibitors such as butyric acid and probably phenols,thus reducing their dispersion in the liquid phase,and provided a suitable habitat for microbial colonization. Future research will be required to use biochar with tailored physicochemical characteristics in order to meet the requirements of different biogas production processes.
Acknowledgements
The work was supported by the Accordo di Programma CNR-MSE 2013-2014 under the contract “Bioenergia Efficiente”. Authors thank Luca Micoli, Angelo Ausiello, Gaetano Zuccaro and Valentina Gargiulo for the technical support,and Claudio Ferone and Luciano Cortese for SEM analysis.
杂志排行
Journal of Environmental Accounting and Management的其它文章
- Do the Improved Water Sources for 203 Countries Converge over Time?
- Sustainability Evaluation of Sheep and Goat Rearing in Southern Italy. A Life Cycle Cost/Benefit Assessment
- The Prevalence of Students and Teachers’Ideas about Global Warming and the Use of Renewable Energy Technology
- Can Increase in the Share of Renewable Energy in Economic Growth Shift Turning Point of EKC?Evidence from Time-series Analysis in India
- Green Economy as a Paradigm of Sustainable Development of the Republic of Kazakhstan
- An Integrated Pollution Prevention Ecosystem for Small-Scale Production of Raw Coco-nut Jelly in Craft Villages
——A Case Study from Mekong Delta,Vietnam
