Soil carbon characterization along the profile of two forest soils under Quercus pyrenaica
2020-05-22FernndezGetinoAlonsoPradosSantMontany
A. P. Fernández-Getino · J. L. Alonso-Prados · M. I. Santín-Montanyá
Abstract In light of concerns over climate change and increasing levels of CO2 in the atmosphere, it is of importance to investigate soil organic matter in Mediterranean forests at a profile scale. In-depth studies of the organic fraction are also of interest to improve understanding of carbon balance and to facilitate modelling of carbon fixation in forest soils. This research evaluates the relationships between diverse parameters such as colour,content, and form of soil organic matter (SOM). Two Quercus pyrenica ecosystems with soils classified as inceptisols with a xeric or dry moisture regime, and developed under a Mediterranean climate in Spain, were used to characterize SOM through the complete sequence of layers of the soil profile. The differentiating factor between the two ecosystems was slope gradient. Characterization was done using characteristics of humic substances (HS) as indicators of SOM turnover in inceptisols.Infrared analysis was used to further characterize the humic acids. As soil colour measurements are a tool for soil type classification and soil organic carbon prediction, the relation between HS colour measured by reflection and by transmission was determined in order to establish a relationship between measurement techniques. Infrared analysis and colour provided evidence of a different level of stabilization of HS from both soils, and between the different horizons. Oxidation of humic acids was found to be greater in deeper horizons than in the surface layers. An inverse relationship between HS colour measured by reflection and by transmission was revealed. Both soils showed a clear trend in which horizons presenting lower absorbance numbers showed higher figures of hue and value. A more marked accumulation of humified compounds was found in pedons, (the smallest unit or volume of soil that contains all the soil types), in the less steep slope. This might be explained in terms of the physiographic position affecting infiltration behavior and exposure to runoff.
Keywords Organic matter turnover · Colour humic substance (HS) by reflection · Colour HS by transmission ·Humification index · Mediterranean Quercus species
Introduction
The concern over global warming and the role of soil carbon as a store of atmospheric carbon has increased interest in ascertaining current soil organic carbon (SOC)stocks with the greatest possible accuracy (Bell and Worrall 2009; Lal 2013; Lal et al. 2015; Taghizadeh-Toosi and Olesen 2016; Buczko et al. 2017; Hernández et al. 2017).Due to the large spatial variability in soil organic carbon and variability technical issues such as the use of different databases and scales, research is needed to determine the most accurate method of calculating SOC stocks and to validate prediction models (Vanguelova et al. 2016). Soil organic carbon is greater near the surface where biological inputs are high (Jenny 1980; Stevenson 1994; Parras-Alcántara et al. 2015; Bian-Lan et al. 2016). Processes that influence the fate of carbon in terms of quantity and quality are important in determining soil fertility and health as well as consequences for future environmental change scenarios(Dawson and Smith 2007; Moraes Sá et al. 2018). Carbon sinks and sources through forest management are accountable on a voluntary basis under Article 3.4 of the Kyoto Protocol, whose second commitment period runs from 2013 to 2020. In order to develop an appropriate forest management regime, it is important to know the depth of soil carbon in the entire profile (Clarke et al. 2015;Conforti et al. 2016). The levels of soil carbon are the product of complex interactions between climate, vegetation, topography, texture and land-use practices and management (Fernández-Romero et al. 2014; Zhiyanski et al.2015; Lozano-García et al. 2016; Wu et al. 2016; Francaviglia et al. 2017; Menichetti et al. 2017). Turbation may affect the chemical and structural composition of the most stable fractions of soil organic matter (SOM) such as humic substances (Dabin 1971; Dell’Abate et al. 2002; De Nicola et al. 2014). Due to strong climate influences on levels of SOC, monitoring should be carried out in regions with similar climate and environmental conditions to obtain a more accurate depiction of soil carbon dynamics. Infrared spectroscopy is a rapid and accurate tool to determine soil properties and assess soil quality which are related to soil functions (Terhoeven-Urselmans et al. 2008; Fernández-Getino et al. 2010, 2013). Research has shown that SOC may be easily predicted from spectral reflectance in the visible domain measurements (Aichi et al. 2009).
Soil colour is an outstanding morphological characteristic and of considerable practical significance in soils of the Mediterranean region (Sánchez-Marañón et al. 1997).Colour results from the combination of three main types of pigments: Fe-oxides and hydroxides (red to yellow), humus(black), and silicate and carbonate minerals (white to grey).The three pigment types have been studied by several researchers (Schulze et al. 1993; Scheinost and Schwertmann 1999; Sánchez-Marañón et al. 2004; Vodyanitskii and Savichev 2017). However, the relationship between colour of the organic material measured by reflection and transmission methods is still unknown. The Munsell colour system is internationally used for soil descriptions. Traditionally, samples have been visually matched to a colour chip with a given hue (colour), chroma (saturation or brilliance) and value (lightness or darkness), the three dimensions of colour. To overcome some of the limitations of the Munsell system, different colour space models have been used. Some researchers have studied the algorithms used for transformations between these colour space models and have analyzed their relationship to the soil Munsell notation (Viscarra Rossel et al. 2006). Soil organic carbon content has been predicted using field and laboratory measurements of soil colour (Skye et al. 2007), and other studies have evaluated the relationship between colour and other soil characteristics (Aitkenhead et al. 2013;Ibáñez-Asensio et al. 2013). Soil colour is an important and obvious feature and SOM is one of the primary pigmenting agents (Simonson 1993; Buol et al. 2003). Some research has concluded that the relation between soil colour and SOM is poor when the samples are from an extended geographical area and from soils with many different properties. However, with soils with similar morphological properties the associations are much closer (Fernández et al. 1988; Schulze et al. 1993). Therefore it is of interest to evaluate the absorbance figures of IR spectroscopy and the measurements of chroma, hue and value on superficial horizons under the above conditions. The majority of SOM colour studies have focused on colour measured by reflection with Munsell notation. The colour of a sample expressed in the colour Munsell notation can be calculated from its visible reflectance spectrum (Chamberlin and Chamberlin 1980). Fernández and Schulze (1987) and Escadafal et al. (1989) also calculated soil colours of the reflectance spectrum using data between 360 nm and 830 nm. Although colour measurement by reflection has been examined in the literature, there is no previous work regarding colour comparison measured by reflection and transmission analysis.
The objectives of this study are: (1) to characterize along soil profiles the influence of slope on SOM in two inceptisols under Quercus pyrenaica, using humic substance characteristics as indicators of SOM turnover; and,(2) to determine the relation between the colour of the humic substances colour measured by reflection and by transmission methods, and to establish a relationship between the two techniques.
Materials and methods
Two soils under Q. pyrenaica, the melojo oak, representative of the Mediterranean forest were chosen based on geomorphological and soil maps of the Sierra de Guadarrama region (Vaudour 1979). Two slopes (1% and 7%)were considered in the evaluation of slope influence.
Both sites are located in the central part of the Sierra,specifically in the Portazgo area. The Sierra is one of the two major geological domains which splits Madrid and is divided in turn into others of lower status: summits, slopes and depressions. Both soils are located in the slope domain,and further subdivided into two physiographic units, hillsides and ramps. Hillsides are a unit of transition between the summits and the ramps and the study soils were located here at 1100-2000 m altitude. The hillsides are net escarpments characterized by their linearity with a fundamentally structural origin since they correspond to large fault planes slightly moulded by the action of torrents and glaciers during the Pleistocene.
The soils overlie granite and late leucogranites that appear mainly in the central and eastern sectors of the Sierra and are of two types: the first is coarse-grained granites (5-10 mm) with adamellites formed by quartz,plagioclase, potassium feldspar and biotite with illmenite;the second is formed by fine-grained granitic rocks containing quartz, albite, potassium feldspar and biotite and locally, cordierite, andalusite and muscovite. This second type of bedrock is also associated with aplitic and pegmatitic dams (ITGME 1988).
The melojo oak is found from the Ramp of the Sierra up to 1700 m altitude, mixed mainly with ash. Both oak stands have similar densities, age and structure. The climate in the study area is classified as Humid Meso-Mediterranean.
Soil profile description
According to the Soil Survey Laboratory Methods Manual(USDA-NRCS 1996), the 1% oak forest soil was found as humic dystroxerepts, whereas the 7% oak forest soil was found as humic haploxerepts, both inceptisols, under Q.pyrenaica with the same parent material, topography,physiographic position and similar dark greyish brown colour (Tables 1, 2).
Sampling design
For the laboratory analysis, samples were collected from each horizon, homogenized, air-dried, crushed and passed through a 2-mm sieve (USDA-NRCS 1996). The analytical determinations are referenced to weight of dry soil at 105 °C. To guarantee reliability, the analyses were carried out fivefold and the results expressed in percentage of the initial dry soil sample at 105 °C. The location of the study sites is very important. This region is under a Mediterranean climate with an annual rainfall average of 745 mm,and average temperature of 10 °C.
The two sampling sites are referred to as: (1) soil on a 1% slope plain situated in the central part of the Guadarrama Mountains (1230 m) and covered by oak; and (2) soil under oak on a 7% slope situated in the central zone of the Guadarrama Mountains (1250 m). The soils here are in a humid zone, with a high contribution of litter fall. The major difference in the two sites, apart from slope, is that the soil of (1) occasionally becomes flooded.
General analysis
The total dry organic matter was determined by soil sample calcination in a muffle furnace at 540 °C (Nelson and Sommers 1996), and the oxidizable organic carbon content was determined according to the Walkley-Black method described by Nelson and Sommers (1996). Soil pH was determined in water suspension (1:2.5 w:w).
The samples underwent an alkaline extraction to obtain the total humic extract (THE) and afterwards, the humic acids at pH 1.0 were precipitated in this extract. Organic carbon content was determined in both the humic and precipitated extracts. The total humic extract was dried in a bain-marie or water bath at under 80 °C. The desiccated sample was assessed according to the Walkley-Black method to determine the C content of the THE.
The humic acids were isolated according to Swift(1996), with some minor modifications. Approximately 20 g of dry soil, sieved at 2 mm, and 150 ml of sodium pyrophosphate were mixed and shaken 5 min, and centrifuged 15 min at 4000 rpm. The supernatant was then filtered and 100 ml of NaOH 0.1 N were added to be later shaken, centrifuged and filtered. The process was repeated successively until a drop of the extract was clear. It was centrifuged and the precipitate, which contained the pure humic acids, was collected and introduced in the dialysis membrane. Once the impurities were eliminated, the samples were frozen and then freeze-dried to obtain the purified humic acids.
To obtain the carbon content in the humic acids, the THE was centrifuged and the precipitate was dried in a bain-marie under 80 °C. It was assessed according to the Walkley-Black method. The carbon content of the fulvic acids was determined by the difference between the total humic extract carbon percent and the humic acid carbon percent.
Humification parameters such as the Humification Rate(HR) and the Polymerization Rate (PR) were calculated to establish comparisons between horizons within the same soil and between the two soils, according to Ciavatta et al.(1990), as follows:
HR (%) = 100 * C(HA+FA)/Corg
PR (%) = 100 * CHA/CFA
where CHAis humic acid carbon, CFAthe fulvic acid carbon, and Corgthe organic carbon
Infrared spectroscopy
KBr pellets (2 mg HA in 200 mg KBr) were prepared and the spectra acquired at a wavelength range of 4000-600 cm-1with a Bruker IFS28 Fourier-transformspectrophotometer. The five most typical bands were:3400 cm-1(vibrations O-H); 2920 cm-1(C-H aliphatic);1720 cm-1(C=O from carboxylic or ketonic groups);1510 cm-1(C=C aromatic); and, 1230 cm-1(C-OH phenolic).
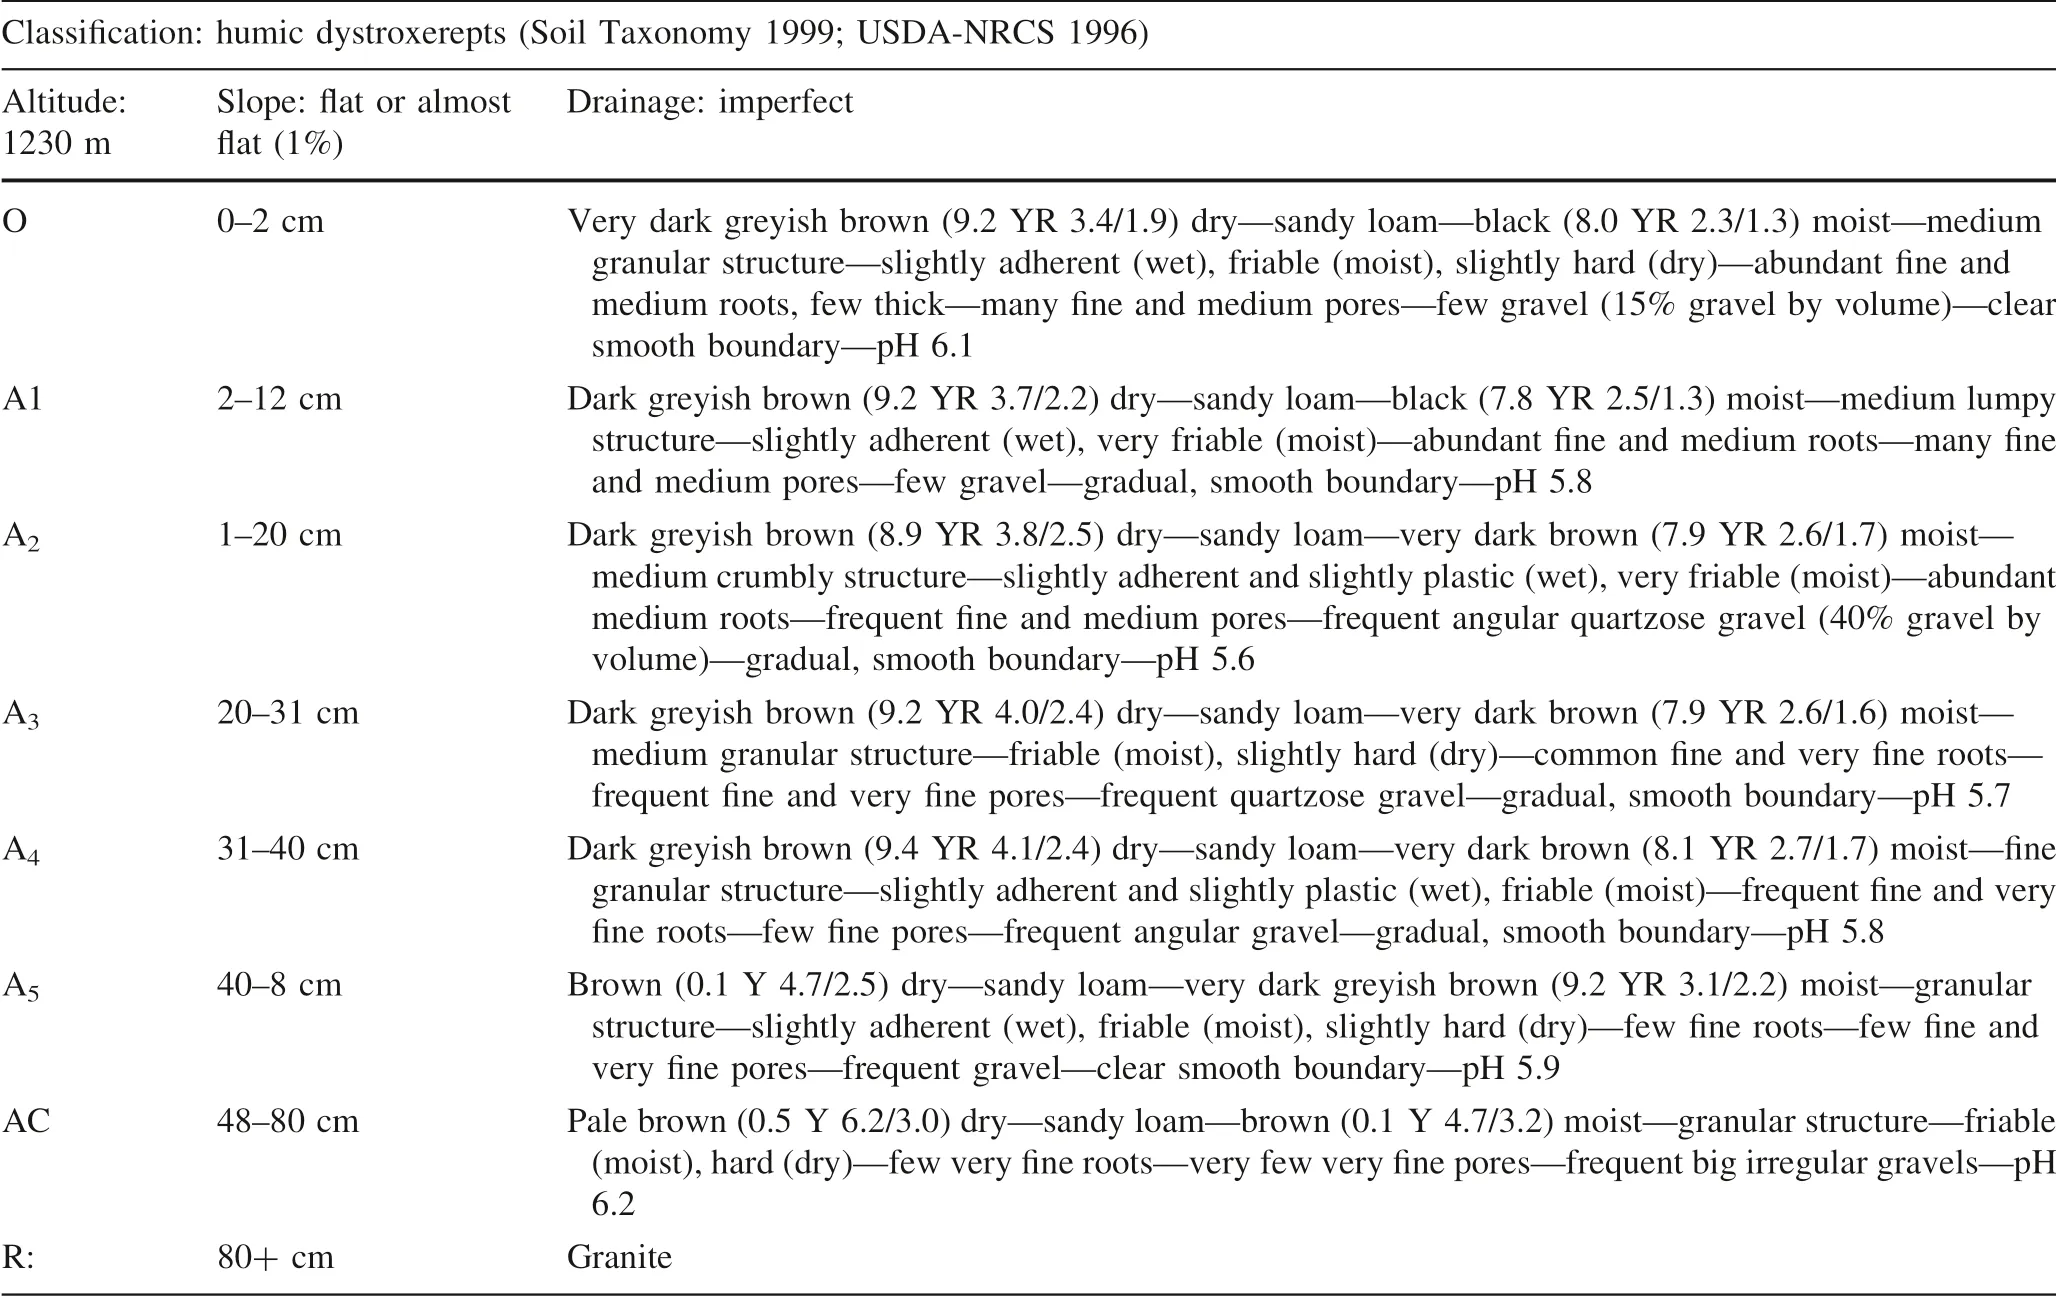
Table 1 Field description of pedon 1
Colour (THE)
Determination of soil colour in dry and humid conditions used a Minolta Chroma-Meter CR 200. The measure of the colour in the Munsell system was recorded (hue value(lightness)/chroma) as well as in the CIE-Yxy-1931 system(Wyszecki and Stiles 1967; American Society for Testing and Materials 1998). The hue shows the length of the dominant wave, the value (lightness) shows the proportion of reflected light and the chroma the purity of colour (Judd and Wyszecki 1982). In the CIE-Yxy colour notation system, the Y is luminosity and x and y the chromatographic coordinates. As in the other investigations, five soil samples from each horizon were evaluated. Each sample was placed in a Petri dish without a lid and five measurements were done with the Chroma-Meter CR 200, resulting in twenty-five results per horizon to assess the colour of the dry soil. The samples were then moistened with distilled water and five measures taken to determine the colour of the moist soil. The alphanumeric colours were converted to numerical figures using a Munsell colour circle (Chamberlin and Chamberlin 1980). In this conversion 10 R = 10,10 YR = 20, 10 Y = 30 and 10 GY = 40.
The colour by reflection and transmission was measured in the humic extract as described (Swift 1996). According to Beer’s Law, the amount of incident light absorbed by the substance depends on the dissolution concentration: I = Io* 10-εcd, where I is the transmitted intensity; Io corresponds to the incident light; c is the dissolution concentration in mol/L; d is the thickness across which the light is transmitted; and ε is the molecular extinction coefficient of the solute for this wavelength. Thus, in order to obtain the samples to perform the measurements, a ratio soil/solution(w/v) was established according to the respective horizon organic matter content (Schulze et al. 1993). These considered ratios were for soil under oak (1% plain): horizons(O, A1, A2, A3) 1/100; horizons (A4, A5) 1/50; and horizon(AC) 1/25. In the case of soil under oak (7% slope), the ratios were: horizons (O, A1, A2): 1/150; horizons (A3, A4,A5): 1/75; and, horizon (AC): 1/25.
The colour reflected from the total humic extract was determined through the top part of a Petri dish with 99%transmittance for the chrominance (value and chroma) by a Minolta Chroma Meter CR-200. The Petri dish was covered with a black lid to avoid external luminosity. The colour measurements were carried out fivefold. In addition,five different samples of humic extract were considered for every horizon for a total of 25 results per horizon.
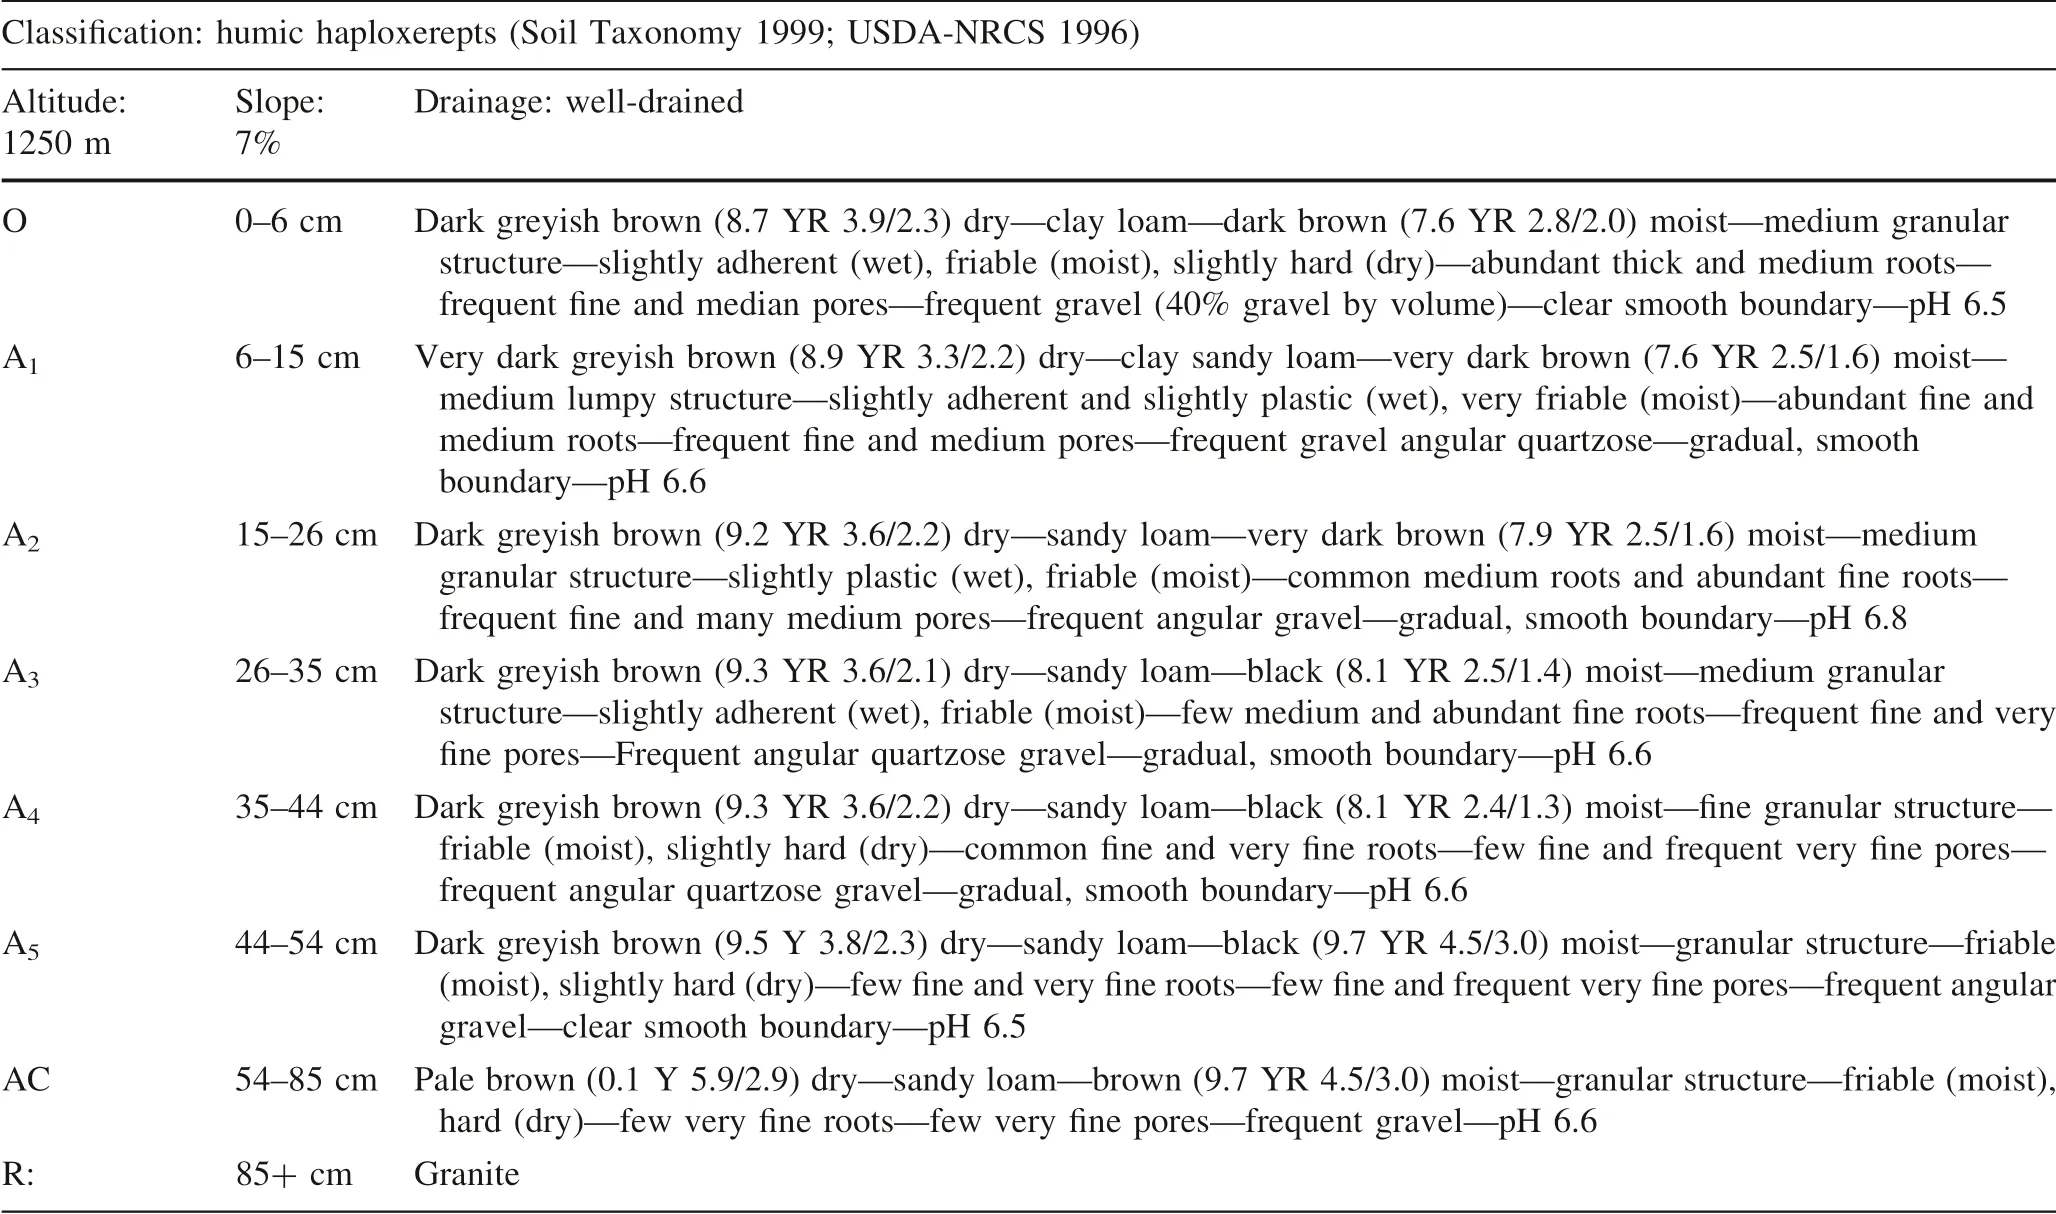
Table 2 Field description of pedon 2
The transmission colour was done on an aliquot of the total humic extract. The soil/solution (p/v) was established according to the organic matter content of the different horizons from each soil. The transmitted colour was related to absorbance measures identified with an UV-VIS Shimadzu UV-1203 spectrophotometer at 350 nm to 800 nm of the visible spectrum, at successive intervals of 5 nm.Five measurements were carried out at each wavelength on five different samples of total humic extract for a total of 25 measurements per horizon.
Results
Humification parameters
Table 3 shows that in both forest soils, the organic carbon content is very high in the surface horizons because of the accumulation of litter. This diminishes gradually with depth, down to minimal figures in the AC horizon. The O horizon has a higher HA/FA ratio which suggests a more marked evolution of humic compounds seen in the higher degree of polymerization. The carbon content of the humic acids represents a very important fraction in the content of C of the total humic extract.
Infrared analysis
The infrared spectroscopy (Fig. 1 and Table 4) confirms the higher oxidation degree of the humic acids (larger figures in 1720/3400, 1720/2920 and lower figures in 1230/1720) in the deepest horizon of the soil under oak in slope (7%).
This is reflected in a higher acidity in the horizons. The oxidation of the humic acids in the pedon under oak of the 1% plain is higher in the deeper horizons than in the superficial ones (larger figures in 1720/3400, 1720/2920).The relation 1720/3400 indicates that in both soils the deepest horizons present the highest numbers.
Colour
The absorption spectrum of a substance is related to its colour (Fig. 2) and determines the degree of lighttransmission for every wavelength. The results show that the colour of the total humic extract of the soil horizons is affected by the organic matter content. The absorption spectrum shows in both soils an absorbance peak and a maximum transmittance at 455 nm. In the soils of the 1%plain and 7% slope, the surface horizons present higher chroma as do the AC horizons which, at the same time,show lower absorbances. Comparing the colours of the total humic extract measured by reflection and by transmission, there is a clear trend in which the horizons that have lower absorbance figures, show higher hue and value numbers (Table 5).

Table 3 Organic matter characterization and humification index
Discussion
Comparing the soil data sets under study, the pedon on the 1% plain had less carbon in all horizons, Corgoxias well as CHA+FAand CHA, but higher humification and polymerization rates. The pedon on the 1% plain showed a marked accumulation of humified compounds compared to the 7%pedon. The physiographic position could explain the results since, in gently sloping morphologies as in the 1% pedon,large amounts of water can infiltrate the soil compared to the 7% pedon, which would have different infiltration behavior and be more exposed to runoff.
The relationship between the intensities of the principal spectra bands in both soils indicate that the relations 3400/2920, 1720/2920 and 1230/1720 have the lowest figures,which is consistent with the lack of hydroxilic and phenolic groups. On the contrary, the relations 1720/3400 and 1510/2920 have the highest figures which fits with a predominance of aromatics together with carboxylic or ketonic and aliphatic groups. No relevant differences were found between the soils, which is consistent with their similar parent material, vegetation, and climate.
The colour of the THE (total humic extract) measured by reflection is inversely related to the THE colour measured by transmission. The colour shows the evolution of the organic matter. Analyzing the spectrophotometry of the THE, a similarity can be observed between the curves for the soil horizons under 1% oak plain and under 7% oak slope. Both had similar absorbance figures, the highest absorbance numbers in the A4horizon and the lowest in the AC horizon. These similarities may be explained because both soils have the same parent material and vegetation, as well as similar moisture and temperatures. We noted that the humic extract colour has higher chroma and lower absorbances in the surface horizons than in the deeper ones,which is related to the lower degree of oxidation of the humic acids of these surface horizons.
Conclusions
It is important to determine the soil organic matter (SOM)in the entire profile and to further study the most established fractions of SOM such as humic substances. Two Mediterranean forest soils under oak were characterized,the slope gradient being the variable factor. A marked evolution of the humic compounds was observed in the O horizon. Total humic extract colour measurements by spectrophotometry and by reflection showed similar values,which was consistent with the fact that they are soils with the same parent material, vegetation and moisture and temperature regimes. These values were not conditioned by the influence of the slope gradient since differences were not relevant (<10%). Both techniques confirmed the inverse relationship in the measurements of total humic extract colour by reflection and by transmission. Further research on other soils under different vegetation types should be carried out to establish equations of the relationship between the two measurement techniques of soil organic matter colour.
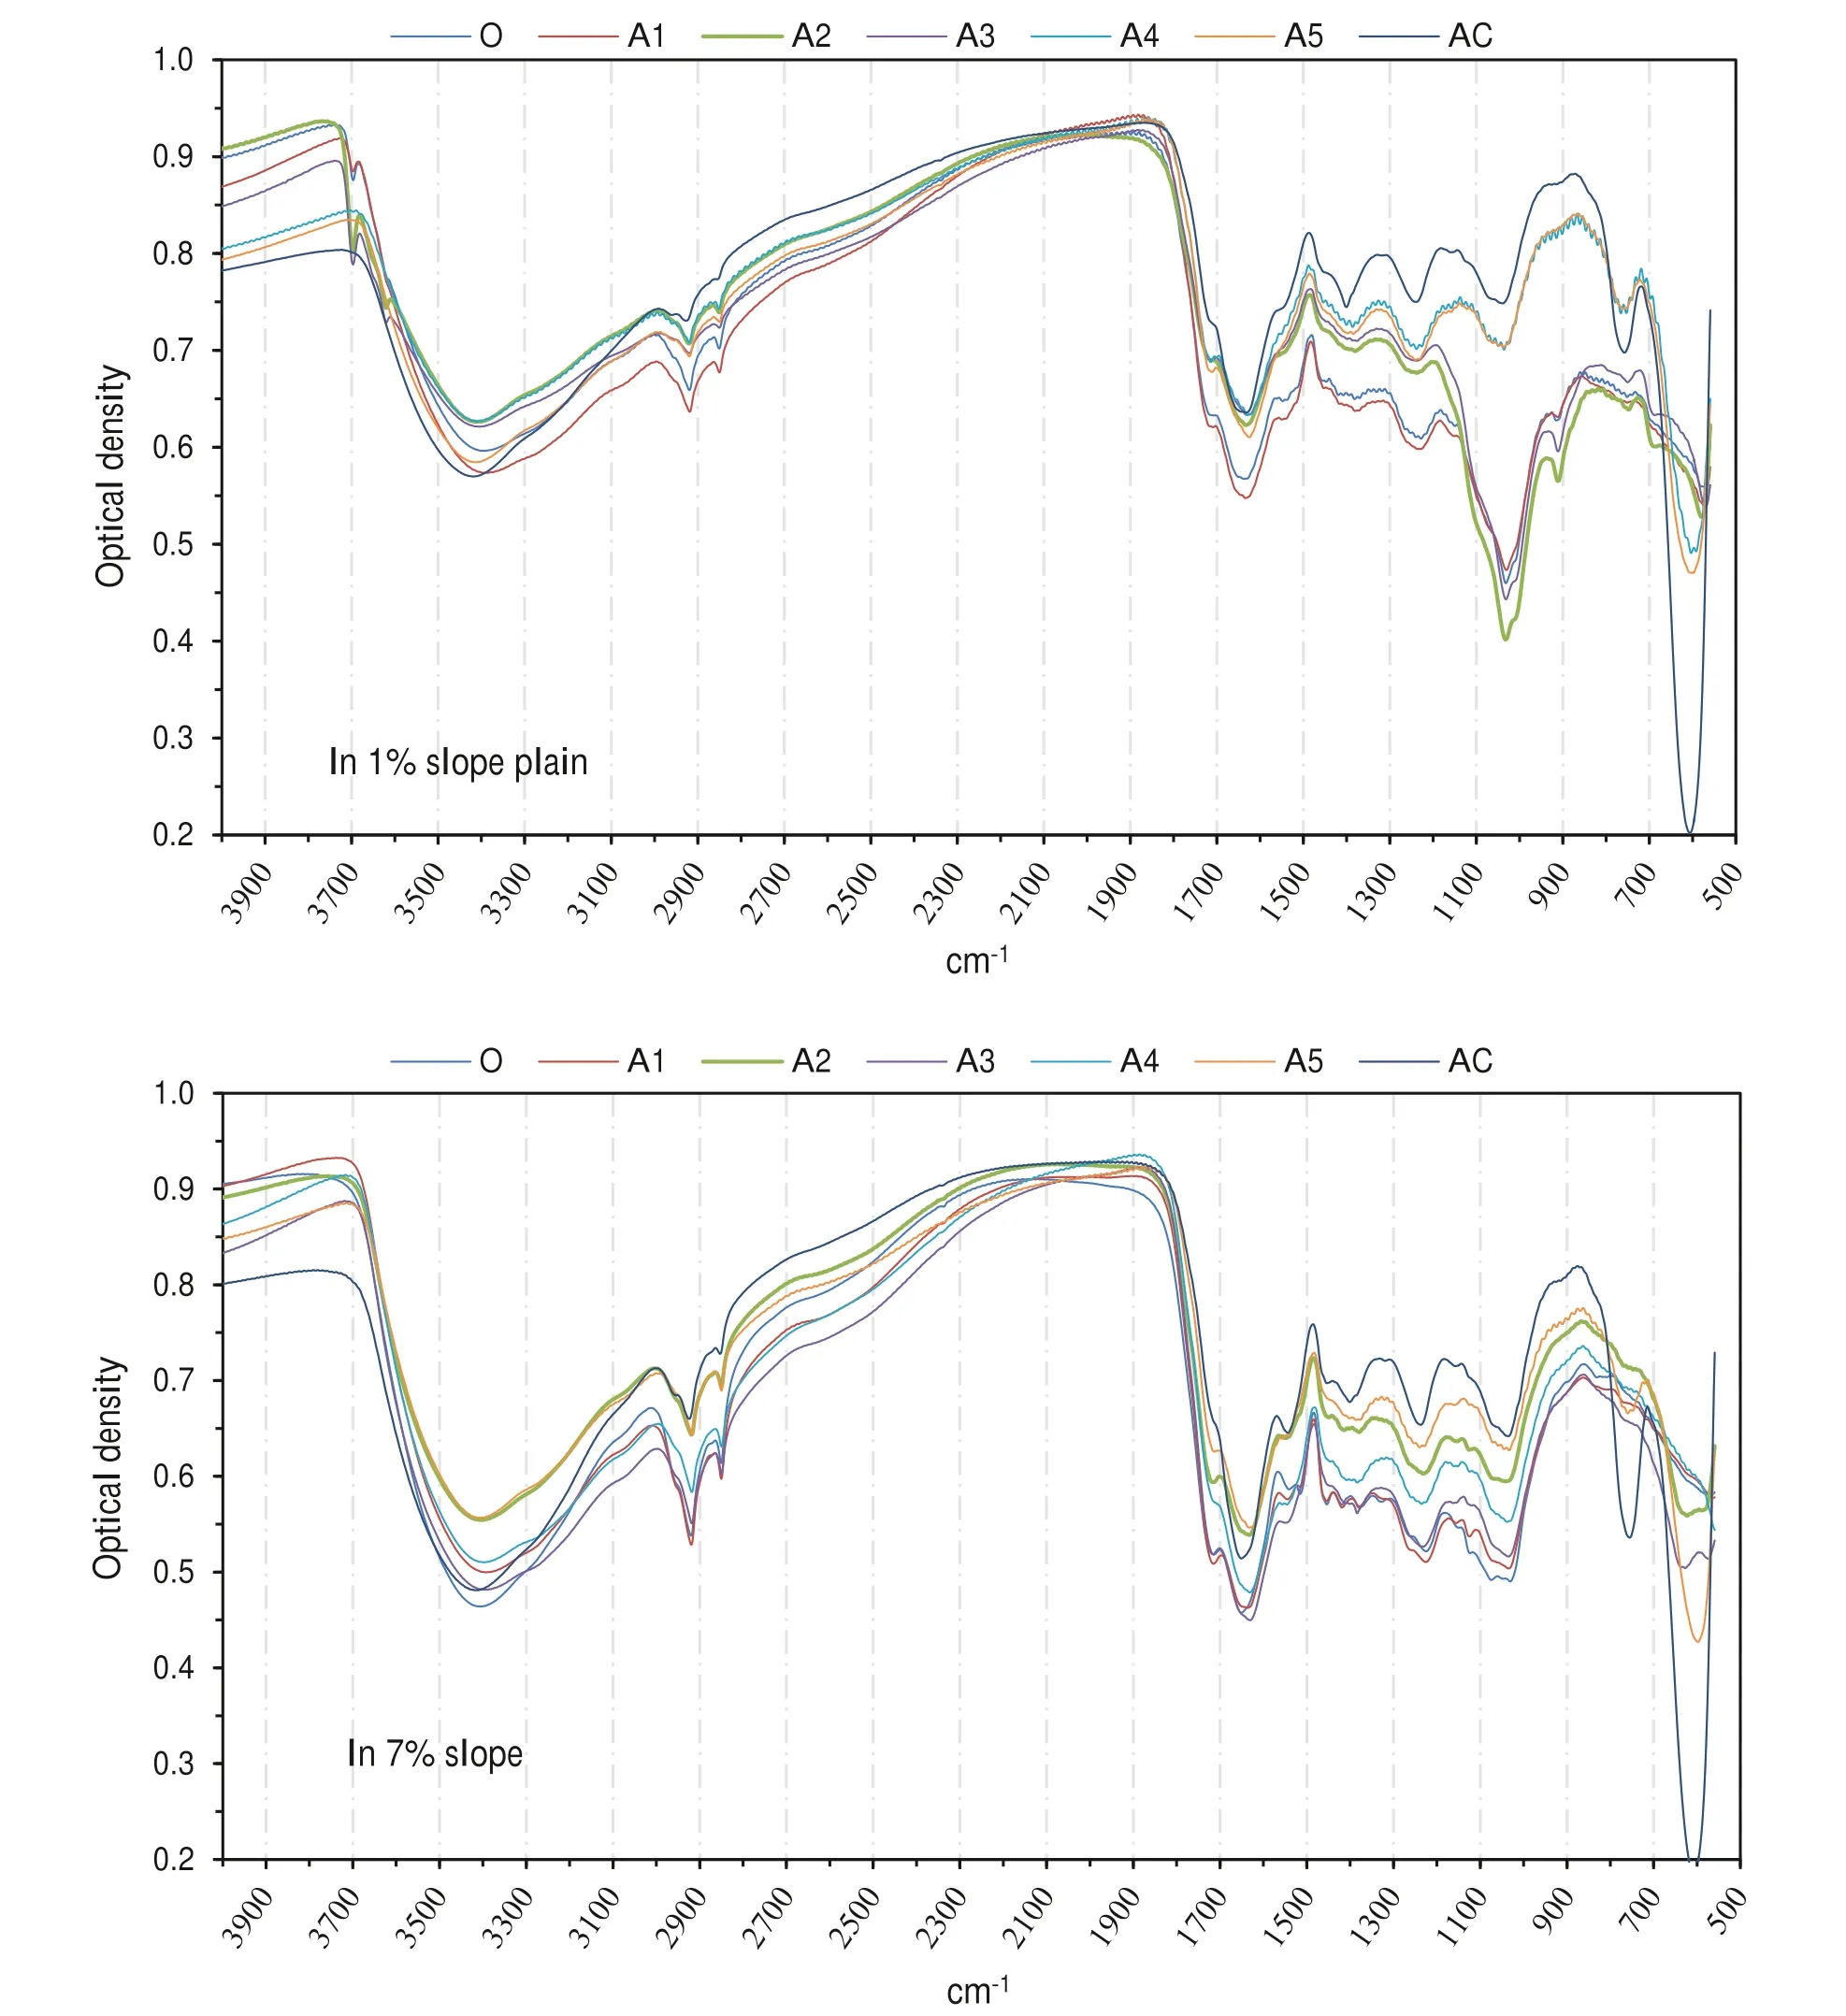
Fig. 1 Infrared spectra of the humic acids for the different horizons
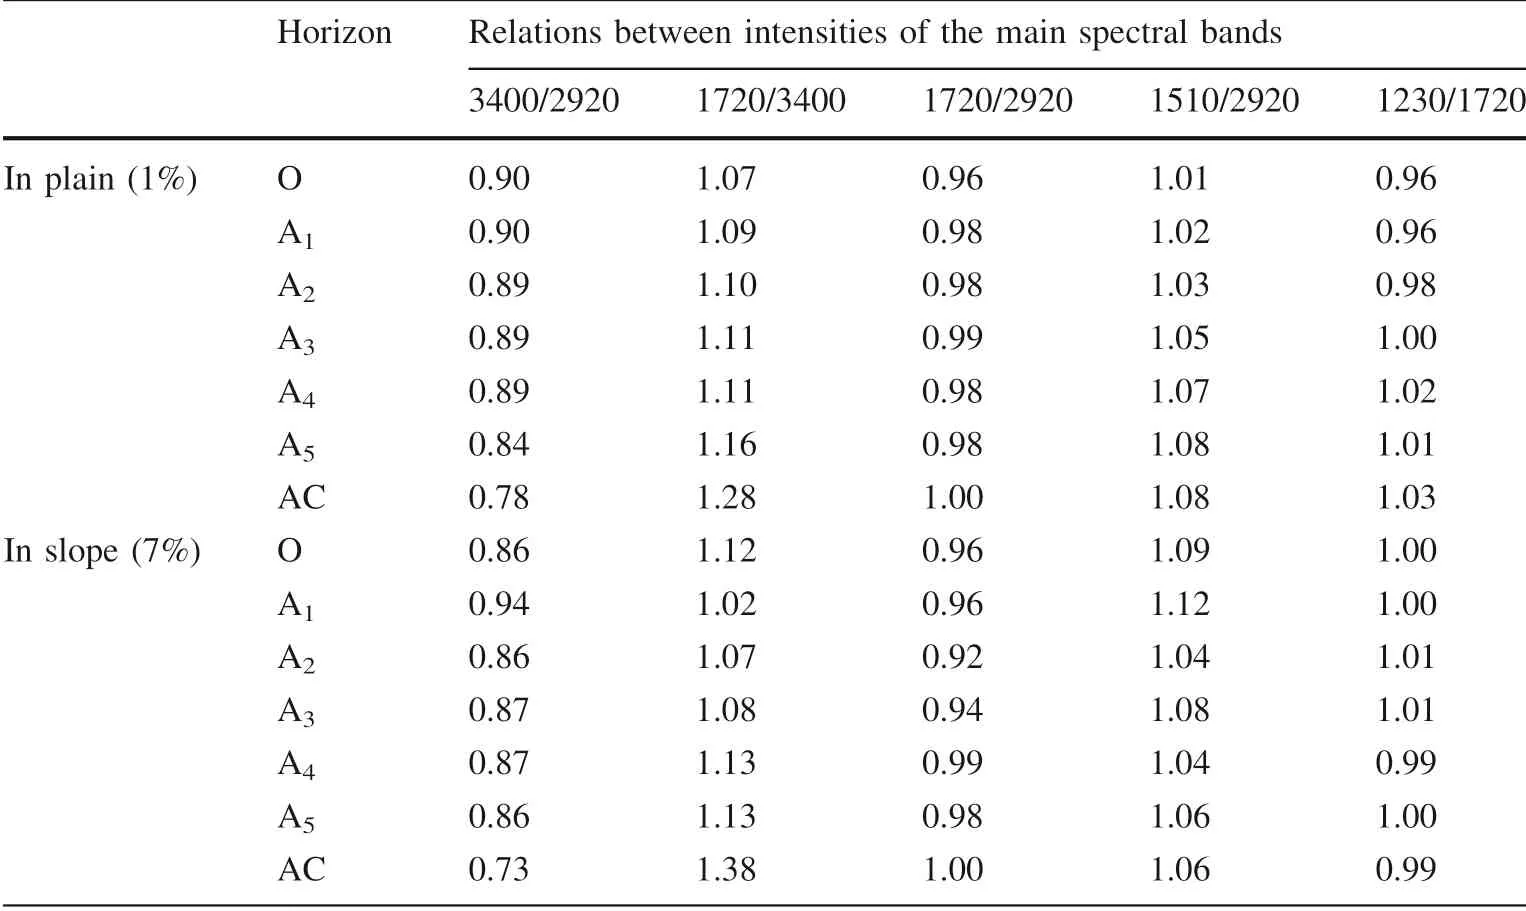
Table 4 Infrared spectroscopy of the humic acids

Fig. 2 Total humic extract(THE) colour by transmission for the different horizons
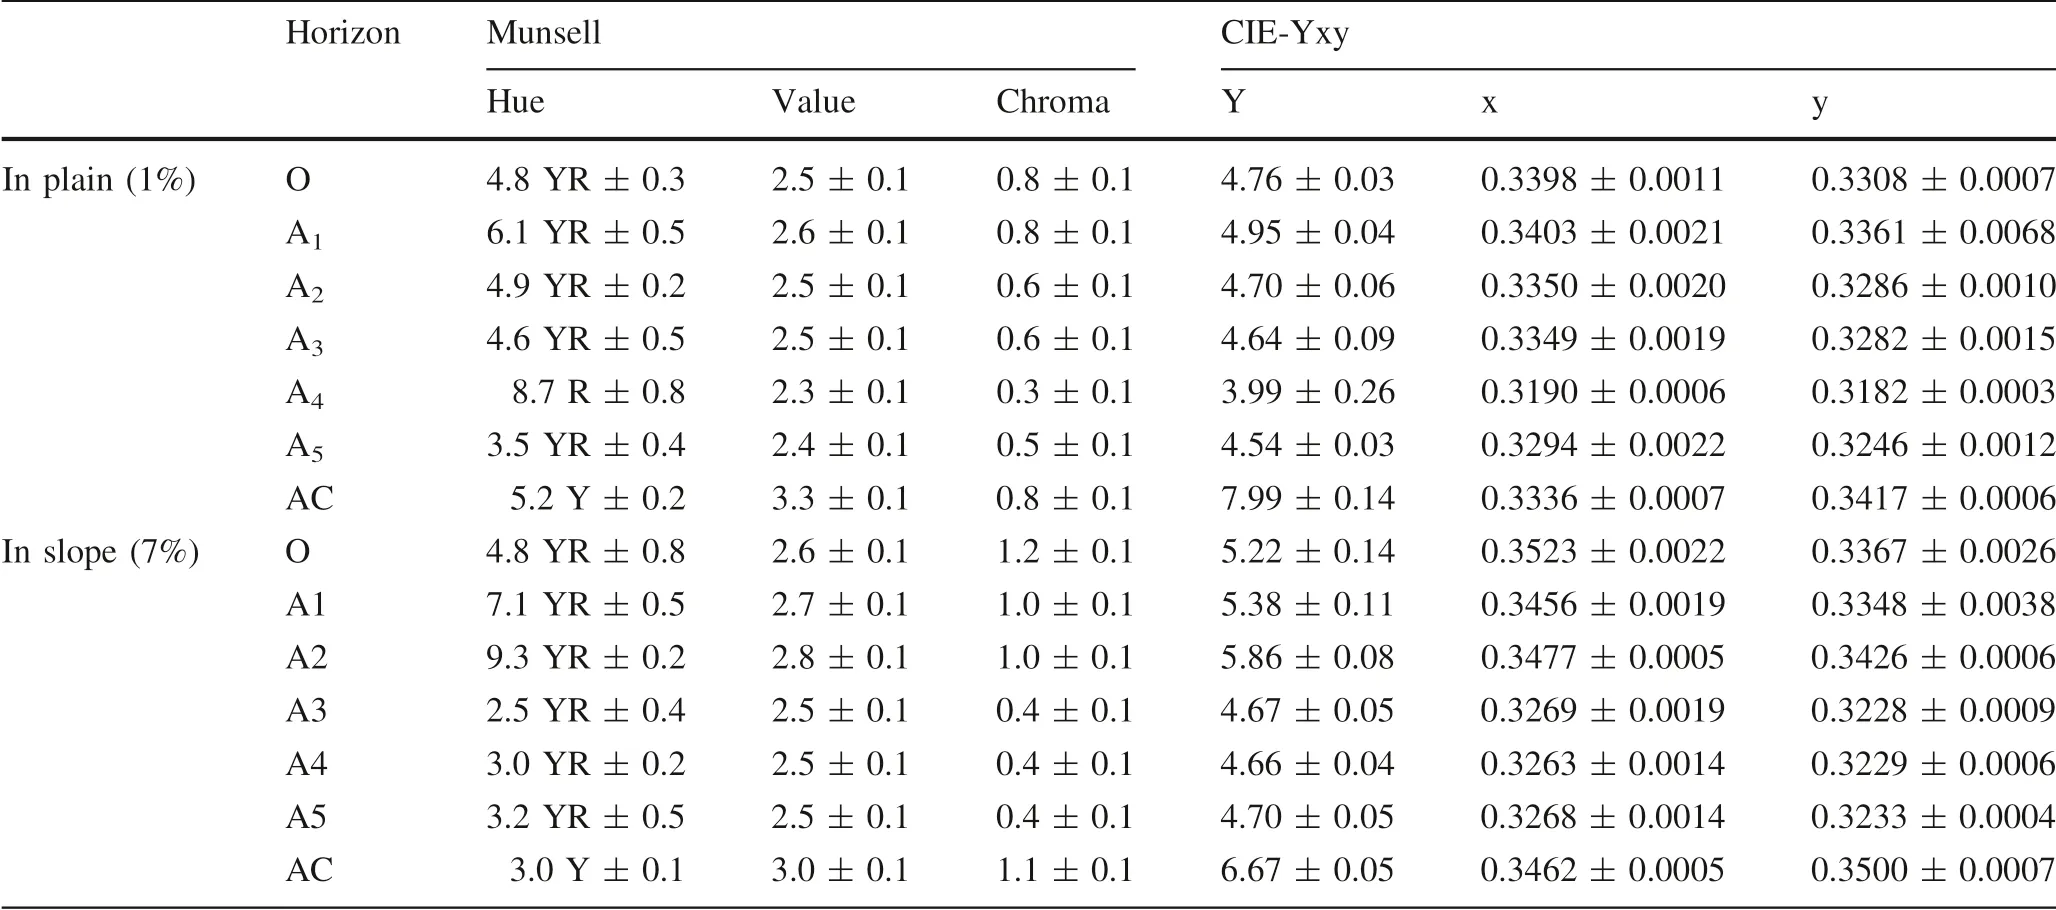
Table 5 Total humic extract colour by reflection
杂志排行
Journal of Forestry Research的其它文章
- Past, present and future of industrial plantation forestry and implication on future timber harvesting technology
- Effects of climate changes on distribution of Eremanthus erythropappus and E. incanus (Asteraceae) in Brazil
- Effects of climate and forest age on the ecosystem carbon exchange of afforestation
- Effect of gap size and forest type on mineral nitrogen forms under different soil properties
- Effect of forest thinning on hydrologic nitrate exports from a Nsaturated plantation
- Floristic analysis and dominance pattern of sal (Shorea robusta)forests in Ranchi, Jharkhand, eastern India
