Effect of forest thinning on hydrologic nitrate exports from a Nsaturated plantation
2020-05-22MasaakiChiwaHirokazuHagaTamaoKasaharaMakikoTateishiTakamiSaitoHiroakiKatoKyoichiOtsukiYuichiOnda
Masaaki Chiwa · Hirokazu Haga · Tamao Kasahara · Makiko Tateishi,3 ·Takami Saito,4 · Hiroaki Kato · Kyoichi Otsuki · Yuichi Onda
Abstract Although several studies have assessed the effects of thinning on water quality, including nitrogen(N) exports, few have examined N-saturated plantations.This study assessed the short-term effect of thinning on N exports from a N-saturated plantation forest in northern Kyushu, western Japan, that was thinned (43% of basal area) during January-March 2012. Water levels at the gauging station were continually measured, and streamwater baseflow and stormflow samples were collected before (2011) and after (2013) forest thinning. Annual precipitation before (2469 mm) and after (2418 mm) forest thinning differed little, and annual water discharge after thinning (1641 mm) was similar to that before thinning(1609 mm). However, direct flow during stormflow periods was higher after thinning (260 mm) than before (153 mm).The concentrations of major ions in stream water did not differ before and after thinning. As a result, the high annual dissolved inorganic N (DIN) exports differed little before(35.8 kg N ha-1 a-1) and after (36.5 kg N ha-1 a-1) forest thinning. DIN exports during stormflow periods were slightly higher after (12.2 kg N ha-1 a-1) than before thinning (10.5 kg N ha-1 a-1) and were proportional to the increased direct flow after thinning (561 mm after vs.470 mm before thinning). We concluded that thinning does not affect annual N exports from the N-saturated plantation forest, but it can increase the proportion of N exported during stormflow periods in proportion to increased water volume of direct flow after thinning.
Keywords Thinning · Nitrogen saturation · Nitrogen export · Direct flow · Baseflow
Introduction
Elevated atmospheric nitrogen (N) deposition can increase the amount of N leached from N-saturated forests, an issue of widespread concern. Anthropogenic N emissions have increased dramatically since 1960 (Galloway 2005), especially in Asia recently due to rapid Chinese economic growth (Akimoto 2003; Ohara et al. 2007). Although the increased N supplied by anthropogenic N emissions mitigates N limitation in forested ecosystems (Boggs et al.2005; LeBauer and Treseder 2008; Vadeboncoeur 2010),chronic N deposition may result in N saturation, i.e., the amount of N exceeds the biotic demand (Aber et al. 1989;Vitousek et al. 1997).
Forests can mediate downstream water quality (Allan et al. 1997; Wickham et al. 2002; Floyd et al. 2009);therefore, forests have been recognized as a small nonpoint N source (Allan et al. 1997; Wickham et al. 2002;Floyd et al. 2009). Atmospheric N deposition can be largely retained in N-limited temperate forests (Vitousek and Howarth 1991; Fenn et al. 1998; LeBauer and Treseder 2008), but N-saturated forests can be an important nonpoint source like urban and agricultural areas (Chiwa et al.2012, 2015) because high levels ofleaches from N-saturated forested ecosystems with large depositions of atmospheric N (Aber et al. 1989; Kopáček et al. 2016).Ohrui and Mitchell (1997) reported that forests in Japan became N saturated in areas with high levels of atmosp heric N deposition caused by fossil fuel burning. Highconcentrations in streams may also cause eutrophi-cation downstream (Chiwa et al. 2012).
The aim of this study was to assess the short-term effect of thinning on N exports from an N-saturated plantation forest in northern Kyushu, western Japan, where inferior trees including forked, bent, and broken ones, corresponding to 50% of stems in the forest stand, were thinned during January-March 2012. We compared discharge,water quality, and N discharge during nonstorm and storm periods between before (2011) and after (2013) forest thinning.
Efforts should thus be made to reduce N exports from upland N-saturated plantation forests. Many studies showed that forestry activities such as clearcutting affect stream discharge and nutrient outflow (e.g., Likens et al.1970; Jewett et al. 1995). Clearcutting increases N mineralization in the soil and forest floor (Bormann and Likens 1979; Vitousek et al. 1989; Prescott 1997) and N leaching(Weis et al. 2001; Thomas et al. 2016). Thinning in poorly managed plantations has been proposed to increase water yield (Grace et al. 2006; Onda et al. 2010; Dung et al.2012) and improve water quality (Grace et al. 2006;Gundersen et al. 2006; Onda et al. 2010). Although several studies have assessed the effects of thinning on water quality, including N exports (Briggs et al. 2000; Grace et al. 2006; Gundersen et al. 2006; Amatya and Skaggs 2008; Fukushima et al. 2015), few have focused on the effects of forest thinning on N exports from N-saturated plantation forests.
By reducing interception and transpiration, forest thinning should increase watershed discharge (Lane and Mackay 2001; Dung et al. 2012; Kubota et al. 2013) and subsequently affect N exports from N-saturated forests.Therefore, it is important to analyze water discharge to assess the effects of thinning on N exports from N-saturated plantation forests. Thinning may also increase soil nitrification rates (Morris and Boerner 1998; Inagaki et al.2008; Zhuang et al. 2014), decrease N uptake by plants(Inagaki et al. 2008), and decrease dry deposition (Bäumler and Zech 1997). These changes may alter the solute concentrations in the direct-flow component. However, the extent of the changes in water quality of direct flow may depend on the extent to which it contributes to total discharge, which depends on the geological characteristics of the watershed. When a large proportion (e.g., 50%) of stems are thinned out, N exports from a forested watershed after thinning can be analyzed.
Materials and methods
Study site
This study was conducted in the Yayama Experimental Watershed (YEW; 33°31′N, 130°39′E, 300-400 m above sea level (asl); Fig. 1), western Japan. The watershed area covers 2.98 ha. Overstory vegetation in the watershed is dominated by Japanese cedar (1.61 ha) and Japanese cypress (1.06 ha). Detailed information for the plantation is shown in Table 1. The trees were planted in 1969 and were 41 years old at the start of the study in July 2010. The annual mean atmospheric N deposition in bulk samples at the YEW was 16.5 kg N ha-1a-1during 2010-2013(Chiwa et al. 2015). The mean annual temperature was 13.4 °C and precipitation was 2351 mm at the watershed during the study period (July 2010-June 2013). There was little difference in annual precipitation between 2011 (prethinning) and 2013 (post-thinning; Table 2), and the precipitation volume of individual precipitation events and precipitation intensity also did not differ distinctly (Fig. 2).Precipitation was continuously measured in an open area 320 m from the watershed (Fig. 1). The precipitation volume was measured using a tipping-bucket rain gauge(TK-1, Takeda Instruments, Tokyo, Japan). Details of vegetation and meteorological data in the watershed have been described already (Saito et al. 2013, 2015; Chiwa et al. 2015).
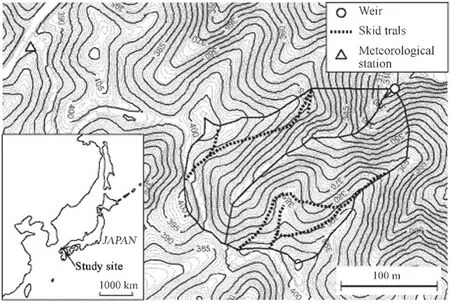
Fig. 1 Location of Yayama Experimental Watershed (YEW) in Japan. Stream water samples were collected approximately 3 m upstream from the weir (white circle)

Table 1 Properties of Japanese cedar and Japanese cypress plantations before and after forest thinning in the Yayama Experimental Watershed

Table 2 Precipitation depth (P;mm) and water discharge (D;mm) before and after thinning

Fig. 2 Frequency distribution of individual precipitation volumes (mm) and intensity (mm/h) in 2011 (pre-thinning) and 2013 (post-thinning).Each precipitation event was determined based on a minimum inter-event time of 6 h
From late January to early March 2012, 43% of the basal area (corresponding to a 41% decrease in volume) in the forest was removed. Inferior trees including forked, bent,and broken ones were preferentially selected for forest thinning. The thinning operation decreased the volume by approximately 40% (Table 1). After thinning, large stems were removed from the studied watershed, but woody materials including foliage were left. Skid trails were constructed during the thinning operation and remained afterward. A series of large precipitation events (event precipitation: 146-381 mm) in June and July 2012 caused rill erosion of skid trails (Fig. 3a). After that, surface water frequently flowed from the skid trails to the slope. Surface soil erosion was prevented by covering the bare skid trails with leftover woody materials and foliage in September 2013 (Fig. 3b), which did not affect the discharge volumes and water quality evaluated in this study because heavy,intense precipitation did not occur from September 2013 to December 2013.
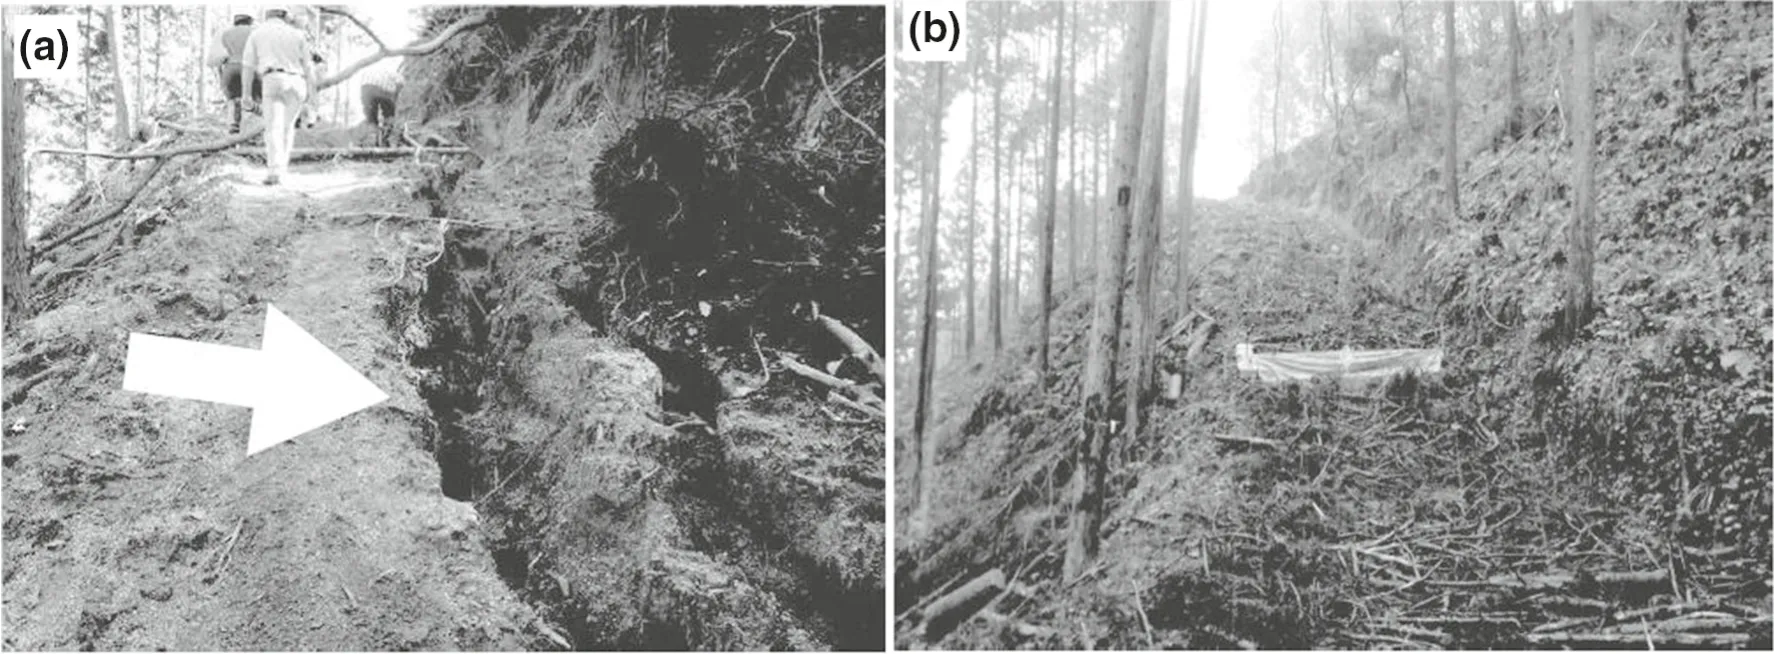
Fig. 3 a Rill erosion of skid trails and b skid trails that have been restored by covering them with leftover woody materials and foliage
Water discharge
Water levels at a structure combining a Parshall flume and a V-notch weir that was placed at the mouth of the YEW(300 m asl, Fig. 1) were continually measured every 10 min using a capacitance probe (WT-HR 500, Trutrack Ltd., Christchurch, New Zealand). Stream flow was divided into baseflow and stormflow conditions according to the study of Hewlett and Hibbert (1967). This method defines direct flow as beginning from the start of the rise of the hydrograph and ending when the falling limb intercepts an extended line with a slope of 0.0055 L s-1ha-1h-1.Stormflow includes both direct flows and baseflows during this period.
Water sample collection and analysis
Stream water in baseflow conditions typically was collected biweekly above the gauging station (25 times before thinning from March to December 2011, 38 times after thinning from June 2012 to November 2013. Because stormflow contributes consistently to the annual exports of solutes, including dissolved inorganic N (DIN) (Swistock et al. 1997; Chiwa et al. 2010a; Ide et al. 2012), we collected stormflow with an automatic sampler (Sigma 900,Hach, Loveland, CO, USA) every 2-5 h during each stormflow period that included the rising and falling limbs of the hydrograph. Water sampling was initiated by a rise in the water level of the stream after rainfall started, and the automatically partitioning water sample was collected every 2-5 h during the storm. In total, 24 partitioning water samples were collected during each stormflow period. Due to numerous collected water samples, six samples were selected according to changes in discharge for use in chemical analyses. Stormflow was sampled 20 times before thinning from July 2010 to October 2011 and 12 times after thinning from July 2012 to October 2013.
After transporting the samples to the laboratory, samples of stream water were filtered through pre-cleaned 0.7-μm glass-fiber filters (Whatman, GF/F) to measure dissolved total N and phosphorus concentrations. The filtered samples were additionally passed through a 0.45-μm membrane filter (Chromatodisc 25A, GL Science, Tokyo,Japan) to determine the concentrations of major ions (Cl-,,, Na+,, K+, Mg2+, and Ca2+) by ion chromatography (DX-120, Dionex, Osaka, Japan).
Annual flux calculations
To calculate annual exports of, the exports during baseflow and stormflow were summed. The amount of N exported during baseflow periods was calculated using the LQ regression method (Ide et al. 2012) and the equation where L is amount exported (μmol m-2s-1), Q is amount discharged (mm s-1), and a and b are empirical parameters, which were determined from baseflow samples collected in 2011 and 2013.

To calculate the amount of N exported during storms,the relationship between gross export (ΣLgross) and gross discharge (ΣQgross) (Chiwa et al. 2010a) was calculated as

where a′and b′are empirical parameters. The empirical parameters of a and b were determined by baseflow samplings collected from July 2010 to October 2013.ΣQgrosswas calculated by summing the discharge during stormflow sampling. ΣLgrosswas calculated by summing the hourly loads. The hourly load was calculated by multiplying the concentration by the hourly discharge. Annualexports during storms was calculated by summing the load(ΣLgross) offor every stormflow event estimated from the Eq. (2) established every year. Details of the calculation are described in our previous study (Chiwa et al. 2010a).
Results
The annual water discharges after forest thinning were similar to those before thinning (Table 2). However, direct flow during stormflow periods was higher after thinning than before, while baseflow during nonstorm periods was slightly lower after thinning than before (Table 2). The concentrations of major ions did not differ substantially before and after forest thinning (Fig. 4, Table 3), and did not have distinct seasonal variation in stream water(Fig. 4). As a result, the LQ relationship did not change after thinning (Fig. 5), and the annual DIN exports showed little difference before (35.8 kg N ha-1a-1) and after(36.5 kg N ha-1a-1) thinning (Table 4). Direct flow during stormflow periods was higher after (561 mm) thinning than before (470 mm; Table 2), and DIN exports during stormflow periods were slightly higher after (12.2 kg N ha-1a-1) than before thinning (10.5 kg N ha-1a-1)that was proportional to the increased direct flow after thinning.
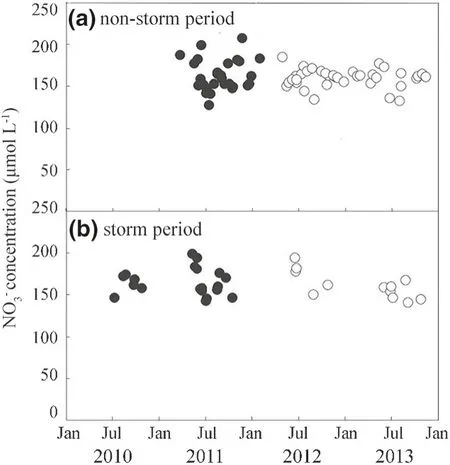
Fig. 4 Nitrate concentrations in stream water during a nonstorm and b stormflow periods before and after thinning. Nitrate concentration during stormflow is shown as a discharge-weighted mean concentration
Discussion
Effect of forest thinning on annual discharge
Annual discharge differed little before and after thinning(Table 2), despite 43% of the basal area in the forest being removed by thinning. Our results contrasted with those of other studies, which reported that forest thinning increased water discharge (Lane and Mackay 2001; Dung et al. 2012;Kubota et al. 2013). Annual measurements of rainfall,throughfall, and stemflow volume showed that canopy interception of precipitation decreased by 5% after thinning(Matsuda H., Kyushu University Forest, unpublished data).Stand-scale canopy transpiration by plantations after thinning in the YEW decreased by 44% for the Chamaecyparis obtusa plot and 21% for the Cryptomeria japonica plot, in proportion to the decreases in sapwood area for the C.obtusa plot (44%) and the C. japonica plot (34%) (Tateishi et al. 2015). Thus, a decrease in evapotranspiration could have led to the increase in annual discharge after the thinning operation in this study. However, the decrease in evapotranspiration by plantations could have been offset by an increase in water consumption due to the increased biomass of understory vegetation after thinning in the studied watershed (Ide et al. 2016). Ide et al. (2016)showed that biomass of understory vegetation before the thinning (approximately 40 g dry mass m-2) increased by approximately 460 g dry mass m-2after the thinning at the YEW. Such an increase in biomass of understory vegetation could increase forest-floor evaporation (Sun et al. 2016).
Although the most convincing design for comparing watershed treatments is the paired watershed method, little difference was observed in annual precipitation between 2011 (pre-thinning) and 2013 (post-thinning; Table 2), nor did the volume of individual precipitation events or intensity of precipitation differ distinctly before and after thinning (Fig. 2). Therefore, the effects of thinning could be evaluated using single watershed approach in this study.
Although there was little difference in annual discharges before and after thinning, there was an increase in direct flow during stormflow periods (Table 2). These results indicated that thinning affected the proportions of components of total water discharge. Sun et al. (2017) also showed that hydrological properties including accumulated quick flow, flow rise and flow drop were increased 1 year after the thinning at the same watershed, thus supporting thinning effects on hydrological processes. The higher proportion of direct flow during stormflow periods after thinning could be partly caused by soil disturbance from skid trails. The skid trails were constructed immediatelybefore thinning for the logging operations that disturbed the soil surface.

Table 3 Summary of stream water concentration of ions(μmol L-1) during non-storm and storm-flow periods before and after thinning
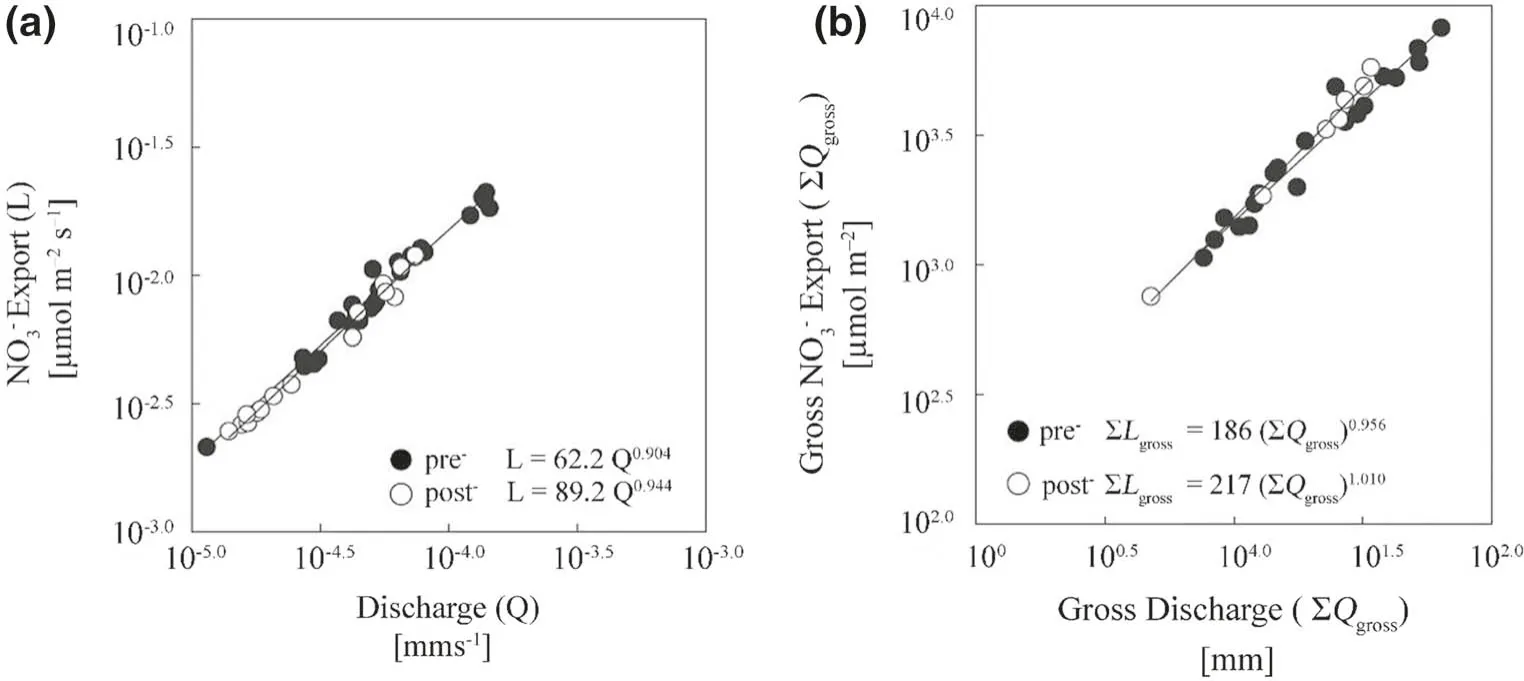
Fig. 5 Relationships a between discharge (Q) and export of (L) during the baseflow period and b between gross discharge (ΣQgross) and gross export of NO3- (ΣLgross) during stormflow periods at the Yayama Experimental Watershed in Japan
Table 4 exports (kg N ha-1 a-1) before and after thinning

Table 4 exports (kg N ha-1 a-1) before and after thinning
TotalDuring non-stormDuring storm Pre-thinning35.8 (100%)25.3 (70.7%)10.5 (29.3%)Post-thinning36.5 (100%)24.3 (66.5%)12.2 (33.4%)
We infer that the increased direct flow was into the stream occurred by subsurface flow, rather than overland flow. Soil compaction resulting from skid trails was shown to reduce water permeability (Startsev and McNabb 2000;Cambi et al. 2015), which may increase overland flow.Previous studies reported the significant contribution of overland flow from forest roads to storm runoff in small catchments (Wemple and Jones 2003; Negishi et al. 2008;Nagatsuka et al. 2014). On the hillslopes in the studied catchment, overland flows could have increased after thinning because rill erosion of skid trails occurred during a series of large precipitation events (event precipitation:146-381 mm) in June and July 2012 (Fig. 3). However,overland flow was probably not the main component of the increased direct flow into the stream detected in this study.Because overland flow can vary greatly on spatial scales,overland flow at the hillslope scale does not always directly increase direct flow at the catchment scale (Joel et al. 2002;Parsons et al. 2006; Gomi et al. 2008). The results of Gomi et al. (2008) imply that a connective network of overland flow between the source and the lower end of hillslopes is essential for overland flow to directly contribute to runoff generation at the catchment scale. In the studied catchment,pathways of concentrated surface flow such as rills have not been observed on or near the skid trails or in the vicinity of channels. Therefore, the direct contribution of overland flow on the hillslope to direct flow into the stream would be small in the studied watershed.
Instead, subsurface flow could increase direct flow in the studied watershed. Subsurface flow could be increased by infiltration of the increased overland flow into the edge of rills and road shoulders between the hillslopes and channels, areas with a high infiltration capacity. Therefore, the increase in direct flow after thinning in the studied watershed could be attributed to an increase in subsurface flow converted from overland flow via skid trails, rather than a decrease in evapotranspiration after thinning.
Effect of forest thinning on stream water quality
Before and after thinning, ion concentrations in stream water during the nonstorm and the storm periods differed little (Fig. 4, Table 3), indicating that thinning did not lead to short-term changes in the quality of stream water exported from an N-saturated forest. These negligible effects of thinning on stream water quality could be because the discharge was mainly composed of baseflow(Table 2). The small ratio of direct flow to baseflow in the total discharge is a characteristic of this watershed. The proportion of direct flow contributing to the total discharge in the watershed [16% (direct-flow: 260 mm/total discharge: 1641 mm, Table 2)] was smaller than reported for other similar-sized forested watersheds in Japan [67%(Chiwa et al. 2010b); 30% (Himeno and Isamoto 2002)]and the United States [21% (Likens and Bormann 2013)].The small difference between the pre- and post-thinning solute concentrations in the stream water in the nonstorm and stormflow periods (Table 3) indicated that baseflow largely affects stream water quality.
As mentioned before, we observed a marked increase in water discharge from direct flow (Table 2) that would affect stream water chemistry. However, the ion concentrations in stream water were not affected by the marked increase in direct flow (Fig. 3, Table 3). This result supports the reason for the increase in direct flow proposed above; that is, subsurface flow rather than overland flow increased direct flow in the studied watershed. The small difference in the solute concentrations before and after thinning indicates that thinning did little to change the dominant pathway of direct flow.
Thinning may increase soil nitrification rates (Morris and Boerner 1998; Inagaki et al. 2008; Zhuang et al. 2014),decrease N uptake by plants (Inagaki et al. 2008), and decrease dry deposition (Bäumler and Zech 1997). These changes may alter the solute concentrations in the directflow component. However, any changes in the water quality of direct flow are unlikely to affect stream water quality because direct flow contributed only a small amount to the total discharge in the watershed (Table 2).Also, since thinning barely affected annual discharge, it is reasonable to expect that the soil nitrification rate did not increase markedly at the study site because soil water contents were probably unaffected (Table 2). Furthermore,the decrease in stand-scale N uptake of the plantation resulting from the decreased basal area could compensate for the increase in N uptake of understory vegetation due to the increased understory biomass.during storm-flow periods were slightly higher after forest thinning (15% increase, 10.6 vs. 12.2 kg N ha-1a-1,Table 4) that was proportional to the increased direct flow after thinning [16% increase; before (470 mm) and after(561 mm) the thinning, Table 2]. This result indicates that forest thinning does not affect annual N exports, but it changes the proportion of N exports during nonstorm and stormflow periods.
Our experimental measurements during the first year after thinning was relatively short; however, hydrological responses to the thinning are evident even after 1 year in this study watershed (Sun et al. 2017), thus supporting that thinning affects hydrological processes. Further experiments will be required to evaluate long-term effects of thinning on hydrologicalloss from N-saturated plantations.
Conclusions
Thinning in a poorly managed plantation has been proposed to increase water resources, including water discharge, and to affect water quality (Gundersen et al. 2006;Grace et al. 2006; Onda et al. 2010). However, little was known about the effects of forest thinning on N exports from N-saturated plantation forests. The results of our study indicate that forest thinning does not lead to significant short-term reduction in annual N exports from the N-saturated plantation forest, but it does change the proportion of N exports during nonstorm and stormflow periods.
AcknowledgementsWe thank Y. Endo, T. Sano, and K. Nagase(Tottori University) for handling water samples. We thank members of the Eco-hydrology Laboratory, Kasuya Research Forest (Kyushu University) especially M. Komatsu, H. Matsuda, S. Yunohara, and H.Sun for help with fieldwork. We are grateful to M. Watanabe of the Kahanzan Forest Owner’s Cooperative for the thinning operation. The cost of publication was supported in part by a research grant for Young Investigators of the Faculty of Agriculture, Kyushu University.
Annual flux
There was little difference in the LQ relationship before and after thinning (Fig. 5); thus, annual DIN exports differed little before and after thinning (Table 4). Even so,high levels of DIN exports both before and after thinning indicate this plantation forest is a large non-point source of N in eutrophic stream water, as reported for urban and agricultural areas (Chiwa et al. 2012, 2015). DIN exports
杂志排行
Journal of Forestry Research的其它文章
- Past, present and future of industrial plantation forestry and implication on future timber harvesting technology
- Effects of climate changes on distribution of Eremanthus erythropappus and E. incanus (Asteraceae) in Brazil
- Effects of climate and forest age on the ecosystem carbon exchange of afforestation
- Effect of gap size and forest type on mineral nitrogen forms under different soil properties
- Floristic analysis and dominance pattern of sal (Shorea robusta)forests in Ranchi, Jharkhand, eastern India
- Population structure, age and growth rates of conifer species and their relation to environmental variables at Malam Jabba,Swat District, Pakistan
