BER Performance of Finite in Time Optimal FTN Signals for the Viterbi Algorithm
2020-05-14SergeyMakarovIlyaLavrenyukAnnaOvsyannikovaSergeyZavjalov
Sergey B.Makarov|Ilya I.Lavrenyuk|Anna S.Ovsyannikova|Sergey V.Zavjalov
Abstract—In this article,we consider the faster than Nyquist(FTN)technology in aspects of the application of the Viterbi algorithm(VA).Finite in time optimal FTN signals are used to provide a symbol rate higher than the “Nyquist barrier”without any encoding.These signals are obtained as the solutions of the corresponding optimization problem.Optimal signals are characterized by intersymbol interference(ISI).This fact leads to significant bit error rate(BER)performance degradation for “classical”forms of signals.However,ISI can be controlled by the restriction of the optimization problem.So we can use optimal signals in conditions of increased duration and an increased symbol rate without significant energy losses.The additional symbol rate increase leads to the increase of the reception algorithm complexity.We consider the application of VA for optimal FTN signals reception.The application of VA for receiving optimal FTN signals with increased duration provides close to the potential performance of BER,while the symbol rate is twice above the Nyquist limit.
1.Introduction
Faster than Nyquist(FTN)random binary signal sequencess(t)with the signal piece of duration larger than one sym bol intervalTcould provide a symbol rate higher than the “Nyquist barrier”without any encoding,as in[1]to[6].The high bandwidth efficiency is achieved by transmitting information using signals with the durationTs=LT(L=2,3,…)and energyEs,which is focused mainly on a relatively small(less than 20% of the durationTs)time interval.Such signals are generated using a digital filter,which provides a narrow band of occupied frequencies ΔFand a specific information transfer rate.Message transmission occurs under intersymbol interference (ISI)conditions,caused by the overlapping of adjacent signals,which leads to the significant reduction of the bit error rate(BER)performance of reception at high channel message rates.
To increase the BER performance of message reception,algorithms for coherent “reception in the whole”packets of sequences of FTN signals are used.It is shown in[3]and[4]that when using FTN signals built on the basis of root raised cosine(RRC)pulses with a value of the roll-off factor of the frequency response,the energy losses are about 12 dB with a probability of error per bitp=10–3.These costs exceed the potential signal-to-noise ratio for given BER of 5 dB.
It is reasonable to formulate the problem of reducing energy costs due to the transition from the method of generating signals using bandpass filtering to the application of the method of constructing signals based on the solution of the optimization problem in the form ofs(t),as in[6]to[10],with the introduction of a constraint on the cross-correlation coefficient or Euclidean distance,as in[7]and[11]to[14].
The criterion for optimizing the shape of such FTN signals is based on the principle of choosing the maximum density of the energy spectrumG(f),determined by the rate of out-of-band emissions ofG(f)outside the band ΔF.The occupied frequency band ΔFis determined by the level of the decline in the energy spectrum(for example,ΔF–50dB).As shown in[13]to[15],the shape of the optimal FTN signals of the durationTs=LTchanges as the message transmission rateRincreases.There is a decrease in the time interval,where the main part of the energy is concentrated;thus,this leads to an expansion of the occupied frequency band of the energy spectrum of the transmitted random sequence of signals.
A random sequence consisting of binary modulatedNtime-limited single optimal FTN signalssopt(t)with the durationTs=LT(L=2,3,…)and energyEopthas the following form:

where the valuescn=±1 have equal probabilities of occurrence for each valuen.The coefficientξ(0<ξ<1)determines the symbol rate,which is equivalent to the bit rate in the case of the binary alphabet.A feature of such signals is the controlled level of ISI.The energy reception efficiency is estimated by calculating the Euclidean distance.The square of the Euclidean distanced2(i,k) between different realization of two random sequencesyi(t)andyk(t)in (1)determines BER and can be calculated by the following formula:

The minimum normalized Euclidean distance is defined as

As a transmission channel,we consider the channel with the additive white Gaussian noise(AWGN)n(t)with an average power spectral density ofN0,which allows us to estimate the place of optimal FTN signals on the Shannon plane and to compare their efficiency with the Shannon boundary.
This paper considers the possibility of using time-limited optimal binary FTN signals to increase the BER performance of message reception when approaching high specific transmission rates in a channel with AWGN.
2.Forms of Optimal Binary FTN Signal Sequences
For example,Fig.1 shows the implementation forms of a random sequence as(1)of optimal FTN signals[10],[16]-[18]with the durationTs=8Tforξ=1/2 (R=2 /T,Fig.1 (a))andξ=1/2.5 (R=2.5/T,Fig.1 (b)).In these figures,the sequence ofcnhas the form:+1,+1,–1,and +1.Thin lines indicate the forms of single signals corresponding tocn,and thick lines indicate the total sequences of signals.It can be seen that the ISI level is quite high in these sequences.
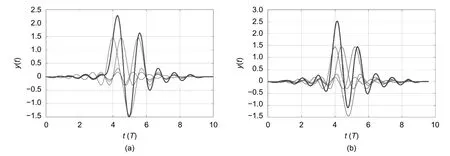
Fig.1.Sequence of optimal FTN signals with symbol rates:(a)R=2/T and(b)R=2.5/T.
The shape of the optimal FTN signal was obtained for the transmission rateR=2/T(Fig.1(a))with a restriction on the cross-correlation coefficientK0=0.01 for the rate of the out-of-band emission level 1/f4,as shown in[10]and[13]to[15].Fig.1(b)shows the sequence of these signals transmitted at a speed ofR=2.5/T.
As can be seen from a comparison of the forms of the sequences shown in Figs.1(a)and(b),as the transmission speed increases,the influence of neighboring signals falling into this analysis interval increases significantly.
Let us consider the energy spectra of FTN signals based on the optimal pulses and,for comparison,based on RRC pulses with a roll-off factorβ=0.3.The normalized energy spectra ∣S(f)∣2/∣S(0)∣2are represented in Fig.2.HereS(f)means the spectrum of the single pulse andS(0)means the absolute value of the spectrum at zero frequency.
Fig.2 demonstrates the energy spectra for FTN pulses obtained for the transmission ratesR=1/TandR=2/Tand the energy spectra for FTN signals constructed on RRC pulses[3]-[6]for the transmission rateR=1/T.It can be seen that,atR=1/T,the shapes of the energy spectra of optimal FTN signals and signals based on RRC pulses are very close,but for the double-speed,they differ significantly.This is due to the fact that with an increase in the transmission rate by a factor of 2,the duration of the main lobesopt(t)decreases(see Fig.1(a)),which leads to the expansion of the spectrum.
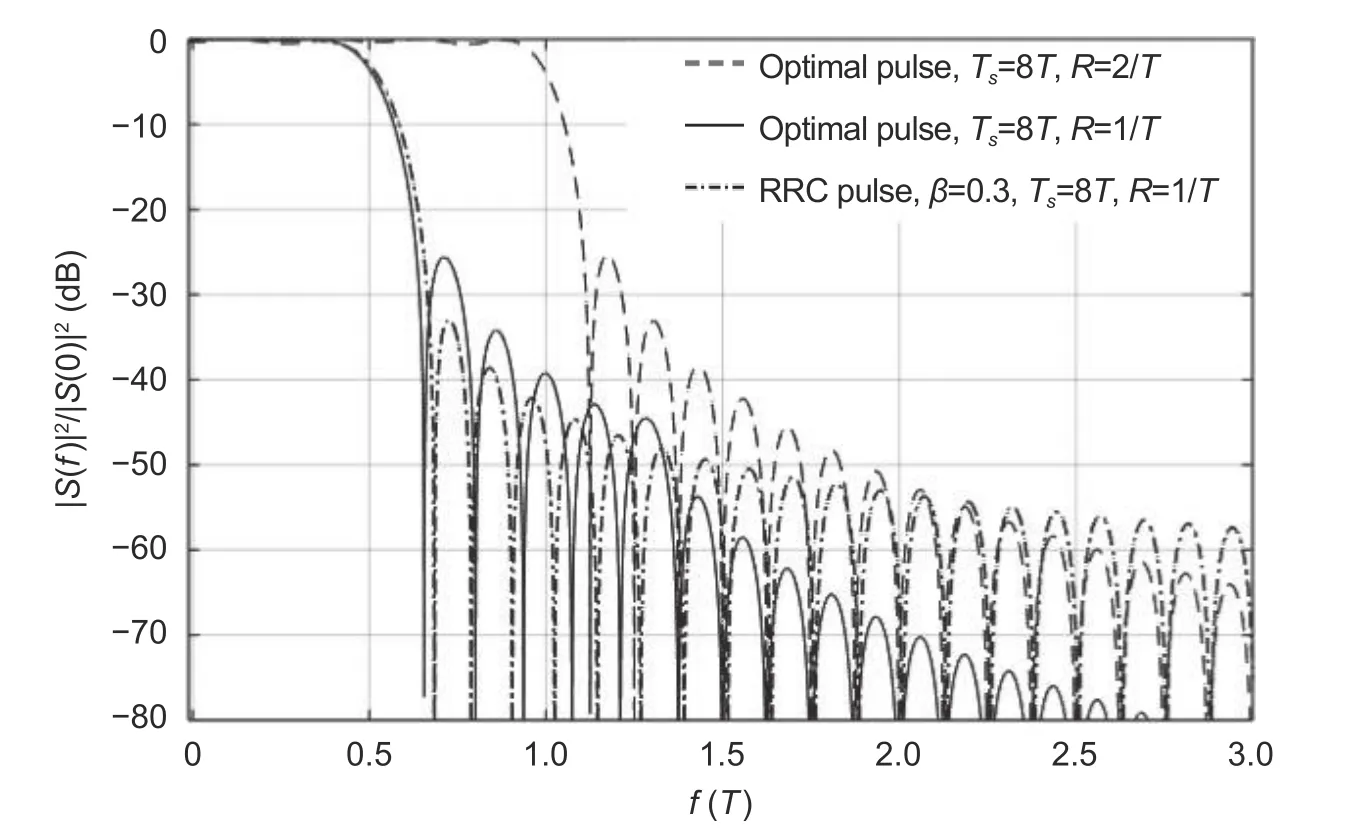
Fig.2.Comparison of the normalized energy spectra of optimal FTN signals.
3.Application of the Viterbi Algorithm for Optimal FTN Signals Reception
The presence of ISI when transmitting FTN signals significantly worsens the reception conditions even in channels without fading.The use of coherent elementwise reception algorithms involves the determination of the phase of the carrier wave,clock frequency,and cyclic synchronization in packet message transmission modes.These tasks are solved by the methods of constructing the message preamble.However,even in these close to ideal reception conditions,we need to consider the influence of ISI.The most effective reception algorithms in these conditions are the maximum likelihood sequence estimation (MLSE) reception algorithms with the implementation of weighted enumeration of all possible combinations of the received signals.The hardware complexity of implementing such algorithms does not allow us to achieve high absolute transmission rates.Therefore,it is advisable to consider well-known approximations,for example,the Viterbi algorithm(VA)[19],[20].
Let us consider the maximum likelihood reception method.The task of receiving according to this method of MLSE is to find a sequence of symbolsthat would minimize the Euclidean distance between the corresponding sequence of optimal FTN signalsy(t)in(1)and the received noisy signalx(t)=y(t)+n(t).It is necessary to determine the numberp=1,2,…,2Nof the sequence,in the total number of variants of such sequences:

whereyp(t)is thepth sequence of optimal FTN signals in(1),providing the minimum Euclidean distance;∥⋅∥2is the operator of the Euclidean norm(the Euclidean distance in the functional space of signals),andYis the set of all possible sequences of optimal FTN signals in (1).The complexity of this reception algorithm depends on the sequence lengthN.For example,for the binary alphabet and the duration of the packet of signals equal toN=10,it is necessary to analyze 1024 possible sequences of optimal FTN signals with ISI and calculate(4)for each of these sequences.
The search for such a sequence can be implemented using VA,the computational complexity of which depends on the depth of ISI(durationTs),the size of a constellation,and the message transfer rate.
Let us consider the application of VA for the example of receiving binary optimal FTN signals with the duration ofTs=2Tfor a transmission rate ofR=1/T.Suppose that during the formation of a message package,a known initial group of symbols is added,which allows starting the process of message demodulation using VA with known initial states.
At each clock intervalT,the waveform is determined by a binary combination of 2 symbols(states).With each new clock interval,a combination change occurs.This process could be described conveniently by a trellis transition diagram,which is shown in Fig.3.The vertical axis shows the states that determine the possible combinations of signals in the current time interval.For the durationTs=2Tthere are 4 possible states(00,01,10,and 11).In the time intervalT,the values of current and previous symbols influence the shape of the total signal.The movement along the lattice diagram horizontal axis corresponds to the transition along the edges from the state in the interval(k–1)Tto the state in the clock intervalkT.From each state,a transition to certain two states is possible.

Fig.3.Search by the trellis transition diagram with a known initial state.
In the general case,when the duration of the signalsopt(t)isTs=LT,the size of the binary state will beL,and at each step of the algorithm,M LEuclidean distances between the received signal will be calculated at a given time interval(the number of states in the array will beM L).
The solid lines in Fig.3 indicate the appearance of the symbol “–1”,and the dotted lines indicate the appearance of “1”;the black states are the states corresponding to the transmitted sequence of symbolsin(4)equal to[1,1,–1,1,–1,–1,–1]with the initial state[00](Fig.3).In this example,the initial and final states are considered to be known.Their numbers depend on the durationTsof the signal and the constellation size.During demodulation,a part ofsopt(t)is received at each time interval.After that,the Euclidean distances between the received signalx(t)and the four possible forms of the expected reference signalsy(t)=sopt(t)+sopt(t–T)are calculated on the considered time intervalT.When the signal lengthsopt(t)is equal toTs=2Tand the transmission rateR=1/T,the shape of the expected signal at a given time interval is affected by the given transmitted signal and one previous signal.Each iteration VA is used to calculate the Euclidean distance and add the obtained values to the distance values(metrics)of all paths calculated in the previous iterations on the trellis diagram(Fig.3).After updating the metrics,a search for surviving paths is made.The metrics of all paths leading to the same state are compared,and the path with the smallest metric is selected.For a known initial and final state,the only sequence of transitions from the initial state[00]to the final state[00]is determined from the diagram in Fig.3.This sequence is optimal,as(4),in the considered sense of estimating the sequence of the transmitted symbols
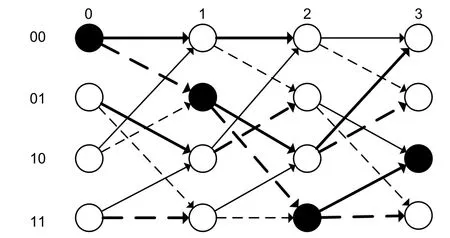
Fig.4.Search by the trellis diagram of transitions with an unknown initial state.
The condition of a known initial and final state is not necessary,since the sequence of transitions starting with erroneously selected values of the first state is most likely to be interrupted at some stage of the calculation.An example of a grid search with an unknown initial state is shown in Fig.4.
For an unknown initial state,the movement along the diagram in Fig.4 occurs simultaneously from all initial states and at the zero step,the metrics of all states(4 metrics)are calculated.The paths are determined from all states(00,01,10,and 11)to all possible(8 transitions)in the next step.As a result,after the first iteration(step 0 to step 1 in Fig.4),2 transitions lead to each state.The metrics of these transitions are added to the metrics of the initial states.There are 2 paths to each state in step 1.The path that has a smaller metric is selected,and the other is discarded.Thus,there are four surviving paths remained.Then in the second iteration (step 1 to step 2),8 transitions are calculated again.Their metrics are added to the previous metrics of the surviving paths(path metrics are updated).According to this algorithm,the movement along the diagram in Fig.4 occurs.
When moving along the trellis diagram and removing non-surviving paths,there is a high probability that at thekth step in the first column of the diagram all paths merge into one and only one edge comes out from only one node.In this case,a decision about the first group of the received symbols can be done and then free up the memory resources of the demodulator.Thus,when passing through the trellis with a fixed interval(depth of reverse lookup),we can regularly make decisions about the next group of symbols.
4.Simulation Model of Transmission and Reception of Optimal FTN Signals
Let us evaluate the possibility of using time-limited optimal binary FTN signals to increase the BER performance of receiving messages using a simulation model.Fig.5 shows the schematic representation of the operation of VA,discussed in the previous section.

Fig.5.Schematic representation of the VA operation.
In accordance with the description of the work on the trellis transition diagram (Figs.3 and 4),the received signalx(t)is demodulated at time intervals[kT,(k+1)T].The Euclidean distances betweenx(t)and the reference signals are determined.Then,the path metrics are updated and the surviving paths are searched.The depth of the backtrace in the simulation model may be equal to the duration of the entire message packet.In this case,the sequence of the estimates of the transmitted symbols will be generated immediately after processing all the received signals.The depth of the backtrace also may be less than the duration of the packet.
For example,if the packet size isN=100 symbols,then the depth of the reverse lookup is 20 symbols.Then the evaluation of the first symbol will be made after processing 20 times of interavls.The evaluation of the second symbol will be made after processing the 21st interval,etc.With this demodulation mode,there will be a fixed delay in receiving a message equal to the depth of the reverse lookup.
Fig.6 shows a simulation model for transmitting and receiving optimal FTN signals,where S corresponds to an array of reference signals,Ldindicates the duration of the reference signal in the demodulator,andTbacktraceindicates the depth of the reverse lookup.
The simulation model is implemented in the MATLAB environment.It implements three procedures:The formation of a sequence of optimal FTN signals in(1)with increased duration and a given symbol rate and the transmission over the channel with AWGN and reception according to the Viterbi algorithm.The generation of optimal FTN signals is implemented using the formation of digital delta pulses and further linear convolution with the impulse response of the forming digital filter,equivalent to a sequence of signal samples.The duration of the transmitted useful signal isTs=LT,and the duration of one clock interval is equal tondiscrete samples.The Baud rate is controlled by the parameterξ.There areξnsamples per time interval.
5.Results of the Simulation
To estimate the losses associated with the operation of VA with known and unknown initial states of the trellis,we consider the results of the simulation for different lengths of the message packet.Fig.7 shows the error probability values from the signal-to-noise ratio(Eb/N0,whereEb=Eopt)when using the VA reception of optimal FTN signals with the duration ofTs=8T(Fig.1)and a message transmission rateR=2/T.The packet lengths are 10 bits(Fig.7(a)),50 bits(Fig.7(b)),100 bits(Fig.7(c)),and 1000 bits(Fig.7(d)),respectively.
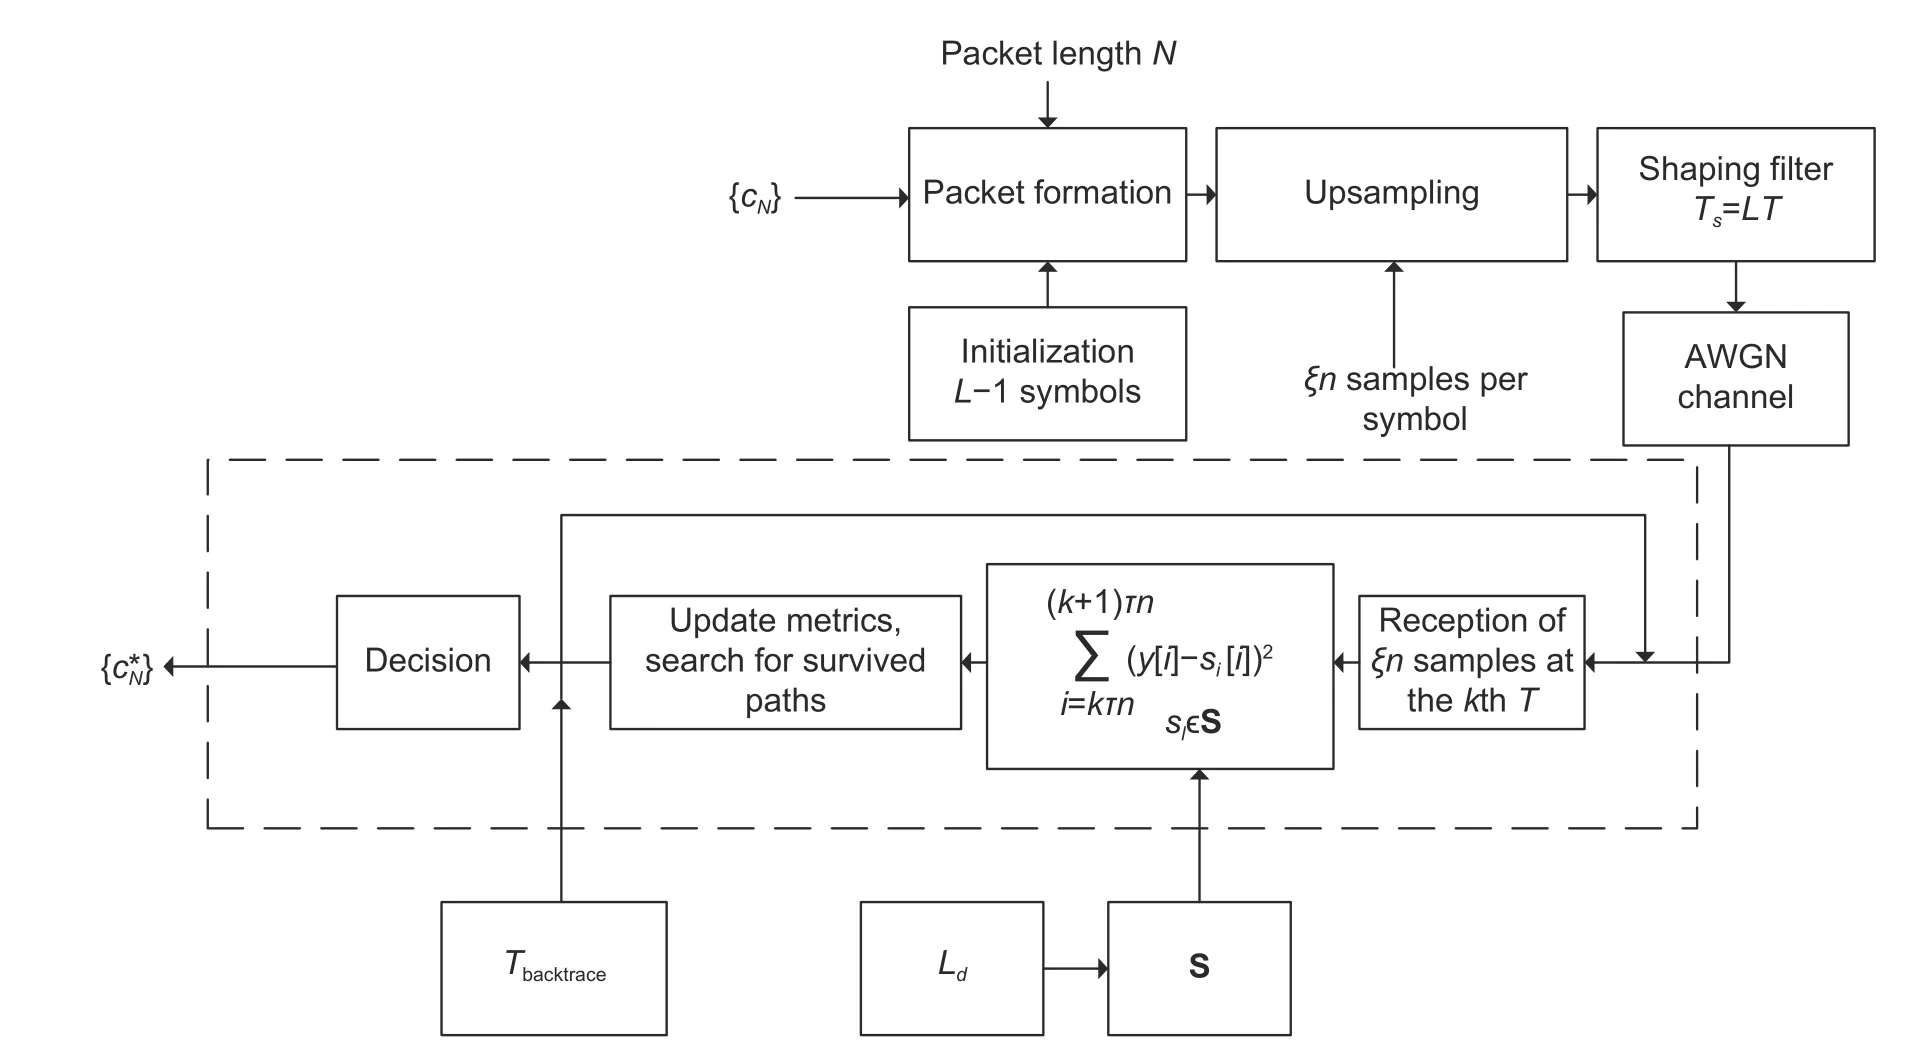
Fig.6.Simulation model of message transmission using optimal FTN signals and VA demodulator.
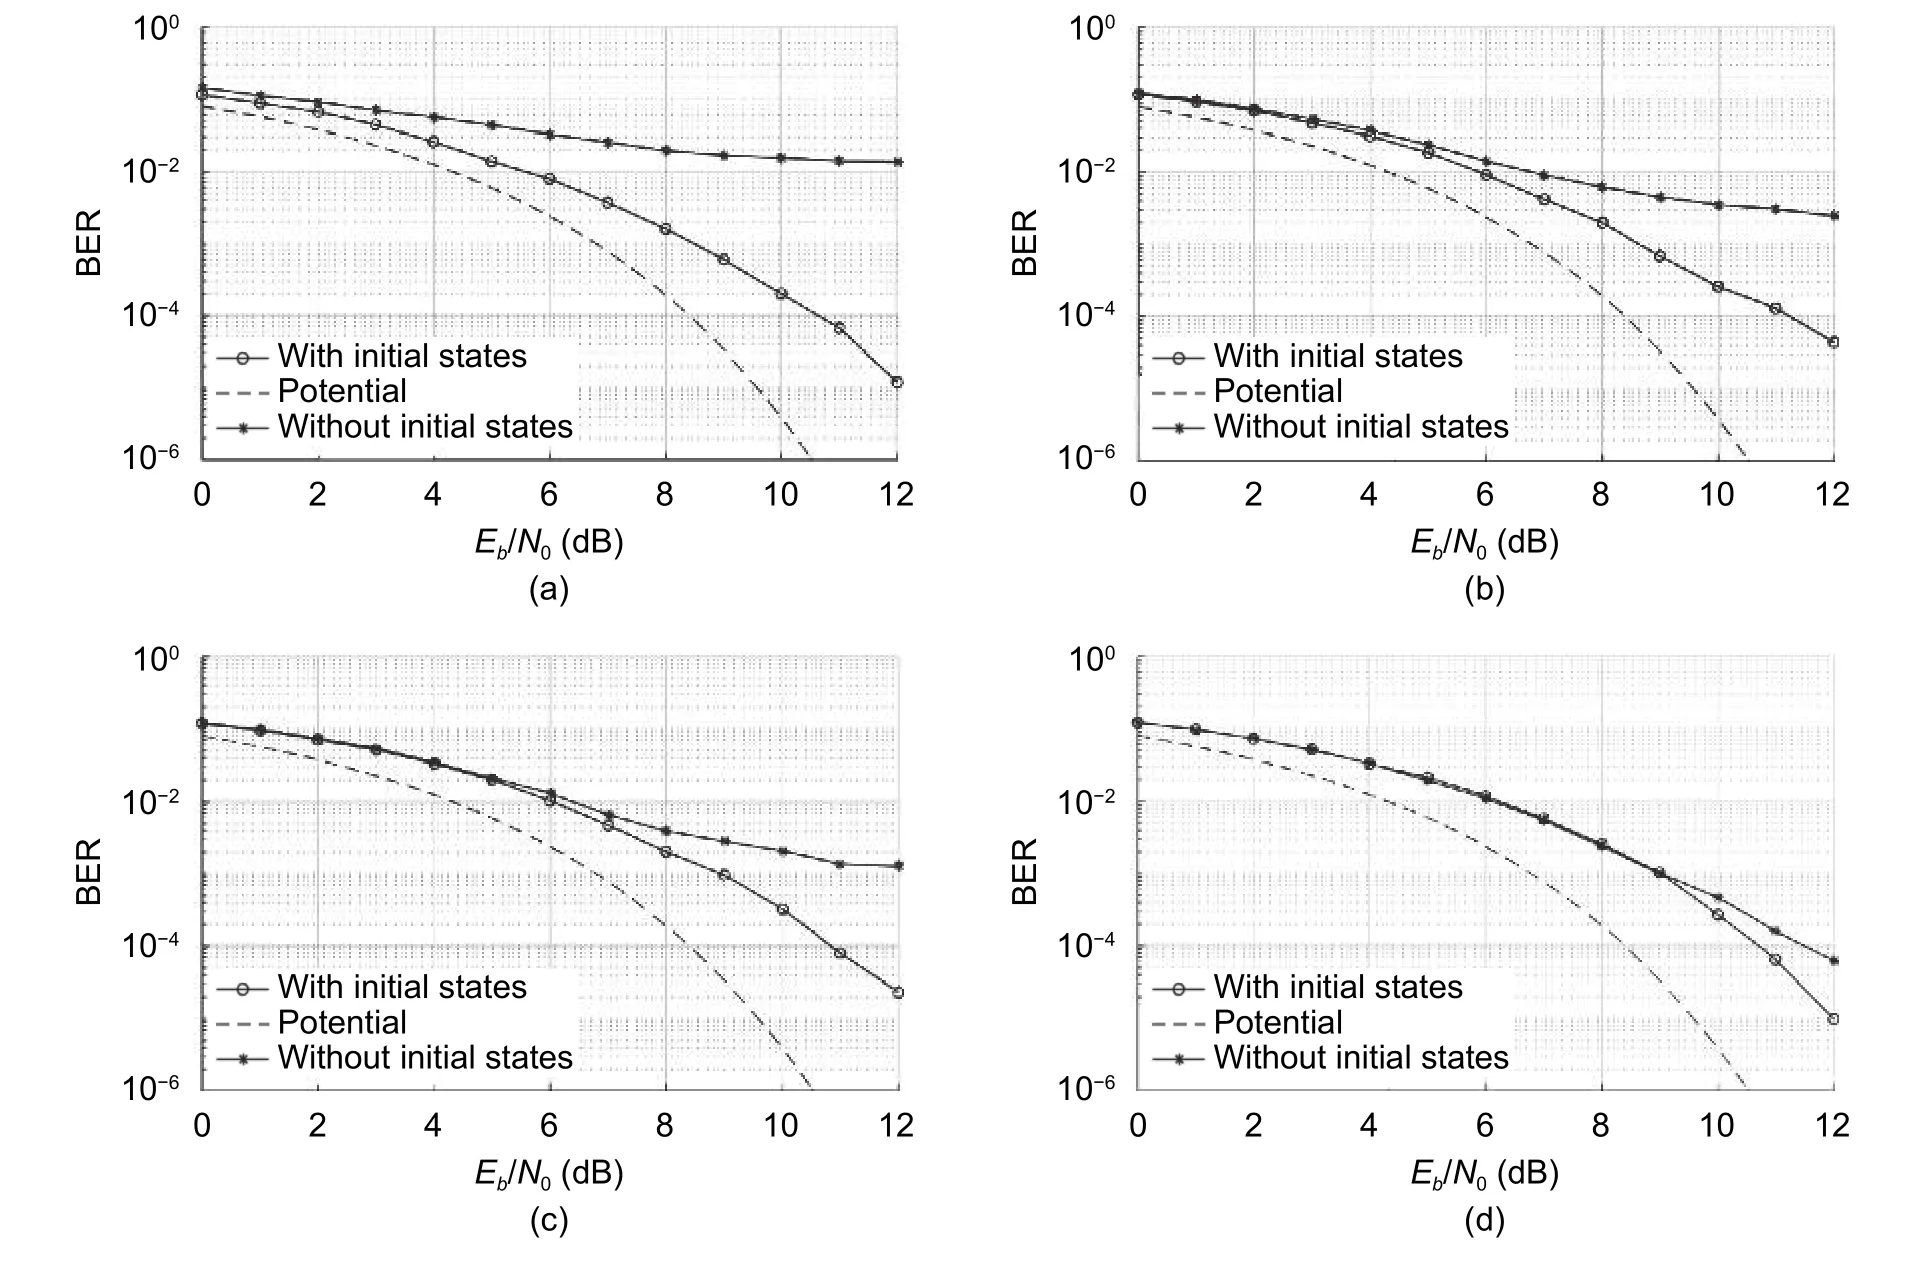
Fig.7.BER vs.Eb/N0 for different packet lengths:(a)10 bits,(b)50 bits,(c)100 bits,and(d)1000 bits.
As can be seen from a comparison of the curves in these figures,the following conclusions can be done.Firstly,with the short packet durationN=10 bits(Fig.7(a))and the absence of information about the initial and final states of the message packet,the BER performance of reception is significantly reduced compared with the reception mode when these states are known.
Energy losses are more than 7 dB with an error probability ofр=10–2.With a packet length of 50 bits(Fig.7(b)),the energy loss is about 4 dB atр=2×10⁻³.An increase in the packet length toN=100 allows one to reduce energy losses to 3 dB atр=2×10⁻³(Fig.7(c)).Secondly,starting from a packet length of 1000 bits(Fig.7(d)),the lack of information about the initial and final states of a message packet during demodulation using VA does not affect the BER performance of message reception.
Consider the results of receiving optimal FTN signals of the durationTs=8T(Fig.1)with a reduced observation interval fortanalysis(see Fig.1).In this case,during the demodulation procedure,only the central part closest to the main lobe of the signalsopt(t)will be considered.Such a statement of the demodulation problem is interesting from the point of view of reducing the computational cost to perform the search procedure by the trellis transition diagram (Figs.3 and 4).Fig.8 shows the dependence of the BER performance onEb/N0forR=2/Tfor various values ofLwith the duration of the transmitted optimal FTN signalTs=8T.It is seen that a decrease in the observation interval of signals fromLd=8 toLd=6 andLd=4 leads to the appearance of energy losses in the range of error probabilitiesp=10–4no more than 0.2 dB.With a further decrease in the observation interval toLd=2,the energy losses increase significantly and reach 4 dB atp=10–2.
Let us compare the BER performance of receiving optimal FTN signals and signals based on the RRC pulse.Fig.9 shows the results of the simulations of transmission and reception of optimal FTN signals and signals based on RRC pulses of the duration ofTs=8Tfor message ratesR=2/TandR=2.5/Twith the packet duration ofN=1000.
As can be seen from the comparison of the dependence in Fig.9,for optimal FTN signals at a transmission rate ofR=2/T,the error probabilityp=10–3is achieved atEb/N0=7.1 dB,and for signals based on RRC pulses that is achieved atEb/N0=9.0 dB.With an increase in the transmission rate of messages toR=2.5/T,the probability of errorsp=10–2is achieved atEb/N0=9.5 dB,and for signals based on RRC pulses the probability of errorsp=8×10⁻²is achieved atEb/N0=10 dB.For comparison,Fig.9 shows the potential BER curve for receiving binary signals with a rectangular envelope of the durationTand energyEs=Eb.As can be seen from a comparison of the curves in Fig.9,the application of VA for receiving optimal FTN signals with the duration of 8Tand a symbol rate 2 times higher than the Nyquist limit[2],[3],[15],[21]provides close to the potential performance of BER.Energy losses are less than 0.3 dB with an error probability ofp=10–4.

Fig.8.BER vs.Eb/N0 for various parameters Ld.

Fig.9.BER performance of optimal FTN signals and FTN RRC signals for different symbol rates.
6.Conclusions
The use of finite time optimal FTN signals in channels with AWGN makes it possible to obtain the high BER performance at message rates above the Nyquist barrier.It is shown that the application of VA for receiving optimal FTN signals with the duration of 8Twhen using a message symbol rate twice as high as the Nyquist limit provides the performance close to potential BER.Energy losses are not more than 0.3 dB with an error probability ofp=10–4.
The use of optimal FTN signals at a symbol rate greater than the Nyquist limit by a factor of 2 is achieved at lower energy costs than that when using signals based on RRC pulses for the same symbol rate.So for the probability of errorsp=10–3,the energy gain is about 2 dB.With an increase in the transmission speed up to 2.5 times higher than the Nyquist limit,this gain reaches 4.5 dB with an error probability ofp=8×10⁻².
Using VA to receive message packets consisting of optimal FTN signals is advisable with a packet length of at least 1000 bits when using the binary constellation.In this case,it is not required to use additional reception algorithms at the initial stage of demodulation or information about the initial and final states of the message packet.
Acknowledgement
The authors would like to express sincere appreciation to Peter the Great St.Petersburg Polytechnic University Supercomputing Center(http://www.scc.spbstu.ru)for the used computational resources in this paper.
杂志排行
Journal of Electronic Science and Technology的其它文章
- Machine Learning Application for Prediction of Sapphire Crystals Defects
- Method of Relaxation Rates Measurement in Proton-Containing Materials
- Image Processing of Biological Liquids Films for Medical Diagnostics
- Recognition of Film Type Using HSV Features on Deep-Learning Neural Networks
- Role of Electromagnetic Fluctuations in Organic Electronics
- Utilization of Extrinsic Fabry-Perot Interferometers with Spectral Interferometric Interrogation for Microdisplacement Measurement
